The University of Alabama in Huntsville
The official global temperature numbers are in, and NOAA and NASA have decided that 2015 was the warmest year on record. Based mostly upon surface  thermometers, the official pronouncement ignores the other two primary ways of measuring global air temperatures, satellites and radiosondes (weather balloons).
The fact that those ignored temperature datasets suggest little or no warming for about 18 years now, it is worth outlining the primary differences between these three measurement systems.
Three Ways to Measure Global Temperatures
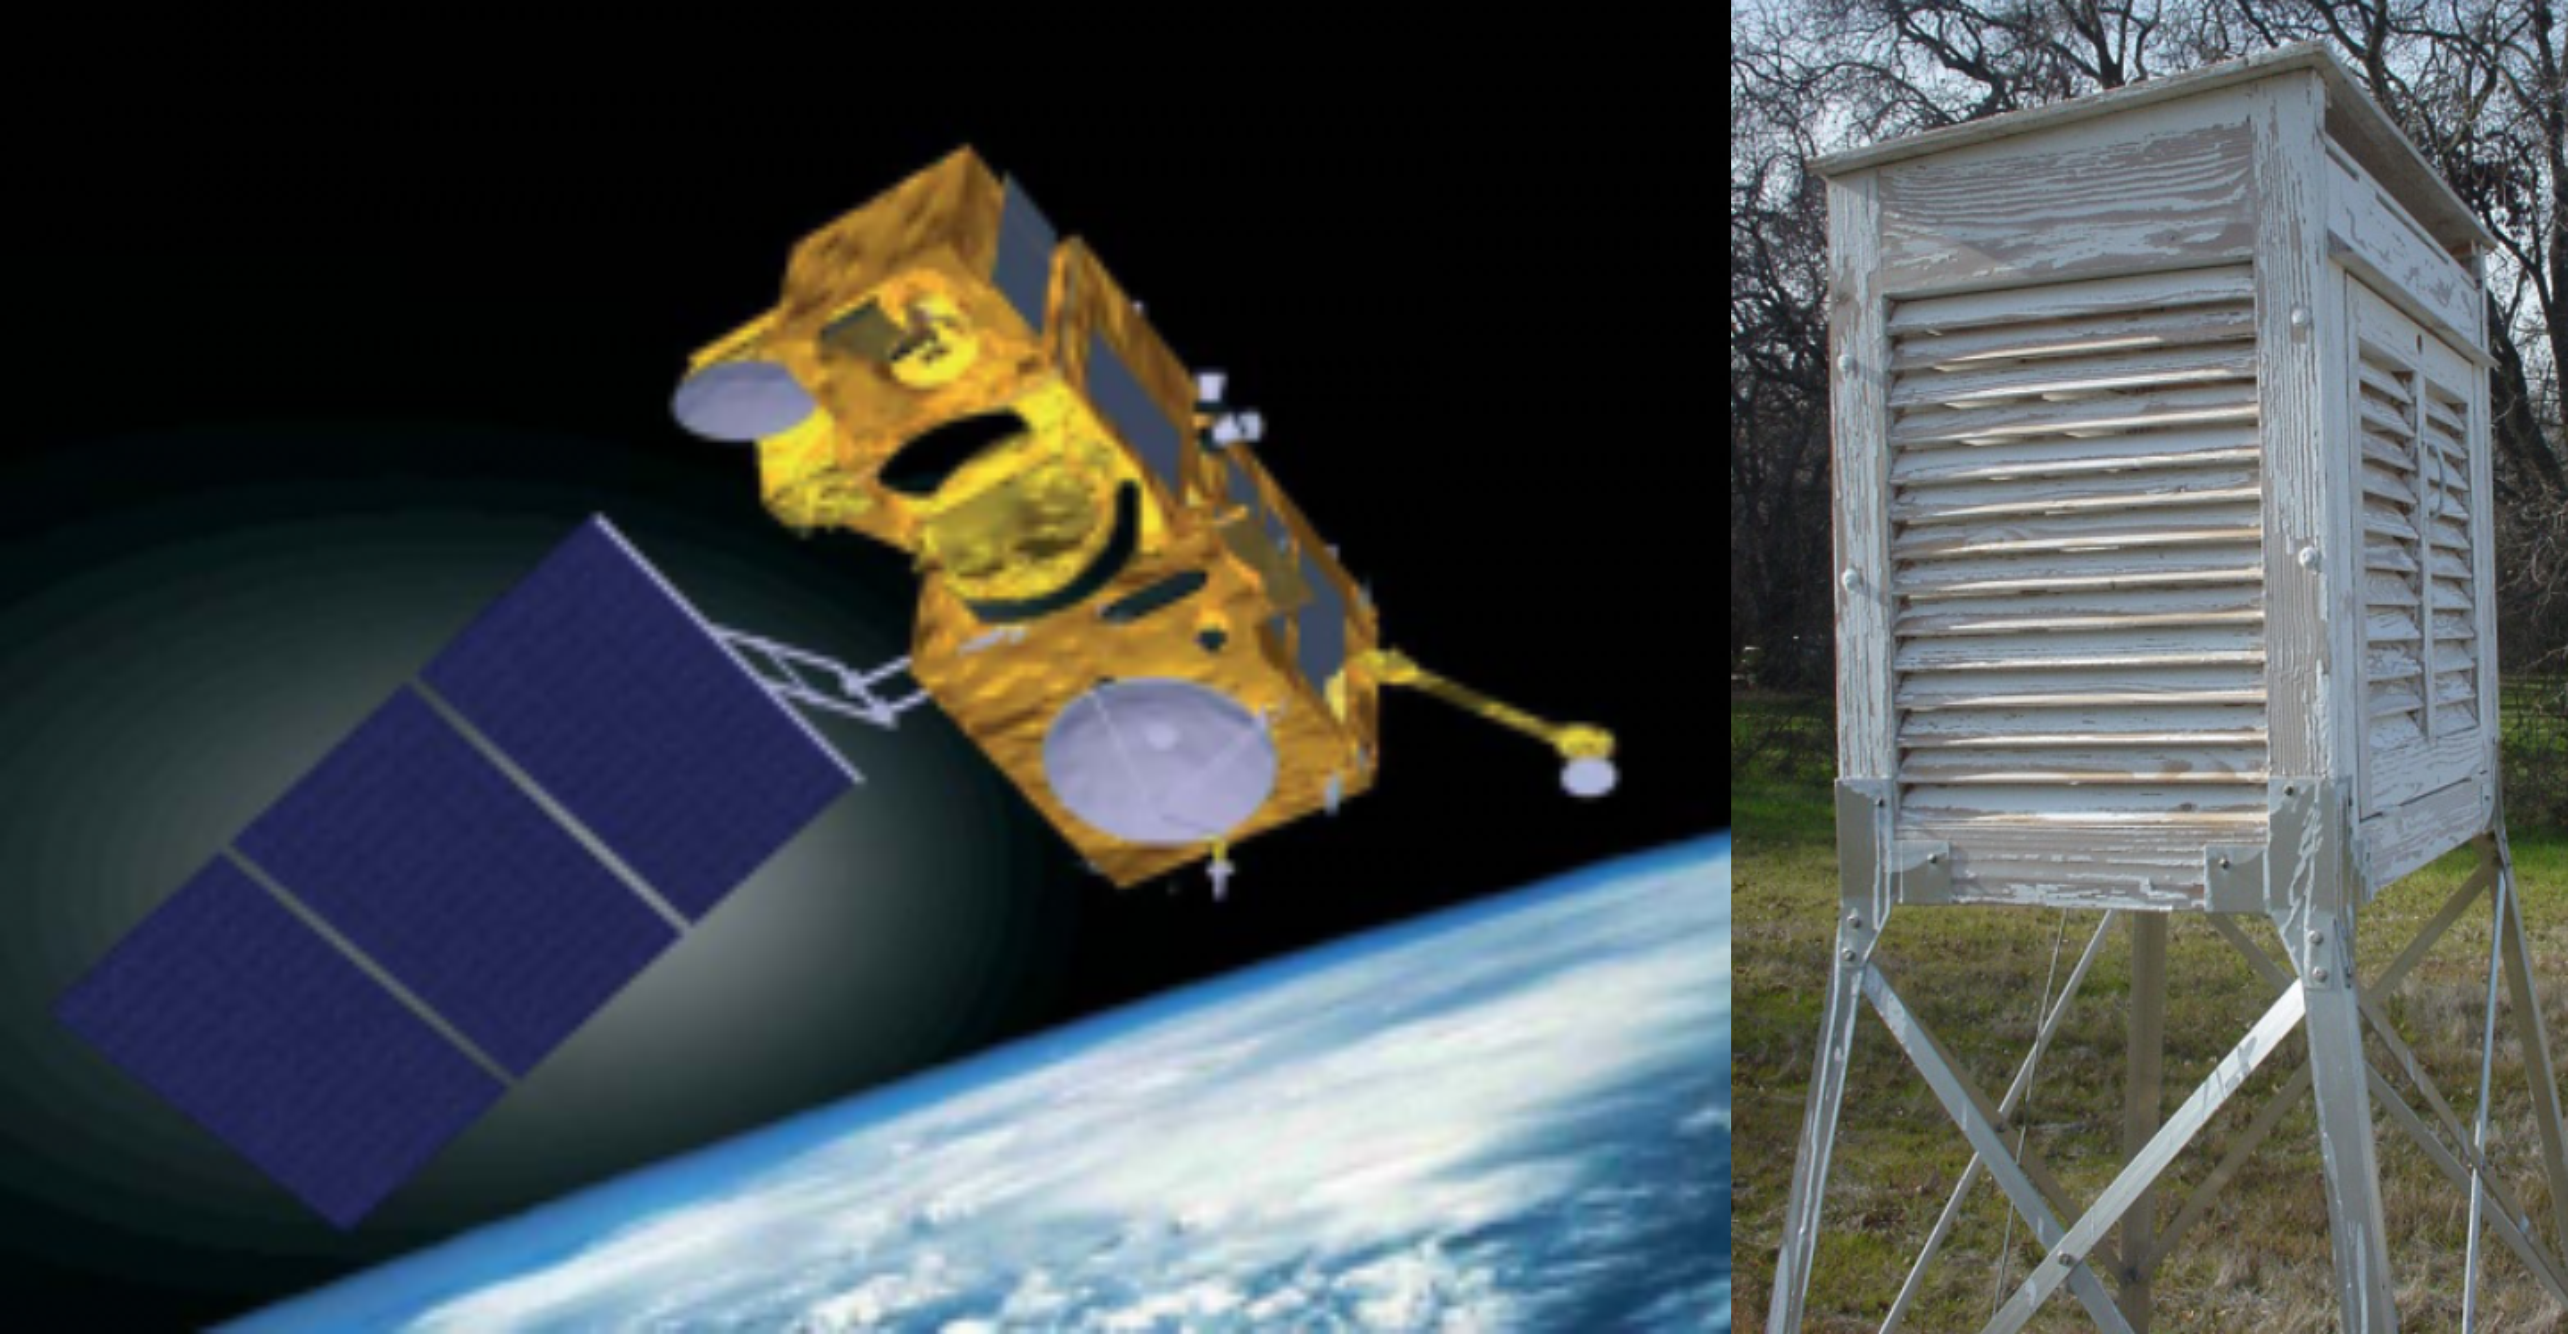
The primary ways to monitor global average air temperatures are surface based thermometers (since the late 1800s), radiosondes (weather balloons, since about the 1950s), and satellites measuring microwave emissions (since 1979). Other technologies, such as GPS satellite based methods have limited record length and have not yet gained wide acceptance for accuracy.
While the thermometers measure near-surface temperature, the satellites and radiosondes measure the average temperature of a deep layer of the lower atmosphere. Based upon our understanding of how the atmosphere works, the deep layer temperatures are supposed to warm (and cool) somewhat more strongly than the surface temperatures. In other words, variations in global average temperature are expected to be magnified with height, say through the lowest 10 km of atmosphere. We indeed see this during warm El Nino years (like 2015) and cool La Nina years.
The satellite record is the shortest, and since most warming has occurred since the 1970s anyway we often talk about temperature trends since 1979 so that we can compare all three datasets over a common period.
Temperatures of the deep ocean, which I will not address in detail, have warmed by amounts so small — hundredths of a degree — that it is debatable whether they are accurate enough to be of much use. Sea surface temperatures, also indicating modest warming in recent decades, involve an entirely new set of problems, with rather sparse sampling by a mixture of bucket temperatures from many years ago, to newer ship engine intake temperatures, buoys, and since the early 1980s infrared satellite measurements.
How Much Warming?
Since 1979, it is generally accepted that the satellites and radiosondes measure 50% less of a warming trend than the surface thermometer data do, rather than 30-50% greater warming trend that theory predicts for warming aloft versus at the surface.
This is a substantial disagreement.
Why the Disagreement?
There are different possibilities for the disagreement:
1) Surface thermometer analyses are spuriously overestimating the true temperature trend
2) Satellites and radiosondes are spuriously underestimating the true temperature trend
3) All data are largely correct, and are telling us something new about how the climate system operates under long-term warming.
First let’s look at the fundamental basis for each measurement.
All Temperature Measurements are “Indirect”
Roughly speaking, “temperature” is a measure of the kinetic energy of motion of molecules in air.
Unfortunately, we do not have an easy way to directly measure that kinetic energy of motion.
Instead, many years ago, mercury-in-glass or alcohol-in-glass thermometers were commonly used, where the thermal expansion of a column of liquid in response to temperature was estimated by eye. These measurements have now largely been replaced with thermistors, which measure the resistance to the flow of electricity, which is also temperature-dependent.
Such measurements are just for the air immediately surrounding the thermometer, and as we all know, local sources of heat (a wall, pavement, air conditioning or heating equipment, etc.) can and do affect the measurements made by the thermometer. It has been demonstrated many times that urban locations have higher temperatures than rural locations, and such spurious heat influences are difficult to eliminate entirely, since we tend to place thermometers where people live.
Radiosondes also use a thermistor, which is usually checked against a separate thermometer just before weather balloon launch. As the weather balloon carries the thermistor up through the atmosphere, it is immune from ground-based sources of contamination, but it still has various errors due to sunlight heating and infrared cooling which are minimized through radiosonde enclosure design. Radiosondes are much fewer in number, generally making hundreds of point measurements around the world each day, rather than many thousands of measurements that thermometers make.
Satellite microwave radiometers are the fewest in number, only a dozen or so, but each one is transported by its own satellite to continuously measure virtually the entire earth each day. Each individual measurement represents the average temperature of a volume of the lower atmosphere about 50 km in diameter and about 10 km deep, which is about 25,000 cubic kilometers of air. About 20 of those measurements are made every second as the satellite travels and the instrument scans across the Earth.
The satellite measurement itself is “radiative”: the level of microwave emission by oxygen in the atmosphere is measured and compared to that from a warm calibration target on the satellite (whose temperature is monitored with several highly accurate platinum resistance thermometers), and a cold calibration view of the cosmic background radiation from space, assumed to be about 3 Kelvin (close to absolute zero temperature). A less sophisticated (infrared) radiation temperature measurement is made with the medical thermometer you place in your ear.
So, Which System is Better?
The satellites have the advantage of measuring virtually the whole Earth every day with the same instruments, which are then checked against each other. But since there are very small differences between the instruments, which can change slightly over time, adjustments must be made.
Thermometers have the advantage of being much greater in number, but with potentially large long-term spurious warming effects depending on how each thermometer’s local environment has changed with the addition of manmade objects and structures.
Virtually all thermometer measurements require adjustments of some sort, simply because with the exception of a few thermometer sites, there has not been a single, unaltered instrument measuring the same place for 30+ years without a change in its environment. When such rare thermometers were identified in a recent study of the U.S., it was found that by comparison the official U.S. warming trends were exaggerated by close to 60%. Thus, the current official NOAA adjustment procedures appear to force the good data to match the bad data, rather than the other way around. Whether such problem exist with other countries data remains to be seen.
Changes in radiosonde design and software have occurred over the years, making some adjustments necessary to the raw data.
For the satellites, orbital decay of the satellites requires an adjustment of the “lower tropospheric” (LT) temperatures, which is well understood and quite accurate, depending only upon geometry and the average rate of temperature decrease with altitude. But the orbital decay also causes the satellites to slowly drift in the time of day they observe. This “diurnal drift” adjustment is less certain. Significantly, very different procedures for this adjustment have led to almost identical results between the satellite datasets produced by UAH (The University of Alabama in Huntsville) and RSS (Remote Sensing Systems, Santa Rosa, California).
The fact that the satellites and radiosondes – two very different types of measurement system — tend to agree with each other gives us somewhat more confidence in their result that warming has been much less than predicted by climate models. But even the thermometers indicate less warming than the models, just with less of a discrepancy.
And this is probably the most important issue…that no matter which temperature monitoring method we use, the climate models that global warming policies are based upon have been, on average, warming faster than all of our temperature observation systems.
I do believe “global warming” has occurred, but (1) it is weaker than expected, based upon independent satellite and weather balloon measurements; (2) it has been overestimated with poorly adjusted surface-based thermometers; (3) it has a substantial natural component; and (4) it is likely to be more beneficial to life on Earth than harmful.
“Measuring Global Temperatures: Satellites or Thermometers”
This is a keeper, such an important discussion of the science that I have used the Print Friendly add-on to make a PDF file read again off-line.
I would suggest a 5) in your final paragraph: “It is not all clear that the warming we’ve seen is in any way caused by human activity. And to the extent some of it might be, the effect is likely small compared to natural variations. We are still emerging from the last ice age, and have been for thousands of years.”
You nailed it! This is not only about Global Warming/Climate Change/Climate Disturbance. It’s about proving that humans are threatening the survival of the planet. All of the alarmist research (including the suppression or altering of contrary data) is aimed at that one goal. The solution? Less humans! As Obama’s science advisor put it, the aim is to de-develop the US economy.
David, we hammer the warmists for making predictions based on an infant science still full of unknowns and uncertainties, and here you are making a confident assertion based on the same unknowns and uncertainties. The true climate skeptic says, “Man may very well be causing global warming, or on the other hand we may not. I’m waiting until there’s sufficient evidence before I take sides.”
There are no septics. There are only those who accept robust empirical evidence, or those who deny the robust empirical evidence.
best,
D
I already replied to one of your other posts so I won’t repeat or engage in ad hominem comments; but really, “robust empirical evidence?” What “robust empirical evidence” are you referring to ? Even the AGW scientists don’t claim they have yet proven that humans are causing GW/CC/CD. It is still a hypothesis.
Another con who can’t use ad hom properly aside,
Even the AGW scientists don’t claim they have yet proven that humans humans are causing GW/CC/CD
Science doesn’t prove. Nevertheless, you are utterly wrong that scientists don’t claim they have yet proven that humans humans are causing GW/CC/CD
Educate yourself.
Best,
D
Dano2 shutdown your generating too much CO2.
Those AGW scientists use models to PREDICT data points in the future. Without FUTURE data points or a straight-line time/temperature curve, the future temperature inferences are just that: inferences. Past time/temperature curves are not straight line and not Al Gore’s hockey stick. The so-called “consensus” ignores more than 13,000 scientists (largely chemists and physicists) who do not accept the hypothesis (not fact) that man’s actions are a major contributor. Your third paragraph is mute evidence of the fallacy of your post: despite claiming correctly that science does not prove, you claim that Cass M is “utterly wrong” to say that “scientists don’t claim they have yet proven that humans are causing GW/CC/CD.” If the AGW proponents had proven their case, they would not need to call skeptics (i.e., scientists) “deniers.”
Comical punch line of Al Gore’s hockey stick aside,
Models don’t predict.
And duped into parroting 13,000 (sic) scientists! I LOLzed! That’s one of my favorite denialist jokes! I LOLz every time it comes up, even after all these years!!!!!111one
Best,
D
You usually resort to educate yourself earlier than this Dumbo.
Dano2 spew sewage eew.
This has little to do with predictions or confident assertions from either side. This is about evidence as written in geological and archaeological records. Climates have changed ad infinitum and by degrees and at rates comparable and/or faster/slower than before. Nothing is different than at any time in Earth history. There is nothing to explain.
Seeing as how satellites derive temperatures where people, plants and animals don’t live, the fetish over these temps is odd.
Best,
D
They don’t live in polar regions either, please make your point.
People, plants and animals live in the polar regions. So who knows what it is that you…erm…”think” you are trying to…”argue”.
Unless you are…”arguing” that all the people who live in dirigibles above the earth are underrepresented in the climate debate…
Best,
D
dano has NO FACTS, just global warming.climate change BULLSHYTE from faux “scientists” and greedy politicians looking for greater people control and higher taxes.
It’s an UnFact that People, plants and animals live in the polar regions. Who knew?
Best,
D
Dano2, that’s because satellite temperature measurements do not depend on people being at the locations being measured, That, and I know you will find this hard to understand, is why remote sensing is prefered over thermometers setting in boxes next to an air conditioning exhausts next to brick buildings and large concrete and asphalt parking lots.
Satellite people disagree with you, thanks!
Best,
D
And you spew love for False temps and government bullshyte.
Really? Dr Roy Spencer IS the “satellite people” and he doesn’t agree with you.
Bye troll
There are no other satellite people? Just Spencer?
Best,
D
You obviously don’t know what his title or job is. And you know and understand even less about remote sensing, yet you continue to troll on.
There are no other satellite peeps? Just them thar Roy?
Best,
D
Thanks for the great information.
Hopefully you don’t think your discussion (?) with a known troll is wasted, as the rest of us can learn a great deal from your excellent explanations, as a worthy adjunct to the above article.
GOOD LORD; The idiocy gets worse.
AI malfunction.
Dano, they are important to measure because they give indication that global warming is occurring. See this article: http://science1.nasa.gov/science-news/science-at-nasa/2000/ast21jul_1m/, and this graph: http://science1.nasa.gov/media/medialibrary/2000/07/27/ast21jul_1m_resources/atmos_layers_med.gif. As you can see, what should be happening, according to the graph, has happened, at least since December 1978. And in 2007, the IPCC confirmed that “in accord with physical expectations”, the troposphere had apparently warmed faster than the surface. (http://www.ipcc.ch/publications_and_data/ar4/wg1/en/faq-3-1.html )
However, since 1996 there has been little stratospheric cooling (http://oi66.tinypic.com/24q372s.jpg ), since May 1997 there has been cooling in the lower troposphere according to UAH, and RSS (http://www.woodfortrees.org/plot/uah/from:1997.5/trend/offset:-0.4/detrend:0.178/plot/rss/from:1997.5/trend/offset:-0.45, there needs to be a detrend because WFT uses UAH 5.6 not 6.0) and, according to RSS, since November of 2000 as well (http://www.woodfortrees.org/plot/rss/from:2000.83/trend). In the middle troposphere, NOAA STAR TMT and RSS data indicate a flat trend since 1998 and cooling/flat trend since 2001, while UAH indicates slight warming trends since August of 1997 and 2002 (http://i65.tinypic.com/wksd9v.png ). This is significant, because, as NASA and the IPCC confirm, computer models and physical expectations predict that the troposphere should be warming faster than the surface. This is further confirmed by a 2004 article in Climate Research by Tom Chase, Roger Pielke Sr., Ben Herman, and X. Zeng (http://www.int-res.com/articles/cr2003/25/c025p185.pdf ) which states that “We find that it is extremely unlikely for near-surface air temperatures (surface temperatures) toincrease at the magnitude observed since 1979 without a larger warming in the mid-troposphere.Warming of the surface relative to the mid-troposphere was also more likely in control simulationsthan under anthropogenic forcing.” Perhaps our physical expectations or climate models need to change, though, to be fair, some radiosonde data do not match up too well with the RSS, UAH, and STAR (850, 500, and 250mb from here: http://www.giss.nasa.gov/research/news/20160120/noaa_nasa_global_analysis_2015.pdf ) analyses, though some (700 and 300mb) do.
These graphics you chose have cherry-picked start points, thanks!
Best,
D https://uploads.disquscdn.com/images/5f1cffbf424e239941dd4c5d023f9cc1d443e598e46702b0c5a9801927fbfa6d.jpg
https://uploads.disquscdn.com/images/8076f585874479175559508fdf7b00069f0a6bbaaccaf7f31f3ce58b60a091cc.jpg https://uploads.disquscdn.com/images/2430f065c18cb96675c02a922ee92b0d8ee4029c340f0880a9e88221a31c6816.png
Look, I have seen those graphs and I don’t care if you think that my start points are cherry-picked (how is 2001/2002 cherry-picked, anyway?) I acknowledged that over a longer period, what the models predicted, happened. But that doesn’t make the slowdown of warming (or cooling) unimportant. My point was to explain to you why the atmosphere’s inferred temperature is indeed important. Besides, those graphs actually do help to point out how those atmospheric datasets do match up relatively well (emphasis on relatively) with each other and not so well with the surface data sets.
Thanks! RSS data owner says surface data are better!
also
HTH
Best,
D
https://youtu.be/8BnkI5vqr_0
Yes, though it is kind of you to do the research and show me to those links to Dr. Mears’ opinion, that doesn’t really change reality. While I am not saying the satellite datasets are infallible or even necessarily the best, I think that they should definitely at least be considered, especially since they measure a critical portion of our climate system: the atmosphere. I do understand Dr. Mears’ point that there is significant uncertainty in the satellite datasets and this likely at least in part stems from the fact that, as you say, satellites don’t directly measure temperature. However, the surface datasets are not infallible, either. Here are two recent studies analyzing surface temperature data in two locations and then analyzing the effect of UHI on them and finding significant effects of UHI on the temperature. (http://onlinelibrary.wiley.com/doi/10.1002/asl.640/pdf, http://www.sciencedirect.com/science/article/pii/S0169809515000988 ) Anyway, I would recommend, to you, this article, which I believe does a good job at explaining this difference in satellite data sets (http://www.drroyspencer.com/2015/01/why-do-different-satellite-datasets-produce-different-global-temperature-trends/ ).
Thank you, UHI is already factored in. Has been for many years.
Best,
D
[Citation needed]
Listen, I didn’t say it wasn’t, ok? Set up your strawman somewhere else. I simply showed you how UHI has been shown, in those two studies, to not necessarily have been properly factored in in the original data.
The standard is Peterson 2003. Assessment of Urban Versus Rural In Situ Surface Temperatures in the Contiguous United States: No Difference Found. Journ. Clim. 16:18 pp 2941-2959.
thanks!
Best,
D
Thank you for linking to that paper. It has been highly cited and it makes sense that you would assert that it is the “standard”. Indeed, there are some papers that cite it that support arguments you would agree with, while some actually support my arguments (that paper about Greece I linked to cites it, as does this paper http://www.pnas.org/content/101/26/9540.full.pdf, which argues that “Our estimated warming of mean surface temperature of0.05°C per decade attributable to urbanization is much larger thanprevious estimates for other periods and locations.”)
However, we must look at the full literature, not simply one paper, as I am sure you would agree. I have given you three papers, here I shall give you some more:
http://www.nature.com/nature/journal/v423/n6939/full/nature01675.html, argues that “Our results suggest that half of the observed decrease in diurnal temperature range is due to urban and other land-use changes. Moreover, our estimate of 0.27 °C mean surface warming per century due to land-use changes is at least twice as high as previous estimates based on urbanization alone7, 8.”
http://www.planta.cn/forum/files_planta/2010jd015452_133.pdf, argues that “The trends of urban heat island (UHI) effects, determined using OMR and UMR approaches, are generally consistent and indicate that rapid urbanization has a significant influence on surface warming over east China. Overall, UHI effects contribute 24.2% to regional average warming trends.”
http://www.nature.com/nclimate/journal/v3/n5/full/nclimate1803.html argues that “The results show that the inclusion of energy use at 86 model grid points where it exceeds 0.4 W m−2 can lead to remote surface temperature changes by as much as 1 K
in mid- and high latitudes in winter and autumn over North America and
Eurasia. These regions correspond well to areas with large differences
in surface temperature trends between observations and global warming
simulations forced by all natural and anthropogenic forcings1. We conclude that energy consumption is probably a missing forcing for the additional winter warming trends in observations.”
and here is one more: http://www.sciencedirect.com/science/article/pii/S016980951500391, which argues “The observed warming in the urban city of Tehran has been more than
triple the rate of change in the global average temperature, indicating
that urbanization has had a significant warming effect.”
That’s great. I guess your ability to use Google Scholar is better than them scientist doing the work. You should contact them and let them know how to correct for UHI in the record.
Best,
D
Nowhere did I assert such a thing. My suggestion was to base our estimation of contribution by UHI to temperature trends not merely on one study. However, skeptics are not innocent of this either, as evidenced by the much hyped Monckton et al. 2015 paper in Science Bulletin, which I am sure you know about. I merely cite those papers, I don’t make claims that they are better than they are better than the one you linked to.
My point – again – this is well known. If you feel current scientists are making improper corrections for UHI, let them know.
Best,
D
Perhaps it is well known, but there are still studies which point to a significant influence of UHI on the climate of that area, (which you have not tried to rebut) and, if not properly factored in, which, like I said before, has been shown to be the case in some studies, could skew our estimates of global temperature. It would be interesting to see a global temperature data set that combines those studies I linked to with the rest of the world and see how it compares to our current surface temperature datasets.
Excuse me, I should have said “give indication that anthropogenic global warming is occurring.”
Satellites don’t measure temperature, BTW. Once this is understood and a cursory understanding of the gyrations that occur to get temperature, no one will fetishize sat temps.
Best,
D
The equation used is hardly a gyration, it seems relatively straight forward if you ask me. Granted there is some margin for error but if the math is done correctly and balloon data corroborates it, I fail to see your point. Sat data is just another tool used in the process. Ground based data is susceptible to error based on location, ie, heat island effect. One would conclude that using all 3 data sources is a prudent method for obtaining average global temperature.
The attack has begun. Asinine comments, paid shill.
Balloon data split from satellite temps, thanks!
Best,
D
more idiocy from the denier of facts and truth.
You lack talent and capacity to show that the statement is untrue.
Best,
D
All within .010 of a degree I believe, well within the margin of error.
well within the margin of error
[citation needed]
Best,
D https://uploads.disquscdn.com/images/d30e998f64823a474c3dd61c1a12dd174584a539741b0fa5f5652c4e358fdb4c.jpg https://uploads.disquscdn.com/images/bb5fe8e1ae09ebed97b46a3885f8f2f3e4e68677bc7c8fa69205b75c5d1becd0.png https://uploads.disquscdn.com/images/de95529ad877a4ac3c8d2426d3d4ecb88a7d1c6a1a8b39264eda79dd876812a0.jpg https://uploads.disquscdn.com/images/5f1cffbf424e239941dd4c5d023f9cc1d443e598e46702b0c5a9801927fbfa6d.jpg
Yes they do. Wikipedia is being less than truthful. Remote temperature measurements are common, both here on Earth, around our solar system, our galaxy and other visible objects that radiate in the electromagnetic spectrum.
Satellites measure radiance, which is equal to esT^4 – Stefan-Boltzmann’s law. Like all thermometers the satellite sensors have to be calibrated and the process is considerably more accurate than cherry-picking 50 out of 480 bristle cone pine trees to support an AGW hypothesis. The “e” in the equation is emissivity of a grey body, which is what Earth is. If we couldn’t use radiance measurements we wouldn’t know what the temperature of the Sun and other starts, asteroids, comets, Mars and other planets are.
I measure temperatures around my house with a hand held, battery powered Infrared thermometer gun. It measures temperatures from -50C to 500C with an accuracy of +-2C, a resolution of 0.05C and repeatability of +-1C. The Distance:Spot ration is 12:1, so the farther away the object is the greater the area and the measured temp represents an average of the reflectance angle.
Satellite temperature measurements is settled science and has been in use since satellites first went into orbit
IF I wanted a better device with a larger temperature range with more accuracy, resolution and repeatability I could have purchased one for more than the $50 I paid for the one I have.
BTW, with your logic I could say that mercury thermometers do not measure temperature. Would you accept that? That kind of thermometer measures the expansion of a trapped volume of Mercury, and the amount of expansion is calibrated between the phase changes of pure water and that space is divided into 100 parts, hence “Centigrade”. Other similar thermometers used dyed fluids. Still other thermometers measure the leakage of electrons across solid state boundary layers in ordinary transistors or even squibs made from Josephson Junctions. And it goes on and on. ALL of them can be calibrated to measure temperature. Temperature is, after all, nothing more than the measure of the kinetic energy (velocity) of atoms, and is a property of all matter. That’s why substances with no motion what so ever are deemed to be at absolute zero, 0K.
Satellites don’t measure temperature, thanks! The satellites are microwave sounders. And they use a model to derive temps.
Best,
D
there is no “model” used. This is yet another baseless assertion that will no doubt take on a life of its own. As GreyGeek77 says, radiation is used to measure temperature all the time, including by your doctor. In contrast, most thermometers now use electrical resistance…how is that any more direct?
How do do get from microwave emissions and microwave and adsorption from near-surface to sat receiver to temps, then? Do you wing it? Adjust something? Manipulate a little somethin’somethin’?
Best,
D
More spew from the climate change sucker and useful idiot.
Some use microwaves and some measure infrared. BOTH are radiance measurements which follow the same Stephan-Boltzmann law. The “model” you refer to is the calibration method. All measurement devices require calibration, including Mercury thermometers or measurements of entrapped gases or radioactive elements in ice core samples. The AGW hypothesis is a collection of non-linear mathematical models but instead of calibrating the models with valid data the AGW folks are busy modifying historical data so that it fits their math models.
BTW, Dr Ed Lorenz, in a 2007 interview before his death:
http://journals.ametsoc.org/doi/pdf/10.1175/BAMS-D-13-00096.1
“The interview has provided insights into how Lorenz stumbled onto his seminal work. He inherited a project that required he learn statistics, which led him to statistical weather forecasting, while his foundation in mathematics led him to question current thinking. He was able to prove his theory that linear statistical methods could not duplicate what a system generating nonlinear solutions could achieve. While his first numerical integrations were conducted using a 12-variable model, his landmark 1963 paper (Lorenz 1963) only used a 3-variable model, and in this interview, Lorenz gives us his path to choosing the simpler model. Lorenz also believed that improved initial conditions and data assimilation methods have led to the skill we see today in NWP, and [b] he was hopeful that good forecasts out to two weeks are possible.[/b]”
So, ten years ago, the father of accurate computer models of the weather has “hopeful” that good forecasts out to TWO WEEKS were possible. This was well after the Kyoto Accord and the Hockey Stick. AGW folks spin that by claiming that climate and weather are “different”, as if a model of the Earth can be accurate to 50 years but a weather forecast for the East coast can’t extend to two weeks.
Some use microwaves and some measure infrared.
Just microwaves, thanks! (AMSU)
And this is good comedy! The AGW hypothesis is a collection of non-linear mathematical models but instead of calibrating the models with valid data the AGW folks are busy modifying historical data so that it fits their math models.
I LOLzed!
Best,
D
MOre spew from the brained wash idiot. Who sits in a corner “lol’ing” to himself as he plays.
Facebook Lol AI.
Don’t be shy Gavin just spew it out, You so superior. lol
So Dano; You are one of the suckers slurped in by the lies and bullshyte of the IPCC and the greedy politicians and FAUX climate clerks who are looking for a bigger grant and cant get it UNLESS they Lie about the temperature increasing (Among other stupid acts).
You can’t show a single byte of what I typed is untrue.
Best,
D
You are unable to show it to be true either!
Already did. You are pre-bunked.
Best,
D
00000000 all zero’s that’s you.
fascinating. I get it: thermometers don’t measure temperature either. In fact, they measure expansion of a liquid which has been correlated via models…er something like that.
I validate your comment D.
Best
Satellites don’t measure temperature. Can you grasp it?
Best,
D
As has been repeatedly explained, all measurements of temperature measure the direct effect temperature has on what is being measured. The translation of what is measured to a temperature reading is CALIBRATED against known states, e.g. the melting and boiling points of pure water. If you don’t accept satellite measurements then you equally cannot accept thermometer (of whatever type) measurements. You therefore cannot accept the NOAA/GISS data sets, whether adjusted or not, so you therefore have no basis whatsoever to claim that man’s CO2 is causing temperature rises as you can’t say the temperature is rising.
The logical fallacy of your blind belief is simply staggering.
The spectacle of flawed logic aside, clearly you don’t understand what satellites do. The people who run them do and understand the issues.
Best,
D
Yes, the people who “run” the satellites do understand them. Yet, here you are posting absurd comments and even arguing with the guy who heads the satellite program that measures atmospheric temperatures, Dr Roy Spencer, whom you disrespect by referring to him in Informal terms. You obviously lack good manners and a formal education in the sciences, which is why SJW’s usually major in gender studies or poly Sci.
If the AGW scam succeeds and our fossil fuel production is halted trying to stop CO2 rise you will be among the millions who starve to death for lack of food or freeze to death for lack of fuel, all to “save” a planet that is not in danger. Of course, you don’t believe that will happen, and neither do I. The real purpose of AGW is to Socialze the democracies and convert them to communist countries. That’s probably what you really want, believing that there is such a thing as a free lunch if the gov gives it to you. It’s the blind faith that drives all SJWs.
Ululating hyperbole aside, you can’t hide the fact you cannot grasp the basics of satellite data.
Simply more spectacle to hide numerous false statements. Unsuccessfully.
Best,
D
The flawed logic is yours, not just because you blindly deny everything that doesn’t agree with you, but now you contradict yourself by saying the satellite folks DO understand.
It’s a straight choice for us, believe you, who thinks he knows everything better than pretty much anyone else, or believe the author and his colleagues who are recognised as the experts in satellite based atmospheric temperature sensing. It’s not a hard choice as I’m sure you’ll understand. Note: the author doesn’t argue from ‘authority’, a bad trait in any discipline and can never command respect, but from ‘expertise’ built over many years of open scientific study and discourse.
Time, dear D, to remain silent and listen, and for once learn something, as every statement you’ve made here and on all the other articles you’ve commented on, the deeper the hole you dig.
You can’t hide the fact that commenter does not understand the satellites that measure atmospheric (not surface) temperature.
Best,
D
also
HTH
Best,
D
https://youtu.be/bvdeDwAjiOI
“My data set”? Time to come clean.
Who are you?
Do you work in the field of atmospheric temperature measurement?
If not, in what field do you work?
What is your expertise (if relevant, if any)?
Are you published, and if so, in which journal(s), and where are your papers, calculations and data to be found?
Basically, what are your credentials to reject Dr Roy Spencer’s work so emphatically as you do?
Note: Just answer the questions for once. No questions in reply. No ad homs or insults. No ‘denials’. No attempts at humour. No anything. Just answers.
Are you aware of the concept of quoting someone? Do you know how it is done?
Do you know what a hyperlink is and what happens when you click on a hyperlink?
Do you know how to start an embedded video?
My, my. Interesting unintended entertainment today!
Best,
D
Answer the questions. Nothing else.
Or, as John Major once succinctly expressed it: “Put up, or shut up”.
Your questions are irrelevant, as you are addressing the wrong person for these questions. That is: these are not my words. I quoted someone. Can you understand that?
Can you grasp your basic error? Or is this Internet Performance Art?
Best,
D
No, I’m addressing you, who is denying every fact presented, with direct questions. Please answer them. You demand proof, so you provide porof you are qualified to treat everyone else here, including Dr Spencer, with contemptuous derision, whether it’s with your own words or someone else’s.
I’ll type slowly for you, as you need it.
I typed as slowly as I could and used small words. I hope it was sufficient.
Best,
D
Mears basically says the models didn’t predict what actually happened on a multitude of levels. Therefore the models are wrong! That’s the obvious and only conclusion.
You made that up. He doesn’t say that at all:
I think you tell big fibs to get attention.
Best,
D
Climate scientists measure gullibility. Got it.
Is that you GS ;)
“Fetishize” An interesting choice of words. It implies that anyone supporting the use of satellite data is mentally ill. Like the use of “denier,” it’s a convenient way to dismiss your opponent rather than engage in an intelligent debate.
It implies that anyone supporting the use of satellite data is mentally ill.
You made that up.
Can you grasp that satellites don’t measure temperature? Can you grasp that purposely omitting data where people, plants and animals are found is dishonest?
Best,
D
This is going to read like a nutty conspiracy theory but there is ample evidence in the literature. As a starter read, “Global Warming: The Facts” a collection of essays edited by Alan Moran. “Global Warming” is the brainchild of self-described “worlds greatest environmentalist” Canadian Maurice Strong. Strong believes that there are too many humans on the planet, that human activity, particularly in the industrialized nations, threatens the survival of the planet and that there is a moral obligation to curtail such activity. He’s not alone. John Holdren agrees and wants to de-develop the US economy. Strong was instrumental in establishing the UN IPCC (International Panel on Climate Change). IPCC is the leading funding and propaganda agent for GW alarmism. GW/CC/CD is the greatest fraud ever perpetrated in the name of science. Billions of dollars and the quality of life for millions, especially those living in undeveloped and developing nations, are at stake.
No conspiracy there. I started with “Man made CO2 drives Climate! WTF, Who said?, IPCC UN funded Nazi front! JHC!, 911 Nist Nazi science, OMG!, the rest is history, Kill millions, Growing the Heroin, Steal the Gold, Destroy opposition, Destroy Dollar, War on I$I$ run by US. The latest attempt to remove Satellite, Balloon, Buoy temp records from science will be relentless mindless and vicious. Watch.
Those who have read all the documents in the FOIA 2009 CRU zip file have read the Word docs which are contracts between the folks at the CRU and the IPCC in which the CRU agrees to deliver proofs of AGW at timely “milestones” (their word) in exchange for monetary payments. When I was in grad school the objective of research was to test hypotheses in attempts to prove them wrong. A thousand positive experiments can’t prove an hypothesis right but it takes only one to prove it wrong. One ASSUMES an hypothesis is right (otherwise why bother testing it?) and from an operational definition designs an experiment to prove the hypothesis wrong. NO person can claim to deliver proof of any assertion prior to collecting real data. Only a charleton would take money and guarantee proof of a claim before the data is collected. This explains why the AGW crowd is so willing to trim, cook and create data out of thin air.
Over the last two decades many claims and predictions of AGW have been made, often contradictory. Too much rain- AGW. Too little rain – AGW. Too hot or too cold -AGW. Increases and decreases in tornadoes and hurricanes, too much or too little snow, every occurrence of a weather event is attributed to AGW, making it unfalsifiable. Any theory which cannot be falsified is not a theory which science can test. Predictions made ten years ago that the ice at the North Pole would be totally melted by today are false. The mean global temperature predicted two decades ago for this time period was never reached. The planet has not warmed at all and may have cooled a bit. When scientific theories make predictions which aren’t even close to actual facts the theory is usually modified to fit the facts, not the other way around, or it is discarded.
Only a charleton would go back to historical data, some hundreds of years old, and modify it to fit their hypothesis. In the late 1970’s there was a NOVA episode titled “Do scientists cheat?” The conclusion, by two of the scientists who helped make the episode and who studied a range of doctoral and research publications, was that about 48% of them do. Today, in climate science, that percentage is much higher, but the greed is the same. It’s all about the money … Carbon Credits money. Grant money. Payments transfer money to “green” energy companies run by friends of Barak and all going bankrupt shortly there after, taking the money with them. Most of it is going to the worst polluters on the planet: the tyrannical governments ruled by Marxist dictators, through Al Gore’s Carbon Credit accounts. Anyone notice the smog level in Bejing?
Climategate! Drink!
And you made this up: Only a charleton would go back to historical data, some hundreds of years old, and modify it to fit their hypothesis.
You have zero evidence to back this blatant falsehood.
Best,
D
You wish!
Compare this:
ftp://ftp.ncdc.noaa.gov/pub/data/ushcn/v2.5/ushcn.tavg.latest.raw.tar.gz
To the data after adjustment.
I didn’t send this to a PC that has the utility to read this file, but just reading the title, this is the USHCN, not the Keeling curve.
In addition, these comical statements are blatantly false and you can’t support them with actual, reality-base evidence:
o The AGW crowd has spent several years “adjusting” data to fit their theory.
o the AGW crowd efforts to erase the Maunder Minimum
o he AGW crowd efforts to erase …the first millennium warming spell,
o CO2 is not a pollutant
I’ll take the points on offer while I’m at it too:
o CO2 means more plants/food/is good/is life [10 points]
o CO2 much higher in past [10 points]
https://www.facebook.com/ClimateDenialistTalkingPointGame
Best,
D
The two NOAA gov web sites I referred you to call them Keeling. If you disagree take it up with them. And you respond with a Facebook citation? LOL! Indeed, you are a troll
Thanks! your inability to support your blatantly false statements with actual, reality-based evidence:is noted.
Best,
D
Since it is obvious that you are inclined toward confusing science and politics I thought you might enjoy reading this article:
http://www.forbes.com/sites/warrenmeyer/2014/02/26/the-thought-experiment-that-first-made-me-a-climate-skeptic/#396f87436848
That’s not supporting your blatant falsehoods either.
Best,
D
And you read the whole article in three minutes. LOL.
You obviously don’t know what a blatant falsehood is or you would not have swallowed the idea that scientific truth is determined by a majority vote and sustained by political pressure. To see the end result of science by politics consult Wikipedia for “Lysenkoism”
That’s not supporting them either.
Best,
D
Your replies are obvious non sequiturs arising from not having read any of the proofs YOU requested. Probably because you have no training in science and can’t understand them.
You are just a troll.
You didn’t provide proofs. Proofs would be scholarly journal papers that quantify how them thar scientist spent several years “adjusting” data to fit their theory, including a quantification of ideologically pure, free merkit data. Proofs would be scholarly journal papers that quantify how them thar AGW crowd did somethingsomething to erase the Maunder Minimum, and an example of such erasure, including current or recent papers. Proofs would be scholarly journal papers that quantify how them thar AGW crowd efforts to erase the first millennium warming spell, including actual evidence. Proofs would be scholarly journal papers that show evidence of how them thar CO2 is not a pollutant.
But you can’t show these things. So you link to an op-ed then whine and pout when someone points out an op-ed doesn’t show.
That is: you can’t show any evidence for the italicized statements.
Best,
D
Citing data from NOAA websites isn’t proof?
ROF,LLLLLLLLL
You just continue setting there with your eyes closed and your fingers in your ears while TYPING “Na na Na Na Na” over and over. That’s what trolls do.
You’ve gotten tiresome, troll.
You can’t hide your complete and utter inability to back your claims. Everyone can see it.
Best,
D
ROF,LLLLL
You’re funny! You should take your act on the road … Oh, wait … You are!
Thanks LOLO, we know you can’t back your false statements. I’d flap my hands too if I needed to hide my blatantly false claims. Good call trying to hide your falsehoods!
Best,
D
Danno, all that Colorado pot is affecting your brain cells, you should lay off of it. BTW, has it cleared up your acne? When are you going to start shaving? Go back to reposting other people’s audio mixes on YouTube. That, too, takes no talent or education.
https://m.soundcloud.com/dano2-1
That isn’t hiding all your false statements either.
Best,
D
Quoting a lie is a truth.
That’s not hiding it either.
Best,
D
Dano2, are you aware of the emails hacked from the CRU at East Anglia University? They are readily available. Can you explain why CRU refused to provide access to its raw data or the computer code of its models? Can you explain why the IPCC issued it guide to political decision makers before receiving technical report? Can you cite one (just one!) forecasting model that has been independently validated? Can you explain the Medieval Warming?
I’ll first take the points on offer:
o Climategate showed X [20 points]
https://www.facebook.com/ClimateDenialistTalkingPointGame
Then I’ll have some fun at denier’s expense for my entertainment:
Here is the performance through 2015. Tell everyone what you think.
Here’s how the models were doing.
A different look at latest run.
An interesting depiction of latest run.
Here’s how some older models are doing.
And some older ones.
And some older ones.
And some older ones.
And some older ones all together.
And what several scientist said in the 1980s that was surprisingly accurate about Arab Spring.
Here is the the very first climate projection from 1981, constructed from this paper. Pretty dang good, no? Not what the disinfo sites tell you, is it?
Here is something from the 1970s that is surprisingly accurate as well.
Here is an early prediction from an early pioneer of climate science, from 1975, 50 years ago. Pretty darn good. (source, and original paper)
Heck, even Exxon scientists were pretty durn close in the early 1980s!
This is where we are now.
============================================
For those not chart-driven:
Global Climate Models have successfully predicted:
That the troposphere would warm and the stratosphere would cool.
That nighttime temperatures would increase more than daytime temperatures.
That winter temperatures would increase more than summer temperatures.
Polar amplification (greater temperature increase as you move toward the poles).
That the Arctic would warm faster than the Antarctic.
The magnitude (0.3 K) and duration (two years) of the cooling from the Mt. Pinatubo eruption.
They made a retrodiction for Last Glacial Maximum sea surface temperatures which was inconsistent with the paleo evidence, and better paleo evidence showed the models were right.
They predicted a trend significantly different and differently signed from UAH satellite temperatures, and then a bug was found in the satellite data.
The amount of water vapor feedback due to ENSO.
The response of southern ocean winds to the ozone hole.
The expansion of the Hadley cells.
The poleward movement of storm tracks.
The rising of the tropopause and the effective radiating altitude.
The clear sky super greenhouse effect from increased water vapor in the tropics.
The near constancy of relative humidity on global average.
That coastal upwelling of ocean water would increase.
References**
o Nights warm more than days
Arrhenius 1896
Dai et al. 1999
Sherwood et al. 2005
o Polar amplification
Arrhenius 1896
Manabe and Stouffer 1980
Polyakov et al. 2001
Holland and Bitz 2003
o Pinatubo effects
Hansen et al. 1992
Hansen et al. 1996
Soden et al. 2002
o Temperature trend versus UAH results
Christy et al. 2003
Santer et al. 2003
Mears and Wentz 2005
Santer et al. 2005
Sherwood et al. 2005
o Ozone hole effect on southern ocean winds
Fyfe et al. 1999
Kushner et al. 2001
Sexton 2001
Thompson and Solomon 2002
o Storm tracks move poleward
Trenberth and Stepaniak 2003
Yin 2005
o Tropical “super greenhouse effect”
Vonder Haar 1986
Lubin 1994
** Full citation list found here (plus much, much more).
============================================
Just say derp!
Best,
D
So your dead and we are alive.
That isn’t a proof either. Clearly you are unclear on the concept.
Best,
D
Ah, the ‘provide porof’ fallacy! If you need ‘papers’ for things that are blatantly obvious, then you’re a bigger fooll than we thought. On the other hand, we know you’re an utter fool without needing any ‘scholarly’ papers to prove it. Provide some ‘scholarly’ papers to prove you aren’t.
the ‘provide porof’ fallacy
Hoot! I LOLzed!
Best,
D
Climate-gate where those “climate scientists” collude to fix the data and show their true colors for deception and dishonesty. got it.
Climate-gate where skeptics dine out.;) Drink!
Excellent post. But the “true believers” (see below) just won’t be convinced, no matter what evidence is cited.
Sad but true.
The AGW scam is a Marxist scheme hatched at the UN and supported by Leftists in academia (especially with the flood of gov grant money), Hollywood, the media and Government. It’s key “solution” is to transfer wealth from the free democracies to Marxist dictatorships around the world, but mostly Communist China. That was “the cause” the Greenpeace delegate and the CRU climatologist discussed in one of the FOIA 2009 zip file. Information in the 2011 zip file is even more damning. I should post some of them.
I’m still waiting for my money from the Koch brothers for saying water is wet, is clouds, is rain, is snow and floats on water when frozen and its not controlled by CO2.
The problem with what is causing earth to warm fails to take into account what is supplying the heat!!! Its is the sun!!! and what humans do on earth is very insignificance. Until we understand the long term sun cycles and how they effect the earth its not worth my time to worry about temp. because we are not going to stop what the sun is going to do!!! The sun will burn the earth to crisp and there is nothing that we can do to stop it!!
Your talking about the 2nd Law of thermodynamics and common sense.
In the ugly politics of Man drives climate even Einstein is a denier.
https://www.theguardian.com/science/2013/dec/01/what-is-the-second-law-of-thermodynamics
I’ll take those points on offer:
o Greenhouse effect violates thermodynamics (add 5 points for ‘demonstrating’ that it doesn’t work like a real greenhouse) [40points]
https://www.facebook.com/ClimateDenialistTalkingPointGame
Best,
D
You sound very arrogant.
“You sound very arrogant.”
You could have spelled it “ignorant”
Radiant heat transport does not violate the 2nd law of thermodynamics. The IR photons radiated from the earth are hotter than the molecules of CO2 in the atmosphere that absorb them. Even if they weren’t, the interactions are probabilistic, and some reactions would occur. Then, in aggregate, the absorbed photons are re-radiated in all directions after absorbtion by the CO2 molecules. Some of the re-radiated photons go back to earth. In balance, there is less IR going out to space than would occur without the absorption of IR photons by CO2. This is less cooling of the earth, not direct warming from the cooler atmosphere. Less cooling of the earth has the same end result as net heating of the earth.
Einstein died April 18, 1955. Long before it became front and center.
what is causing earth to warm …Its is the sun!!!
That’s weird…solar irradiance is down, yet temps are up. How strange that you are going with that for a comment.
Best,
D
Its strange you claim the irradiance is down ? How did you measure that, since you claim those methods are false? all methods of recording anything must be calibrated, nothing is measuring temperature, but its measure a change which is calibrated to number. therefore all numbers if calibrated to the common starting point will be the same.
How did you measure that
Why would you claim I did?
you claim those methods are false
I have made no such claim.
But maybe you are trying to argue solar irradiance is not down. If so, show your work.
Best,
D https://uploads.disquscdn.com/images/78cce9de7716be7bad0df884d2843bc1c0bd136dd355d23323e5a543ef73a118.jpg https://uploads.disquscdn.com/images/155b088afb76663af98094a38c75308619a316980ce9ba01e2f9a21ad914bad9.png
Solar irradiance IS down. You’re absolutely correct. But so is the sun’s magnetic field. And thus Earth’s protection against cosmic rays. And thus an increase in cloud formation. Which results in lower global temperatures. You’ve nailed it.
Too bad the temps are at record highs, else your comment would be….erm…germane, cogent and accurate.
Best,
D
To bad those numbers are fraudulent.
You lack capacity to show fraudulent.
Best,
D
But you do not.
You cannot back your claim of those numbers are fraudulent. We get it.
Best,
D
No again, we don’t get it only you do. Simpleton
Only the politically manipulated surface temperature data sets are showing an increase in temperature. The satellites and the balloons show no cooling for almost two decades.
You can’t show politically manipulated surface temperature data sets . You have zero evidence for that statement. Nothing. Zip. Zilch. Nada. Nil. Null set. Squat. Jack. Bupkis.
Best,
D
A smokescreen of silly words cannot hide the futility of your argument. You know that the data sets have been adjusted to support the dream of warmism but you cannot bring yourself to admit it. You’re in denial.
The planet cools and it’s driving warmists crazy. It’s a great time to be a skeptic.
You can’t hide your utter inability to back your false statement with another false statement. Jus’ sayin’.
Best,
D
Your comment technique is amusing but you cannot prevail by being vacant.
Why do the satellite and balloon data sets show a pause in global warming?
Why do the satellite and balloon data sets show a pause in global warming?
They don’t.
Nonetheless, even Roy is stating that 2016 will show record year in the lower troposphere, so who knows what the denialists will whine about in 2017. But we know Breitbart will tell them something to whine about, surely.
Best,
D
Actually they do. Any warmth in the lower troposphere would be caused by the recent El Nino and has nothing to do with atmospheric carbon dioxide.
Looks like you’re the one in denial.
You made this up and cannot back the claim: Actually they do. Any warmth in the lower troposphere would be caused by the recent El Nino
Ouchie. Nothing but made-up stuff.
Best,
D
You don’t appear to understand what an El Nino is so I’m not surprised that that you struggle with facts.
I don’t think I’ve ever discussed global warming with anyone so contemptibly stupid. You should get a trophy and a star pasted on your forehead.
You can’t back the claim about satellite and warmin paws. We get it.
Best,
D
Nonsense, you are the only one who “Got It”. Not we.
This is what “global warming” relies on… people who will deny any evidence that does not fit their preconceived viewpoint and who refuse to do any research or fact-checking on their own.
What is the current rate of absolute global sea level rise?
IIRC 3.3 or 3.4 mm/yr.
Such questions won’t hide your inability to back your transparently false statements either. They are there for all to see.
Best,
D
You’re wrong but that seems to be something of trend with your comments. NOAA has published a rate of absolute global sea level rise of 1.7 to 1.9 mm/yr. Not very alarming.
You’re wrong
What about the global measurements, not just tide gauges?
Your ignorance only magnifies your transparent attempts to hide your false statements. You can’t hide your false statements. Your false statements are there for all to see.
Best,
D
Nobody said anything about tide gauges. If you could read through the haze of your spittle, you would understand that NOAA’s reference was to absolute global sea level rise.
Smart people know the figger you gave was for tide gauges. Satellite measurements – across the entire planet – are almost twice your figger.
Can you speak to this issue, or are you going to flap your tiny hands and ululate about another false statement you made?
Best,
D
How many climate models have correctly predicted that Antarctica would be gaining ice/snow mass in 2016?
Antarctic ice sheets not gaining mass aside,
That won’t hide your false statements either.
Best,
D
Might want to check with NASA – they say that Antarctic is gaining ice/snow mass.
Not today they don’t. You may want to check with NASA, cuz your ignorance isn’t hiding your false statements either. In fact, your false statements magnify your other false statements upthread.
best,
D
So you’re saying that today NASA has published a study that refutes their earlier study. You’re all over the map, boy.
I’m implying you are ignorant of current Antarctic ice sheet mass loss.
Best,
D
“So you’re saying that today NASA has published a study that refutes their earlier study”
He may be right about that. Past temperature data has been adjusted downward in some cases to make it seem the earth has warmed more. Perhaps they ran the computer algorithms in reverse?.
https://www.nasa.gov/feature/goddard/nasa-study-mass-gains-of-antarctic-ice-sheet-greater-than-losses
Why do you keep denying eveything?
Today. I typed today.
Best,
D
Probably the only truth you ever posted on Climate! Congratulations.
Is it true that D. David Viner, a senior research scientist at the climatic research unit (CRU) of the University of East Anglia stated in 2000 that “Within a few years winter snowfall will become “a very rare and exciting event”. “Children just aren’t going to know what snow is”? Did he actually say that?
Me loves me some Viner! Me loves me some denialists duped by the made up Viner quote!
I LOLz every time I see it! hoot!
Best,
D
So now you’re resorting to unapologetic density. Why not just answer the question? Is it because you have no answer that does not involve poor grammar and a lame attempt at humour?
Made up Viner quote used by hapless denialists make me laff every time!
Hoot!
Best,
D
Surely there was a Medieval Warm Period that affected the entire globe? Before any increase in atmospheric carbon dioxide?
That’s not hiding your transparently false statements either.
Best,
D
Why deflect? Just answer the question.
That deflection won’t hide them either.
Best,
D
That’s all this clown ever does. Deflect to cover his lack of any valid explanation..
There is no evidence that the MWP was global in the sense of being at the same time. There were a number of warming events around the world that did not coincide.
“Proxy records show peak warmth occurred at different times for different regions, indicating that the Medieval Warm Period was not a time of globally uniform change. Temperatures in some regions matched or exceeded recent temperatures in these regions, but globally the Medieval Warm Period was cooler than recent global temperatures. Temperatures were probably between 0.1 °C and 0.2 °C below the 1961 to 1990 mean and significantly below the level shown by instrumental data after 1980.
Possible causes of the Medieval Warm Period include increased solar activity, decreased volcanic activity, and changes to ocean circulation.”
From Wiki ( but hey those damn scamming climate scientists just made that up eh?)
Also UAH/RSS are deviating from their validating RS data since around 2000.
(and here too)
https://tamino.files.wordpress.com/2015/12/compare_all.jpeg
https://tamino.files.wordpress.com/2015/12/diff.jpeg
The William Connelley scandal completely destroyed any credibility that Wikipedia had as a climate science source. Nobody takes it seriously anymore.
Suggest that you check out this link for global impact of the MWP:
http://notrickszone.com/2015/12/23/new-comprehensive-map-by-scientists-confirms-medieval-warm-period-was-real-and-global-climate-models-faulty/
I most certainly do not accept notricks as an unbiased source of science (does not the name imply ?)
So I’ll see you with this ….
https://www.skepticalscience.com/medieval-warm-period-intermediate.htm
Which you will not accept either.
But it does rely on peer-reviewed science.
Oh, and ask Spencer and Mears why their surface (TLT – which isn’t) Sat data is deviating from the RS’s.
At least Mears accepts that the Thermo record is more reliable. Which is only obvious unless you think homogenisation is dishonest.
The problem is that you dismiss the website instead of the study. And that speaks volumes.
Pal-reviewed science is not peer-reviewed science. In any case, most warming enthusiasts do not understand the peer-review process and it is clear that this is your problem as well
The surface temperature data sets have been manipulated to produce a predetermined outcome. The satellite and radiosonde temperature data sets are uncorrupted. The Earth has not warmed for nearly two decades and will cool in the coming years. I think we can agree that the effects of atmospheric carbon dioxide are negligible and lost in the noise of natural variation.
Your belief in CAGW is misplaced and unsupported by credible science.
Milo:
“The problem is that you dismiss the website instead of the study. And that speaks volumes.”
No, that you need to go there to get your “science” speaks volumes”
I do not find in your “article” – as the wiki article says there wasn’t – much coincidence of anomalies around the globe – we know they happened – but cannot be linked as coincident.
If the globe warmed – it can only have come from the sun. It may have done as we don’t know (exactly) what it
was doing back then, and also of ocean circulation/PDO/ENSO/AMO. We have a little idea of volcanism but suspect it was low.
And no – the sun has been slowly but surely weaking it’s TSI for ~50 years – so it’s not the Sun now.
Where is the energy coming from now is the question?
Do you want to invoke Cosmic rays?
Plus: We have comprehensive temperature data for the MWP do we?? writings in monk’s diaries don’t count. Now “certain” “sceptics” are hypocritical when when they say there is proxy evidence for a MWP warmth/LIA cold beyond what is naturally explainable and then turn around and go rubbish the “hokey schtik”.
“Pal-reviewed science is not peer-reviewed science.” you say, but that article in notricks references other “peer-
reviewed science” to come up with the ideologically motivated headline even though we know those events
happened but appear to be unconnected. Peer-review is fine when you agree with the science that’s peer-reviewed, eh?
How is it you lot can hold 2 or several mutually exclusive ideas in your head and make a rational whole?
All science is done this way. Only experts in the field are capable of giving a credible review. What do you
suppose we do instead? drag peeps in off the street and tell em to read a paper!
An example of notricks science …..
“In summary: The ground surface is heated only by solar shortwave radiation. This heats the ground, which then
radiates long wave IR back into the atmosphere. At the wavelengths where CO2 and water vapor are opaque, this
IR is absorbed and heats the atmosphere. If CO2 increases, only the height at which this happens changes. This height is very close to the surface, on the order of 1 meter or less. Back radiation only happens if the air
is warmer than the ground. At elevations above 1 meter, the atmosphere is in LTE and increased CO2 does
nothing. At the TOA, increased CO2 can radiate to space, cooling the TOA.”
Spot the bollocks (“Back radiation only happens if the air is warmer than the ground.”) – In other words essentially a denial of empirical science – sorry my friend I’m having no truck with that and neither should any reputable “science” commentary.
“In any case, most warming enthusiasts do not understand the peer-review process and it is clear that this is your problem as well.”
That cannot be in anyway clear to you, as I have said nothing about that until now. The only thing that matters is that things proceed by science building on past discoveries. If the “discovery” were based on a lie then it wouldn’t fly and the “Emperors’s naked” shouting scientist would duly be awarded his Nobel.
“The surface temperature data sets have been manipulated to produce a predetermined outcome. The satellite and radiosonde temperature data sets are uncorrupted.”
Err, no – I’ve just shown you evidence that they diverge from around ~2000, which is when the new AMSU came on
line (noaa15). Radiosonde data shows that the atmosphere is warming as predicted. The Sat data is out of line.
“The Earth has not warmed for nearly two decades” selective reasoning my friend – the US is not a planet so
even if homogenisation were not perfectly correct and transparently reasoned it’s beyond bizarre for anyone to
imply that invalidates multiple, global data-sets and to invoke the “conspiracy” card. That says far more about
you than anything I can say.
“It will cool in the coming years.” How so? – the coming grand minima? – that has only in the past reduced TSI
~0.1% or around 1.5W/m^2 at TOA.
“I think we can agree that the effects of atmospheric carbon dioxide are negligible and lost in the noise of
natural variation.” We most certainly cant agree and empirical and observational(see just below) science “cannot” agree. CO2 has gone from 280 > 400ppm, a 40% anthro induced rise, increasing forcing by ~2W/m^2 (at the surface).
http://phys.org/news/2015-02-carbon-dioxide-greenhouse-effect.html
“Your belief in CAGW is misplaced and unsupported by credible science”….. turning logic upside down to fit your world-view does not make it so my friend, and your comments he are just the same deluded myths and hand-waving that I have encountered for several years now.
I know full well that you cannot change – it is a view founded on a ideological dislike of what the world’s
experts (in multiple earth sciences) are saying. But to you “it’s not credible” or it’s been “manipulated”.
Yes, I suggest you go and argue with Mr CarrolL down the rabbit-hole – cos I’m no longer. I intend to keep my sanity.
I’m sure you’ll reply (fits the MO) but I’ll not read.
TaTa
Logorrhea is no substitute for substance. And if your grammar and spelling are any indication of education, then I’m conversing with a cretin.
The Earth cools and it’s driving guys like you crazy. It’s a great time to be skeptical.
RATPAC isn’t really a radiosonde data set but a reconstruction of the 3 radiosonde data sets, homogenized, and adjusted to crap. Notice how RATPAC closely matches that satellite data for it development phase but once it goes live starts to diverge. That can only mean one thing. NOAA had their thumb on the scale during the verification phase of the RATPAC reconstruction. Once it goes live imediate divergence despite no significant changes to the satellites. Why? Because RATPAC was rigged to show warming.
Corse it is!
Infamy, infamy – they’ve all got it infamy……
https://www.youtube.com/watch?v=kvs4bOMv5Xw
https://www.ncdc.noaa.gov/data-access/weather-balloon/radiosonde-atmospheric-temperature-products-accessing-climate/ratpac-b
That is not a response moron. The sudden divergence of RATPAC form the 3 radiosonde data sets and the two satellites after RATPAC went live does not mean the weather balloon data sets and satellites are wrong. It means RATPAC is wrong. NOAA obviously had their thumb on the scale when RATPAC was being verified.
Infamy, infamy and calling people morons – like I said to the other denier…..
Says more of you than anything I can say.
Stop putting your head out of the rabbit-hole – we don’t think an argument is won by ad hominem and bizarre conspiracy theory here my friend.
Ta ta
Yes it says that your are an emotionally infantile millennial who needs a safe space. There is not safe space in life. You rae a moron because your make moronic comments. Unable to actually address the issue of RATPAC’s divergence you resort to posting a stupid video. That makes you a moron not a perfect snowflake.
If the lack of warming (the hiatus) isn’t happening, why are there more than 50 attempts by AGW advocates to try and explain it away, especially as the ‘science is (supposedly) settled’?
Aside from the fact there are a half-dozen papers explaining your error, You can’t show a dataset where there is a statistically valid paws.
Best,
D
“statistically valid paws.”
It is spelled P A U S E Dano. I know you are scientifically challenged. I thought you could spell.
.. https://uploads.disquscdn.com/images/aad66faf7d58a0bf7b4a5dcd8c60e29ea174e19552179c9f0b80d8715e8f30ab.jpg
The AQUA satellite has show no warming in the lower troposphere since it’s launch in 2002.
https://ghrc.nsstc.nasa.gov/amsutemps/amsutemps.pl
Thanks for telling us about noise.
Best,
D
It would seem, if any data can be manipulated, it would be thermometers, on the ground.
As Roy Spencer said, they aren’t everywhere; so estimates are made, to fill the gaps.
Scientists, and political figures, supporting Climate Change theory, have made a living off the Warming Scare.
Perhaps man has some, small impact; but, insignificant, when compared to Nature’s.
Personally, I’m not willing to let my Freedom, or my money, be seized by left-wingers, with a Pro-Gov’t agenda!
Seems, madam? Nay, it is: I know not seems.
That is: as satellites do not measure temperature, drift and decay in orbit and are frequently replaced, measure different channels, measure less over time, use a model to calculate temperature (plus one groups algorithm to do all this is secret), thus plenty of opportunity.
and I’ll take those points on offer:
o Hansen and GISS are in on a big scare tactic and produce more alarming results than other groups for money [5 points]
o Scientists have ignored all natural processes and just “assume” the warming is anthropogenic, 15+ if scientists don’t consider the sun [10 points]
o AGW believers want a world government/socialist/whatever [15 points]
https://www.facebook.com/ClimateDenialistTalkingPointGame/
Best,
D
Hansen 1999. The GHCN study, the core methodology of all NOAA/UK Met Office future studies. Makes up imaginary numbers for “missing data” and adds 0.3C to everything for no reason.
NOAA sea level study. Adds 10mm during “smoothing”.
Everytime they “adjust” their data, it ends up looking worse than the raw data.
Dishonest assertion.
Best,
D
You deny every bit of evidence placed before you without any research or fact-checking. This is your only argument that we are the ones in the wrong? How lame.
Learn what evidence is. Hint: that wasn’t it.
Best,
D
You’re an armageddon addict.
Anyone tells you the world is going to end, you’ll believe it and repeat it without a shred of evidence.
Anyone tells you that the world is fine, you refute ANY proof they give you.
You’re insane. A delusional nihilist. You really want the world to end. You crave it like a pregnant woman craves ice cream.
That’s not evidence either.
You’re not very good at this. Homeschooled?
Best,
d
Baka.
Nor is that evidence. You can’t hide the fact you have no evidence.
Best,
d
Even the unadjusted surface temps are showing no warming. I’ve been looking at our local weather data and our hottest years on record were in the 1980’s.
You just don’t understand that nothing measures anything. What is detected is a change in volume, resistance, light, etc, which than is calibrated to a number. satellites capture thousand of data points, ground station capture very few ( no data points 80% of earths surface). This than give an incomplete temperature profile of the earths surface. case in point NY city has weather station in central park, and with 11 million people, 3 million cars, thousands of other man made heat sources and the temperature still fall way below freezing, just as it did in 1800 with just a few thousand people and some livestock, how come? You just can’t accept that man is insignificant in geological time.
You just don’t understand
You made that up.
You just can’t accept
You made that up too.
In addition to the two other things you made up upthread, you are on a roll for fabricated statements!
Best,
D
So you hate the Satellite data so much you are reduced to interjecting you superior intellect and knowledge to distract from a great article.
Military pilots follow a simple order during an emergency and it makes a fine order for most of life’s emergencies…..
Maintain aircraft control. Analyze the situation and take appropriate action. Land as soon as conditions permit.
Apparently the warmists creed is scream in mic for attention, take action whether appropriate or not. Bail out if it looks like pilot error.
If you want data you can trust and you want it on the ground – use USCRN. It’s already in place and paid for.
Convince your friends around the world that they should do the same.
That’s just the “analyze the situation” part.
Thanks, I’ll listen to the scientists when I want scientific information, not pilots. Similarly, I don’t call an exterminator when I need a leaky pipe fixed. Or a chef to wire my remodel construction.
Best,
D
There you go screaming in the mic.
Exterminators (as well as electricians and chefs) are required to follow a well established troubleshooting routine. If they screw up through either omission or commission, they are held accountable in both state and federal venues.
Your pay-for-data “scientists” are held to no such standard.
Radio discipline. Stop screaming in the mic.
Science requires scientists. But lemme guess: you call a pediatrician to fix your washing machine.
Best,
D
And your rationale for calling on the pope and actors……
Capitulation by makin up stuff: And your rationale for calling on the pope and actors.
Best,
D
One more source…
The center of Earth is warm…..radioactive.
It’s not much, but it is there.
“The problem with what is causing earth to warm fails to take into account what is supplying the heat!!! Its is the sun!!!”
Of course it is. The failure of many people to realize this is a result of a lack of even the basic laws of physics. That makes it easier for politically motivated groups to push an agenda that takes advantage of this lack of knowledge. The sun supplies all but .03% of the energy budget. The .03% is geothermal and the burning (oxidation) of fossil fuels is minuscule compared to the .03%.
Dr. Roy Spencer = quality. cfact = quality. This article = quality. Last paragraph = beautiful. :)
How many weather balloons are launched daily around the world? It seems like the number could not be very high and their data could not be very comprehensive.
To those who believei in the infallibility of CAGW, it should also be mentioned – tree rings also don’t measure temperature directly, or even indirectly with any accuracy or reliability for that matter. Mann’s hockey stick must therefore be dismissed.
The tree ring data is especially damning. The cherry-picked rings chosen in support of AGW were only 1/10th of the total samples. Others in the sample, taken at the same locations, showed evidence of stable and cooling environments. This is one reason why AGW researchers won’t supply the entire data sets their papers are based on. Doing so reveals their bias and dishonesty.
Contrast how scientific exchange has been done for centuries, except in cases revealed to be scientific fraud. Journals received FULL data sets and supplied them on request precisely so others could reproduce the results.
One major element in scientific research is peer replication using the full data set. The purpose is to weed out research based on data that was been cooked, trimmed, cherry-picked or created out of thin air. The AGW crowd has admitted, in their own emails, of manipulating the data. Now, knowing that their allies in the media and on the Left will cover for them, they have resorted to changing raw data that is decades old and has been the basis of many research papers in the past. Like Einstein once said, in ridiculing an attempt by a rival to explain away his own research, “if the theory doesn’t fit the facts then change the facts”.
The cherry-picked rings chosen in support of AGW were only 1/10th of the total samples
You can’t back this false claim with valid evidence or sources.
The AGW crowd has admitted, in their own emails, of manipulating the data.
Nor can you back this one with valid evidence or sources.
best,
D
I would prefer to say surface measurements are better, but….
When measuring change over time it’s not so important that the measurement be accurate as it is that the measurement be consistent.
You can question the accuracy of satellite measurement ad nauseum, but nobody can question it’s consistency.
As for surface measurements – you have equipment of variable age, quality and calibration, collected and reported by moms and pops, “adjusted” by scientists with an economic bias, and altered by agencies with dubious intentions…….
Accuracy and consistency – the winner is satellite.
Unless, of course the dinosaurs who want to rely on surface based equipment would agree to utilize (solely) the USCRN array as it is, indeed, both accurate AND consistent.
Funny how the dinosaurs make excuses about USCRN not having been around for more than 10 years when their “gold standard” is archaic and known to be unreliable.
nobody can question it’s consistency.
Seeing as how a new satellite(s) have to launched every ~18 months because of orbital decay and drift, it is a mystery why this assertion was made.
Best,
D https://uploads.disquscdn.com/images/86c7c1efd5027122dc29b7571e0cc7211da04679b7fbb39c31c378c03959eb86.png
So, you’re agreeing that there is a procedure in place to ensure the accuracy and reliability of the satellite measurements….. Better to replace the equipment than guess or fake data……
I’d guess you’re pushing for USCRN for surface data since your so tied to consistency.
See there – you’re a skeptic inside.
The premise the NOAA/NCDC data-fudging procedure? is a lie. Is it your lie or were you duped into parroting it?
Best,
D
Still evading the USCRN issue….
Even NOAA/NCDC admits they’ve fudged the data – just won’t provide the rationale or communique – even under congressional subpoena. And, have tirelessly sought succor in Hollywood, the media, science, commerce and religion.
That doesn’t set off bells and whistles does it?
Or, maybe, as Drano sees it…… for the first time in history a government (any government) has acted with dignity, integrity, selflessly, and with no hidden agenda….. in such as way as to increase their money, power and influence………all for the good of the people. Because they faithfully serve the American people. Nuthin in it for them…
Only one who receives rather than gives to the government could follow so blindly.
Purposely dishonest: Even NOAA/NCDC admits they’ve fudged the data
Why such a cheap, transparent fib?
Weak dishonest: won’t provide the rationale or communique – even under congressional subpoena.
Why such a weak fibbin? Why did you choose to be weak?
Best,
D
USCRN. Say it.
I’m neither the charlatan (NOAA) nor the rube (that’s you).
And, you know it.
Say it rube – USCRN
You can’t provide evidence for any of it. You made it up.
Best,
D
USCRN – it’s not made up. It’s accurate, it’s calibrated, it’s automated, well-sited and well distributed. No “adjustment” necessary.
If anything would correlate your pathetic claims of catastrophic warming it would be USCRN. You should be screaming for implementation worldwide.
But you don’t. Your silence is deafening.
Still no evidence, got it.
Best,
D
Still afraid of real data. Got it
You don’t have any real data.
Best,
D
You certainly have the dogma.
You can’t hide the fact you have no data. Or evidence.
You are telling little fibs.
Best,
D
The big reason why surface data sets are showing extra warming has been identified.
https://okulaer.wordpress.com/2016/01/27/why-gistemp-loti-global-mean-is-wrong-and-uahv6-tlt-gl-is-right/
The key finding is when both data sets are limited to 60N-60S we get almost perfect agreement. The big difference shows up in the surface data from extrapolating land reading out over oceans in polar areas where no measurements are available.
False Balance, big fibbin, can’t link to a paper.
Best,
D
Looks like little Bozo2 cannot understand the science, I found it quite simple. It could be explained to a 5th grader with ease. I guess we can chalk up more denial from this clown.
It wasn’t science, little False Balance.
It was a blog post.
Aren’t you precious? You are! You are precious!
*pat pat*
best,
D
LOL. Little Bozo2 doesn’t understand the post. Hysterical.
Little LOLO False Balance fails to hide the fact it called a blog post “science”.
Aren’t you precious? You are precious!
Best,
D
dano2 you are comedy gold!
what is hilariouser is that you can’t refute a single byte of what I typed. Thus the reason you run away and hide.
Best,
D
stop, you’re killin us!
Still not refuting one byte of anything I’ve typed. Ever.
Best,
D
I’m a layman, so don’t skin me alive. I think two things are happening now to cause it to be warmer in the Northeast, where I live; el Nino and the January thaw. El Nino, as I have learned from reading the work of career geologist Dr. Tim Ball, is caused by the tectonic plates beneath the Pacific Ocean spreading apart and releasing a large amount of heat. This drives more moisture into the atmosphere and impacts on the weather; more rain in the desert Southwest, more severe storms coming up along the Atlantic coast, warmer and snowless northern winters. Add to this the January thaw phenomenon, and you get mild sunny days at the end of January. This situation is temporary; el Nino is cyclic, and la Nina conditions will follow, which will occasion the opposite weather effects; drier and warmer in the Southwest, fewer violent coastal storms on the Atlantic side, and colder wintery conditions in the northern regions. My crystal ball says that we could be up to our eyeballs in snow by the end of March around here. Climate, by the way, is the average of daily changing weather. Climate is always changing, but it is nothing to be shocked or alarmed about. We are in an interglacial period. That means that we currently enjoy warmer temperatures relative to a glacial period. When the next glacial period actually begins we do not know how quickly it will arrive, or when. Oh, and that greenhouse effect is 90% caused by water vapor condensation and .01% CO2. If there were a bit more CO2 in the atmosphere green plants would grow better, and the world food crunch might be eased. Just saying :-)
I have learned from reading the work of career geologist Dr. Tim Ball, is caused by the tectonic plates beneath the Pacific Ocean spreading apart and releasing a large amount of heat.
Tim Ball is a quack.
Best,
D
I just can’t lower myself into the toilet that you stay in, Dano 2
This article is vital to show the science of global warming is not settled when so much political noise about an alarmist future is based on very flawed measurements. Thermometers measure the weather not the climate and climate trends. As Dr. Spencer explains, “Virtually all thermometer measurements require adjustments of some sort, simply because with the exception of a few thermometer sites, there has not been a single, unaltered instrument measuring the same place for 30+ years without a change in its environment. When such rare thermometers were identified in a recent study of the U.S., it was found that by comparison the official U.S. warming trends were exaggerated by close to 60%.
– See more at: http://www.cfact.org/2016/01/26/measuring-global-temperatures-satellites-or-thermometers/#sthash.Dx3S3cVW.dpuf
Measuring an a single average temperature of the the whole earth is surely meaningless. It is like saying with your head in the stove and feet in the fridge your temperature is average. No. Geography is a critical variable and so ignoring Antarctica temperatures especially when recently they recording the coldest day in history makes nonsense of the alleged “warmest year in history.”
Excuse me… The Mercurial Thermometer is the only “Primary” standard for measuring ambient air temperature. It is the Standard that is used to calibrate all other temperature sensing elements. Are we sending technicians to space to perform routine calibrations on those sensors? If not, how can we be assured that they are accurate over time?
At the most basic level what is the accuracy of thermometers, RTDs, thermocouples, etc. that are taking the readings? Add to this what about the human element in
taking readings? In short after every statement of temperature should be a
statement of accuracy.
Regarding satellite data – at some point they need to be calibrated for “ground
truth”. Post launch calibration is challenging to say the least. What is the accuracy then?
http://www.mdpi.com/journal/remotesensing
The best analogy I have heard lately is that measuring the average temperature of the earth is like measuring the average telephone number around the globe. It is impossible to do and meaningless overall.