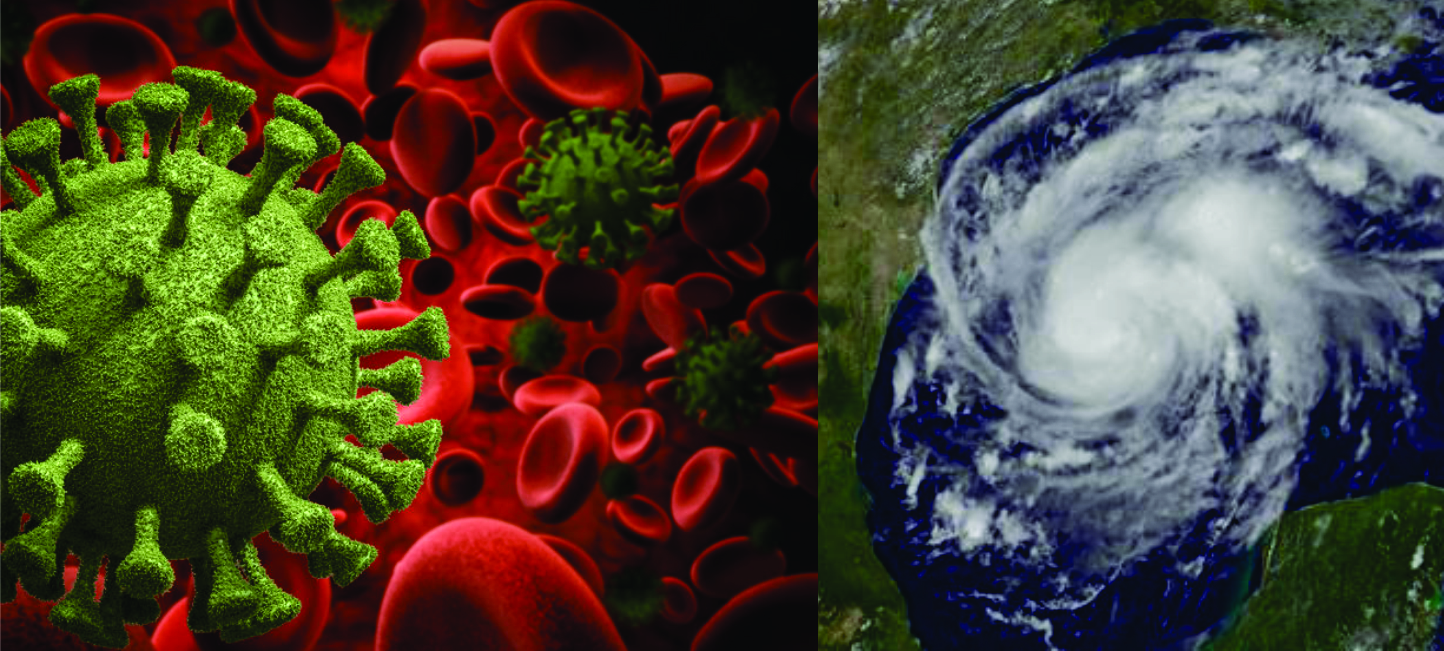
When it comes to COVID without the percent of positive stats to match, you get an incomplete picture.
If no one was tested yesterday then there would be 0 new cases. If a million were tested at 4% it would be 40k which would be a huge spike in the absolute number. But since the overall positive rate is 8%, it means if we could see that trend in % positive, we would see a decrease. Some days there are more, some days less ( tests) and the new positives respond accordingly to around that 4% status. BTW at the start of this, it was close to 20% positive. Deaths are down about 120 a week from the week before. It is interesting how this ties into the weather, which is why I am obsessed with it.
Let us take hurricanes. There are more tropical storms classified today than there were 70 years ago. Yet 70 years ago was the middle of the 3 biggest decades of major hurricane hits on the US coast. More storms are being named in the middle of nowhere because we now see them. It is as if you see more, you are aware of it. But are the major hits rising? No. In COVID, IF YOU TEST MORE, THEN MORE SHOW UP IF ITS PRESENT, which it is. However, looking at landfalling major hurricanes there were close to 30 1931-1960. But since 1991 (same time span we’re told- it is getting worse) it is 16. Now assuming 1 or 2 big ones hit this year, it is still way less than the worst 30 year period.
To assert that things are worse today, they deny yesterday.
In the case of COVID, if you do not get the crucial chart of the percent of positives, you are naturally going to think the situation is not improving. It is improving, but by slower increments, as infections decline, but we are not seeing all the data. The percentage of positives is crucial.
Back to hurricanes. In the 1950s, the average ACE/storm was over 10. Despite the Katrinas, Rita ect, the last 30 years could not compete in ACE index/decade with the 1950s. Why? Because so many storms that may not have been seen in the 1930s-1950s are being seen now so with more weaker members out in the middle of nowhere, it adds to the total pool and lowers the ACE/Storm average.
So again using the parallel to COVID, if you test more you have to see more. If you have satellites trained on every cumulus swirl, you see more. So if we had the kind of coverage then as now, some of those storms may have been seen stronger out over the water. What is the rationale behind that? Look at the way more storms hit close to peak intensity in 1931-1950 vs storms now, that with the exception of Harvey and Michael this decade, hit OFF THEIR PEAK. Katrina and Rita were major hits, but not at their peaks. So in terms of the bottom line, which is impact, we see the hysteria and the doom and gloom with tropical cyclones without the entire picture, one can buy into the idea its worse than ever. Tornadoes are the same thing, strong to severe ones are decreasing.
High-risk areas of COVID are more prone to the outbreaks just like there are areas where hurricanes and tornadoes are more likely. But does that mean people who are not in these areas have to take the same precautions as those that are not? We must stop these regional COVID outbreaks, but we knew that was a risk we had to deal with. Yet when a big hurricane hits Miami does not mean people in Des Moines should be preparing to get hit. Nor does a tornado outbreak in the plains mean that tornadoes will be just as bad in other places.
The common denominator to me is having to dig and look behind the scenes, to counter some missives that are meant to politically weaponize an issue. As someone who has been involved in the climate debate I could not help but bring up these ideas for your consideration.
