Likely more predictable than the weather, which btw we warned our clients on the East Coast about what happened from over a week away with this storm, we see one of the usual suspects blaming climate change for Isaias.
Suppose I say, ok, you are right. (he is not, but suppose I do) then is the record low amount of activity in the western Pacific also a sign of climate change? And given the advocacy of a global community, since the number one producing area of tropical cyclones is shut down, is that not a positive?
I doubt any of the people pushing this are aware.
Now before any of my detractors say I am insincere, remember I took on President Trump on his Dorian situation. It was here on CFACT. Hopefully we don’t hear this more than once as the president kept doubling down of what many of us, 7 days out, look at and smirk.
Now here is another question. Why was this not worse? After all the water is warmer than average off the east coast? Why did it weaken off the Fla coast? I know the answer as we covered it, but the fact is he does not know and does not care. And how did we have the 1821 hurricane which was a Cat 3 when it hit around NYC, or the 1938 hurricane? Or 1933 which had wind gusts higher than this across Long Island and was hitting VA Beach! Or Hurricane Hazel in 1954 with a gust of 113 mph at the Battery, dwarfing Sandy, Isaias, and Irene.
All of these were before manmade climate change became what is to blame for every weather event, even those that are dwarfed by previous events. Its all part of the weaponization of weather, brought on not because an atmospheric apocalypse is raging, but because of a political agenda that tries to make this some kind of war where people fighting it are looked at as heroes that save the planet and change the foundational values that made this nation what it is. How else can you say such things in the face of weather history.
Why the damage? We outlined this over 5 days in advance on our site and if you follow me on twitter you saw me talking about it.
1. A configuration of the upper level jet, similar to Gerda in 1969, that resulted in that storm going from a Cat 1 to a Cat 3 as it accelerated northeast. Usually storms weaken on that path. Isaias was in a similar situation so we said from late last week it would not weaken very fast if at all relative to its landfall intensity. Its track was similar to Hanna in 2008 which was like a strong sea breeze by the time it got up into the northeast. The track and where strongest wind gusts came from.
2.Most storms pass to the east of the east coast and the same strong wind from the north and northwest does not produce the amount of damage an east, southeast or south gust does. The trees lean toward the south or southeast because of the prevailing wind and where the sun is in the sky during the day. So they are built to take the northwest wind. But the same wind from the southeast, with trees fully loaded with leaves and water on the leaves to make it heavier, meaning the tree has to take the gusts in a situation it is not accustomed too. In the winter many trees have no leaves on them (evergreens of course do) so unless loaded down with snow and ice, they can take the gusts. And those gusts would not be coming from the southeast because if they were, it would be raining.
We were warning all our clients about the amount of damage and power outages that would happen. Supposedly there was more tree damage in New Jersey from tropical storm David in 1979 with winds well under what the stronger Gloria in 1985 had. But David went up to the west and so the gusts came from the southeast, not the north or northwest. The 1821 hurricane reportedly blew down all the trees east of what is now the Garden State parkway as it came straight north over coastal NJ. Can you imagine the set up for that, to sustain that storm?
That storm today would do more damage than Sandy Irene and Isaias combined.
Hopefully Fay and Isaias are not dress rehearsals for something bigger, which is a big concern I have.
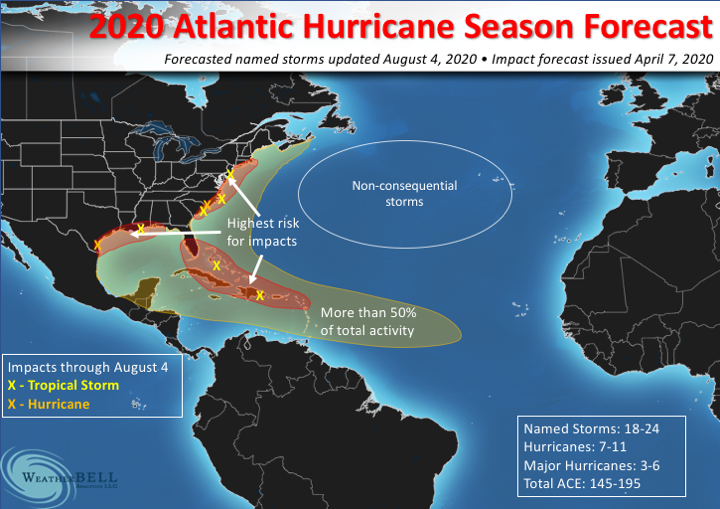
So what about the rest of the season?. Well there is a long discussion on our site, but the map we issued in April for where these were going remains unchanged. As does the amount of hurricanes, major hurricanes and ace index to which the total number including tropical storms, is up a bit.
The map shows where tropical cyclones have hit relative to where we thought many would go (again this was issued in April). But the bottom line is after the breather the 2nd half of the season looks like a nasty period well into September. The only positive I see is the last month, October, may not be as bad relative to averages. But if Mayor Cuomo had this map back in April, then what has happened so far and what may happen again would be no surprise.
Weatherbell.com is more interested in where they are going rather than total number. (Though because everyone is doing that, we do also. You can look to numbers that came out in early March!). So the big issue is stronger storms doing much the same thing can really cause problems. And unfortunately if I am right, this will be political. The irony of it all is that the forecast was made based on looking at natural, not man made factors.
But remember the western Pacific is liable to have one of their lowest total years on record. A question of balance, which if you look, nature is always trying to answer.