
We have long thought that if more people had been required to take a course in Geology in High School, the human-caused global warming exaggerations would be more difficult to pull off on an unsuspecting public. Our simplified version of what is going on in and around the Earth should help fill the void.
The way the Earth formed, its rotational path around our sun, and its own axis are typically taught in Geology but ignored by the well-financed climate modelers. They are arrogant enough to throw a few variables into an equation claiming its solution predicts our Earth’s temperature decades hence. Sadly you and they disregard the known fact that your TV weatherman is correct on his 7-day forecast only 56% of the time. The modelers will tell you that climate and weather are two different things if you believe that they may have an island in New York’s Hudson River to sell you too. Generally, the climate is considered a 30-year compilation of weather. If we can not predict the weather 7-days hence with any certainty, how do they expect to predict climate?
Historical considerations. The Earth’s climate records.
In Fig 1[i], we see the last 50-million years of Earth temperatures. There is a great deal of information on this chart, but just focus on two critical points:
-
First, the unmistakable trend (green arrow) in the global temperature IS relentlessly downward.
-
Equally important is how much the temperatures dropped – It went from a global maximum of about 80 degrees Fahrenheit to about 55 degrees F, a 45% drop.

In Fig 2[ii], we go back as far as data allows us and see other trends. On the bottom-right corner, we first note the above 50 million years in context. But then we note that:
-
For more than half a billion years, the Earth’s temperature remained at a steady 78-80 F. Even after it was interrupted by three cataclysmic events; the temperature bounced back up to this steady 78-80 F.
-
Secondly, starting 525 million years ago, we see a 225 million year period of declining levels of CO2. Then CO2 remained at this dangerously low 180 ppm level for about 70 million years when all life on Earth was in danger of extinction. Luckily, the Earth’s volcanic and tectonic activities drove temperatures and CO2 back up to habitable levels. But starting 175 million years ago, the CO2 level was again on a steady decline. This decline continued until the end of the Little Ice Age about 250 years ago and fortunately has now reached a safer level of 420 ppm.
-
Now, here’s what we don’t see, over a 550 million year period, any relationship between CO2 and global temperature.
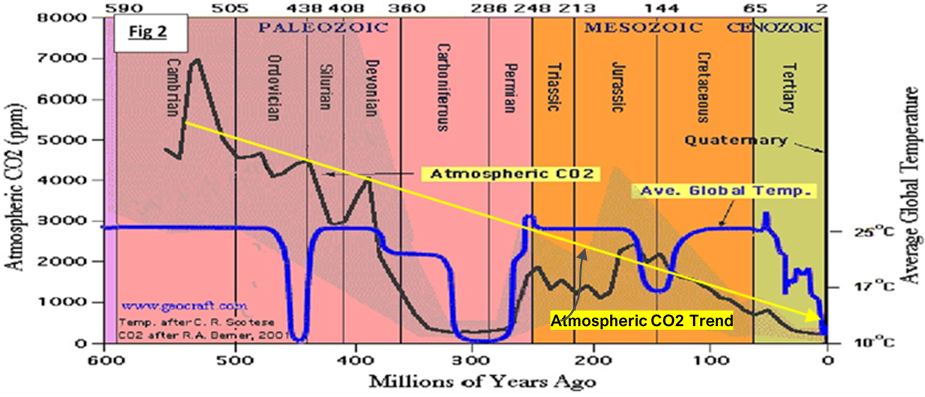
We are immediately left to wonder, where has all that CO2 been going? But, in fact, we do know that it is being used by a wide range of calcifying critters like corals, crabs, clams, and marine plankton. Much also becomes locked up in limestone rocks, such as the well known White Cliffs of Dover and the Alps. Over this entire 550 million year period, CO2 fell from more than 0.7% of the atmosphere to 0.018% 20,000 years ago. We are fortunate that we are now putting some back in the air because plants and all life on Earth will not survive on less than 0.015%.
Geological considerations[iii]: The Heat History of the Earth.
Fig 3. shows us that the Earth is a heat engine. Today the Earth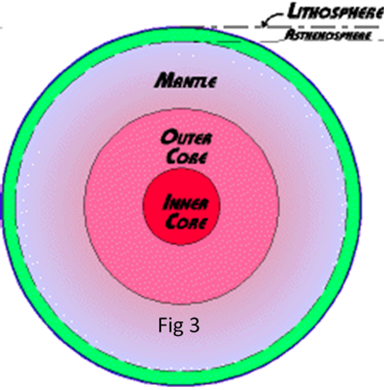
remains geologically and biologically active and evolves because there are two sources of energy. One source of energy is from the Earth’s molten core (which plays a role in the Earth’s geology), and the second is, of course, from the sun (that supports life in the atmosphere and the oceans.) The United Nations Intergovernmental Panel on Climate Change (IPCC) tells us that for the Earth must be climatically in balance, or we will have either global warming or global cooling. However, IPCC reports recognize the sun as the only source of heat supplied to our planet. Therefore, the Earth must radiate to space as much heat as it receives from the sun each day. Ignoring the planetary heat from its molten core, which likely provides as much as 5% of the Earth’s heat.
The Earth formed from the accumulation of meteorites and asteroids impacting with each other over about 200 million years. A large moon or mini-planet struck this mass a glancing blow: the resulting heat and mass-created a molten planet. The heaviest, hottest materials sank to the center, and the lighter materials floated in the outer shell area. Over the last 4.5 billion years, the planet cooled and continues to cool to this day, but remaining heat is sufficient to drive all continental, volcanic, and tectonic activities. By the simple laws of thermodynamics, we have a hot Earth-mass a mere 500 Km away from the near absolute zero temperature of outer space. Therefore, until the Earth cools to near absolute zero, the natural state for the Earth is to keep on cooling. Of course, the natural (thermodynamic) role of the sun is to delay this Earth’s cooling trend for a few more billions of years.
We already know plants love CO2 – so should we.
Fig 4[iv] is a photo from the New York Times bestseller by Alex Epstein, “The Moral Case for Fossil 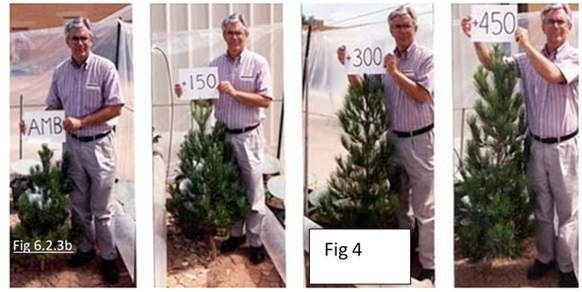 Fuels.” In this controlled experiment, these four plants are identical species and in age and growing environments. So, why are they so different? Here we see how much faster and healthier trees grow as we increase the amount of CO2. NASA[v] tells us that over 35 years in the late 20th century, the planet Greened (more plants) by the equivalent of half the size of Australia. It also increased Leafing (bigger, denser plants) by twice the size of the USA.
An added bonus is that at higher levels of CO2, plants use 35%-70% less water. They do not need to draw in CO2 as often while losing more of their moisture to the atmosphere. The result is more plants can grow in drier climates. In addition, the small increase in global temperature of the last half of the 20th century contributed to increased plant growth by extending the agricultural range 100 miles to the north.
In fig 5,[vi], we see the Satellite global temperature records of the past 40 years. We use satellite data because, as revealed in the Climategate emails, the so-called, “Surface Temperatures” have been corrupted in two ways: a) adjusted, “aka-fudged” at least four times and b) The number of reporting stations have been coming offline at a record pace and replaced by computer-generated temperatures of what the station temperatures should have been, and then adjusted.[vii] The three great peaks of the last 20-years were powerful El Niño years. We hit a peak temperature in 1998, yielding total global warming of less than 0.5 C in the last 40-years. 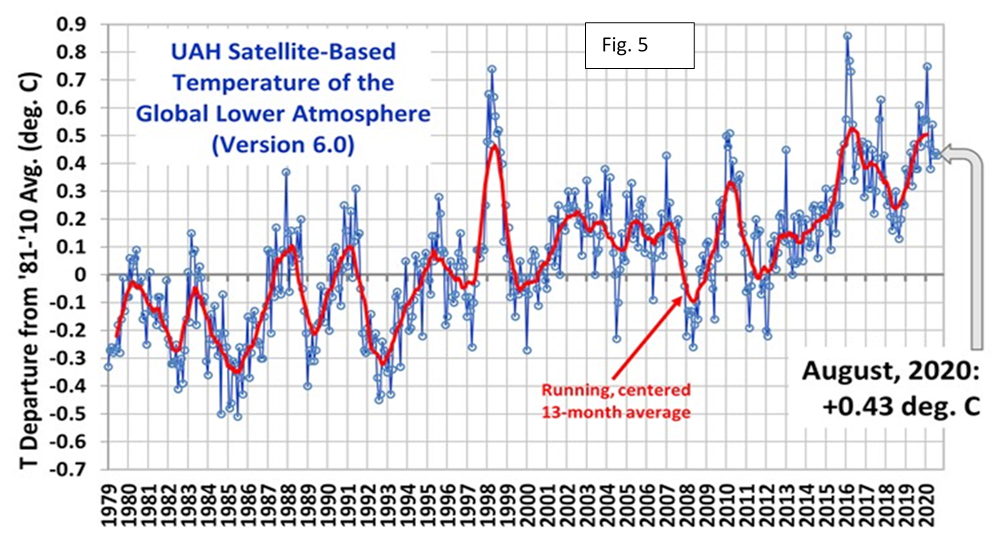
But you are not reading about this from the media, press, politicians, and the CO2 industry? They say “The Science Says….fill in as required,”…….. All that increased C O2 will cause more global warming and melt the poles and perhaps drown all of us! The existential threat you hear so much about.
But there is no data! Show us the experiments and results, and who has duplicated them? And please enough with climate models. The output of computer models is not data; that’s garbage in and dogma out. Finally, if in doubt, choose sanity and hard data over fear. Unfortunately, fear is the tool used by alarmists to obtain power and money. Your common sense should tell you that any small addition of life-giving carbon dioxide that supports all life on our planet does not place any of us in peril.
Unless a greater majority of the public begins to recognize the absurdity and arrogance of believing that humanity’s actions negatively impact life on our planet, our standard of living will dramatically decline. This will be the result of the decline in the use of fossil fuels and the continued financial investments being made to control our climate, which can never be achieved.
[i] http://landscapesandcycles.net/antarctic-refrigeration-effect.html
[iii] https://csmgeo.csm.jmu.edu/geollab/Fichter/PlateTect/heathistory.html
[iv] A hitchhiker’s Journey Through Climate Change, p 156.
[v] https://www.nasa.gov/feature/goddard/2016/carbon-dioxide-fertilization-greening-earth
[vi] https://i0.wp.com/www.drroyspencer.com/wp-content/uploads/UAH_LT_1979_thru_February_2018_v6.jpg
[vii] https://thsresearch.files.wordpress.com/2017/05/ef-gast-data-research-report-062717.pdf