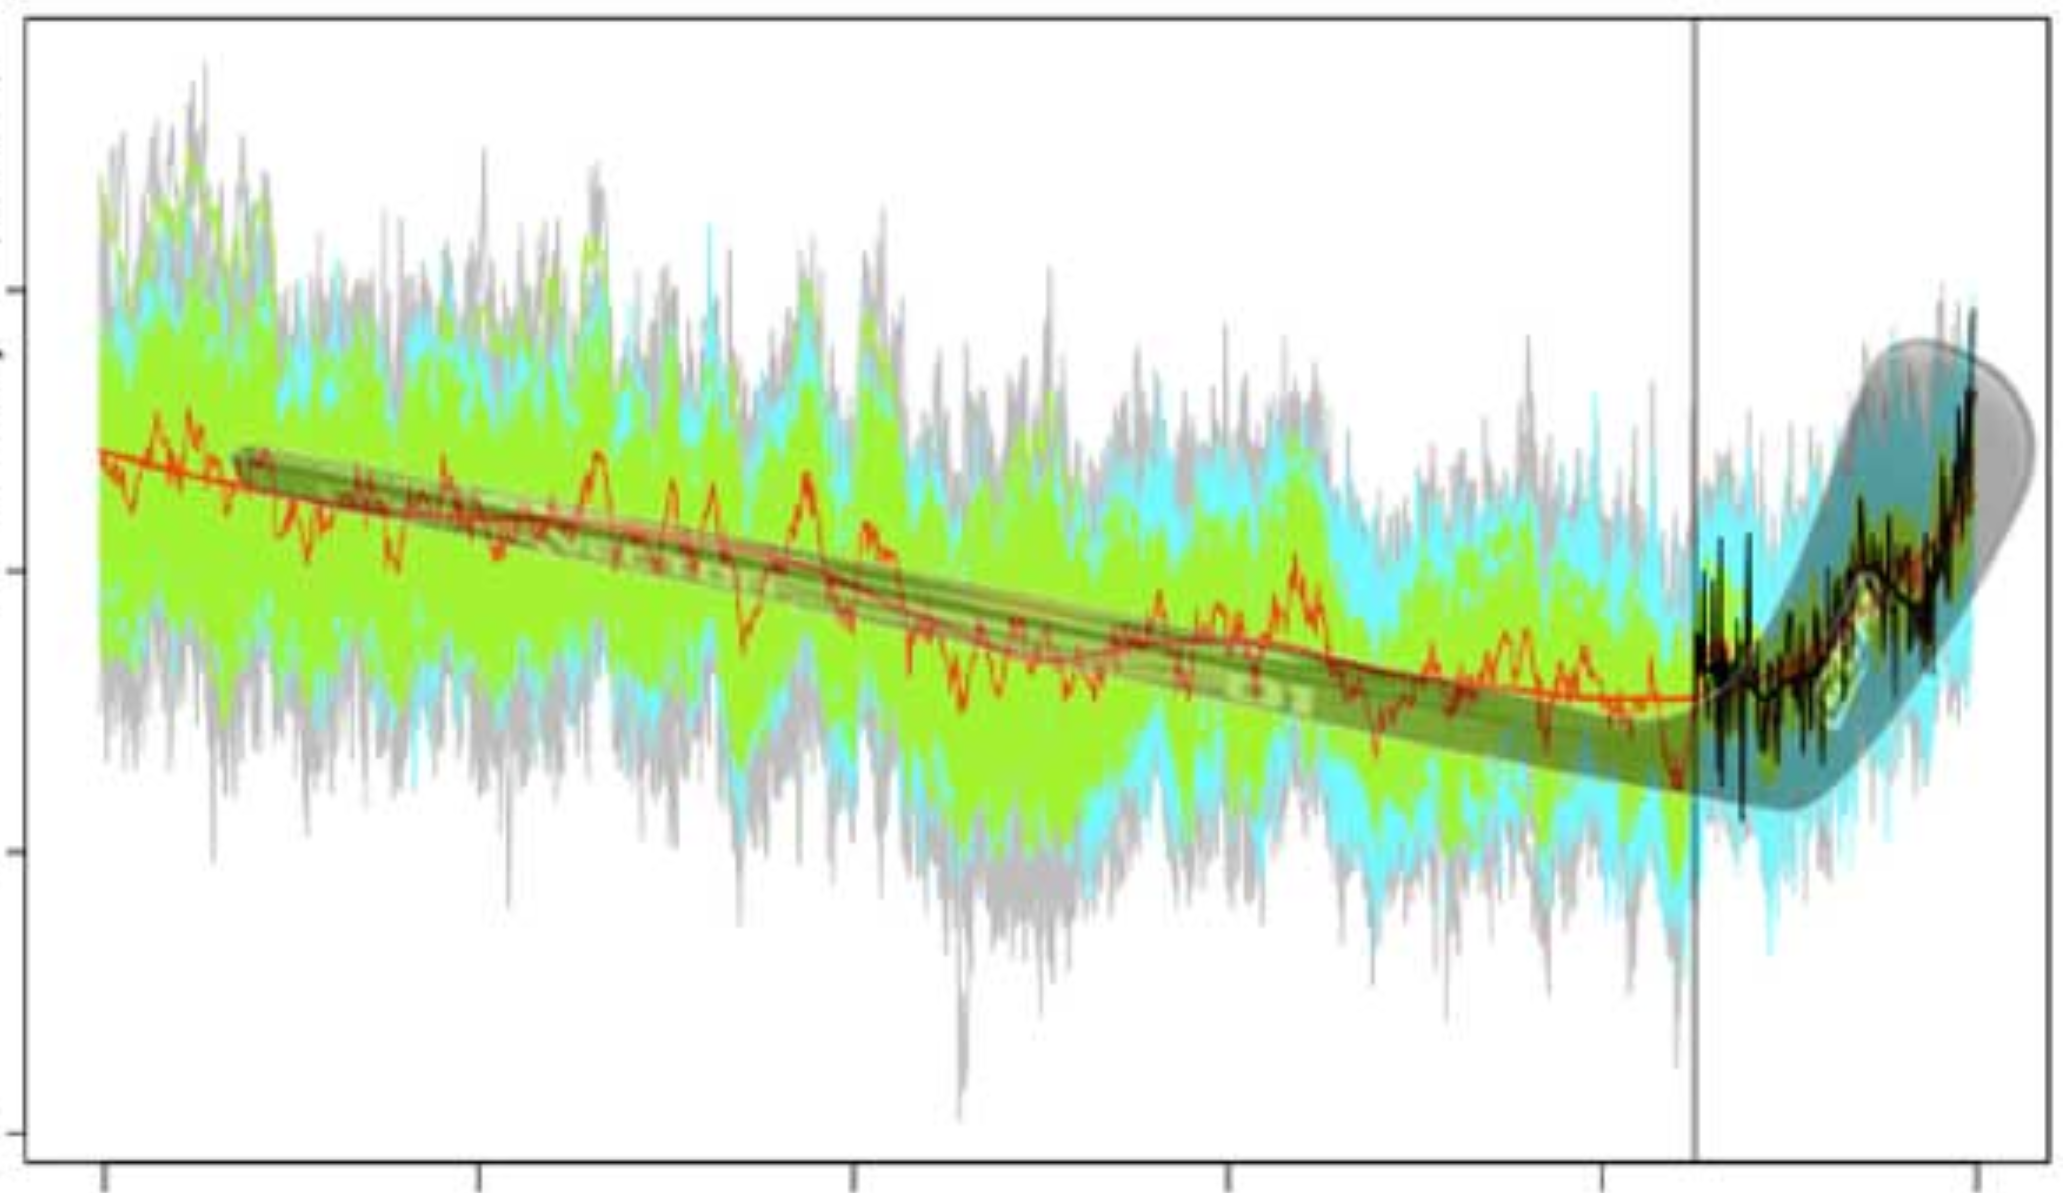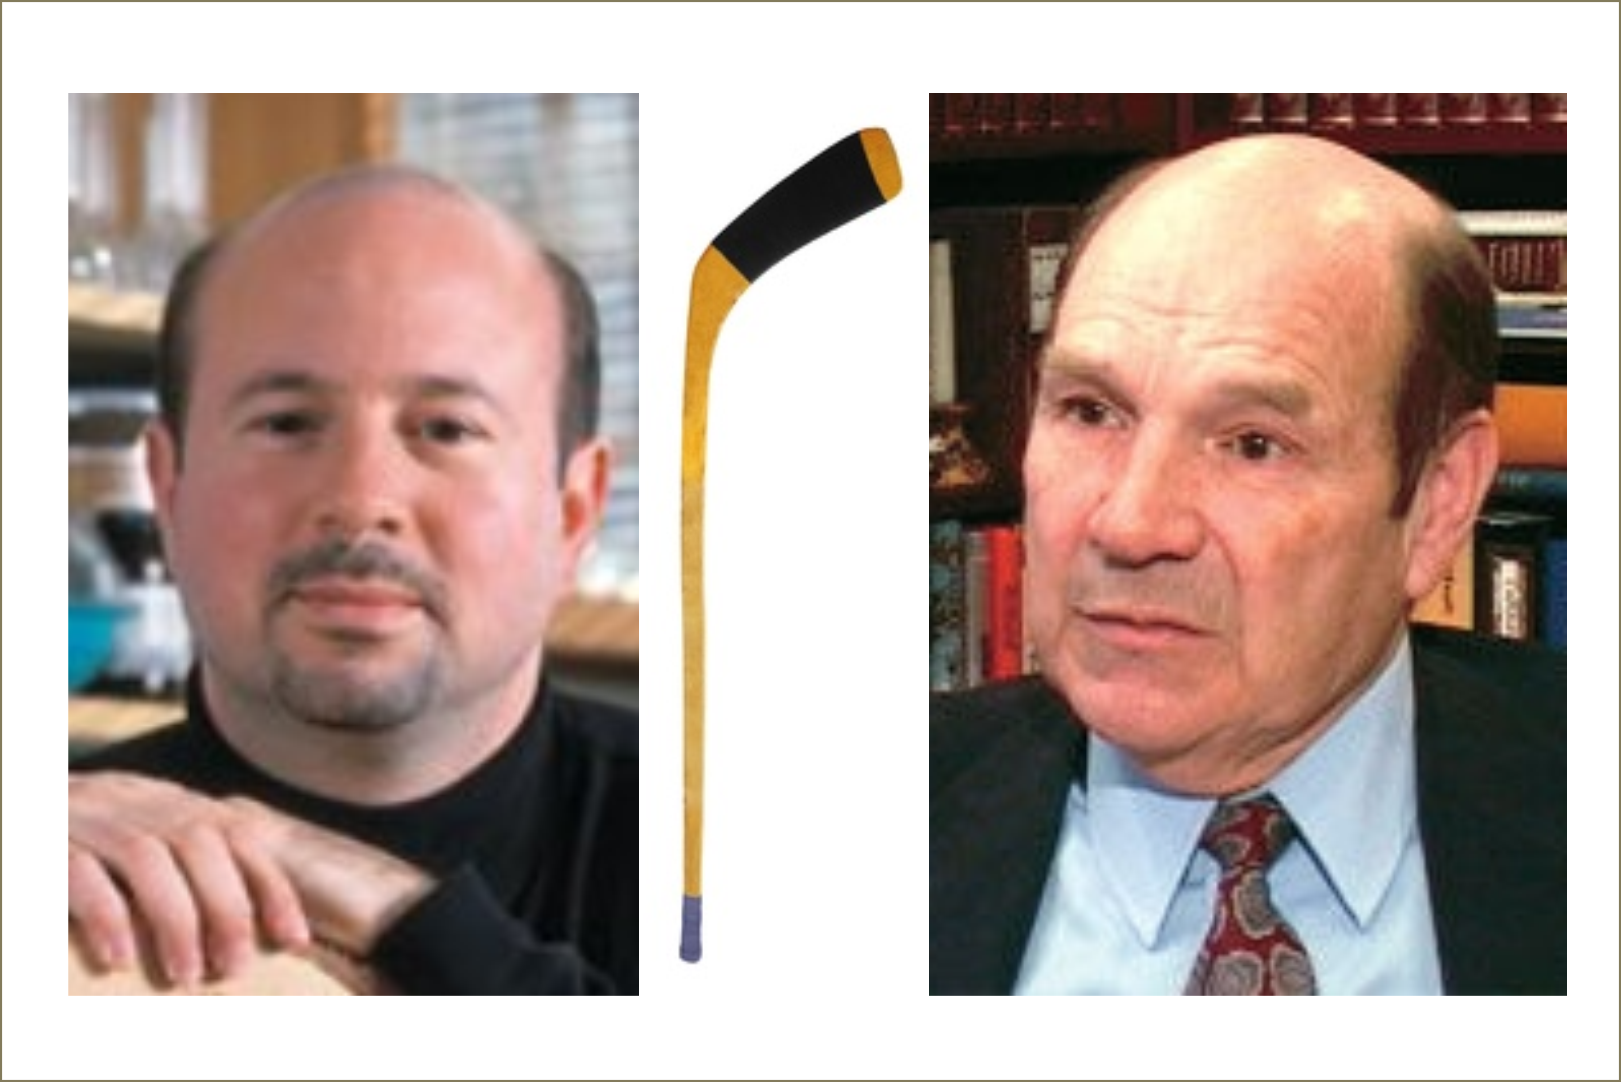
The “hockey stick” curve obscures Earth’s CO2 history
When you look at the earth’s historical levels of CO2 you need to microscopically view a small piece of the 600,000,000-year history of CO2 in the graph at the extreme lower right corner to see the “hockey stick” curve.