Ida shows nature’s attempt at balance via the atmosphere. It may seem odd that an extreme weather event can demonstrate this, yet extreme events provide evidence of this balancing act. Only if one refuses to look, does one not see this is at least an attempt. There is ample evidence of the balance the atmosphere always seeks. This is what was taught at Texas A and M in the 1960s, and my dad taught me: That weather and climate are nature’s eternal search for a balance she can never have. Some swings are gentle, others extreme.
Here are some counters to the extremity of Ida, but on the other side — Counters you never hear about.
Let’s start in the Arctic, which has not been heard from this year,
( all these can be found here)
https://wattsupwiththat.com/reference-pages/sea-ice-page/
Another below-average summer temperature-wise in the arctic.
this continues the trend of no temperature rise in the summer season.
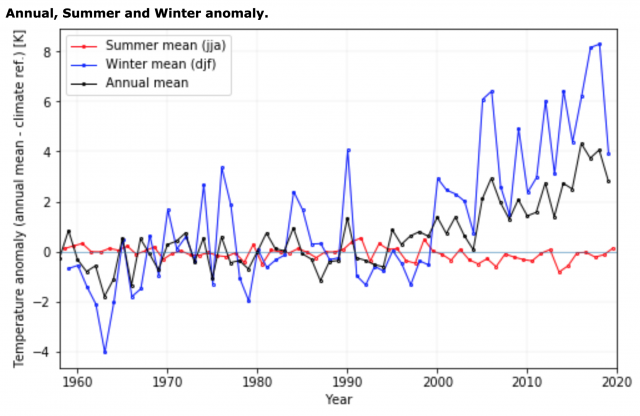
This is important for 2 reasons 1)Given the relationship of water vapor to temperatures, the rise in winter temperatures is directly linked to the increase in water vapor, a product of cyclically warmed oceans. We are not seeing that in the summer since it would take more water vapor at the higher temperature to do that. 2) Without the summer warming, there is a cap on the melting. 3 or 4 winters in a row of an increase in winter ice and since because of a lack of increased summer melting, a total increase would occur and perhaps dramatically,
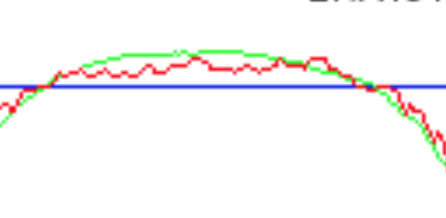
Sea ice decrease over the last month has been one of the slowest on record for August and we are well above the last 10-year average
the solid LIGHT blue line is that the 10-year average. THE DARKER BLUE is this year. The dashed red is the record low. While still well below the 1981 to 2010 average, it’s well above the other 2.
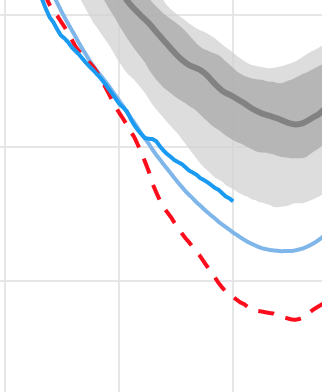
and it is certainly nowhere near the rumored disappearance of the ice cap.
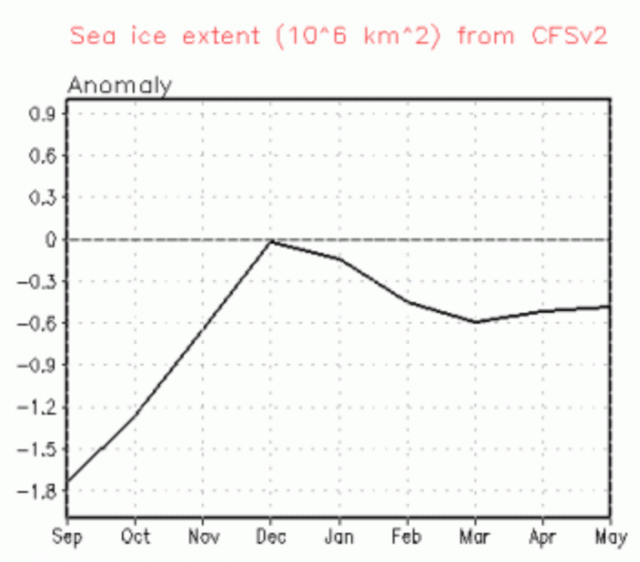
meanwhile, the antarctic ice cap is about as much above average as the arctic is below
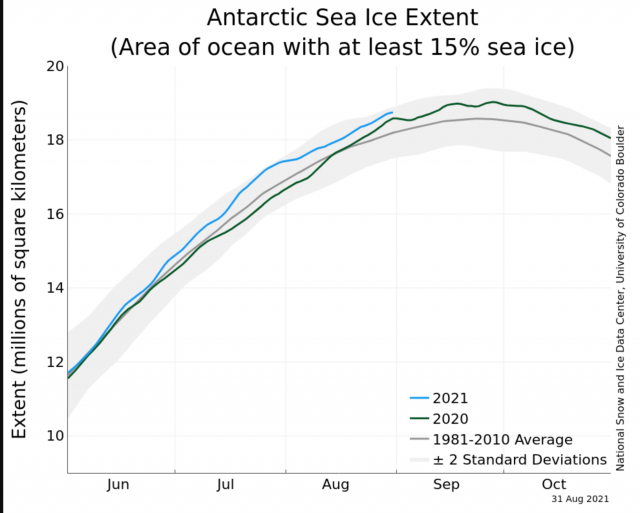
and sea ice is actually forecast to get close to touching the average!
And what of Greenland? We have heard about how it is melting so much, Maybe it’s because it is snowing so much! The Surface Mass budget is above average!!!
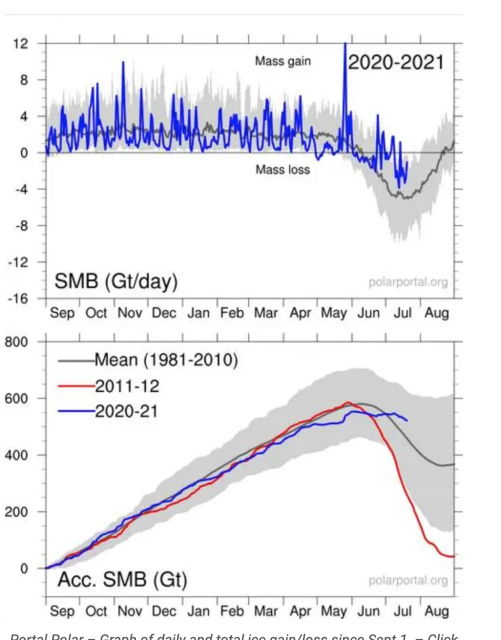
Right there we have several counters to the extreme that is being pushed with Ida
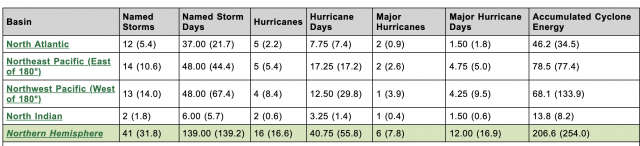
Let’s go to the tropics, We have the basin ( the northwest Pacific) that contributes the most to the ACE index globally and FOUR TIMES THE ATLANTIC BASIN at just a tad over 50% of average. The northern hemisphere is well below average at about 80s%. Back to back, the western Pacific could have the lowest 2 years in a row on record, This has a much greater implication as far as a global tropical activity than the increase around North America. Both are a by-product of the Madden Julian Oscillation. When the Western hemisphere is active, the opposite is going on in the western Pacific. Why is this being hidden from public knowledge? You can see the balancing act at this site
http://tropical.atmos.colostate.edu/Realtime/
How about Long Island? Between 1938 and 1985 Long Island was hit on average once every 9 years by a hurricane, Since Al Gore pushed the global warming panic button, it has not been hit. Which of course is good for all his friends at the Hamptons, but quite frankly they are thumbing their nose in the face of nature living where they are because will take back what she has given. If the 1938 hurricane returns with the buildup out there, its a disaster. Same thing for President Obama’s place if a storm of that magnitude hits Marthas Vineyard. We just went through FIVE tropical cyclone landfalls before having one hit as a hurricane. That has not happened before ( that amount of landfall with none being hurricanes). In the wake of Ida, Julian and Kate back to back may be the weakest, short-lived tandem on record So there are arguably another 4 balancing counters to Ida in the tropics
And btw the average ACE index is under 5 this year and was only 6 last year, The Decade of the 1950s, the entire decade, it was over 10/storm! More storms detected maybe, but weaker.
What of Wildfires. We are below the 10 year average of acreage burnt ( another counter). See for yourself here:
https://www.nifc.gov/fire-information/nfn
10 year average thru the date. Acres burnt: 5,715,421
This year: 4,971,541
The last. 3 years thru the date
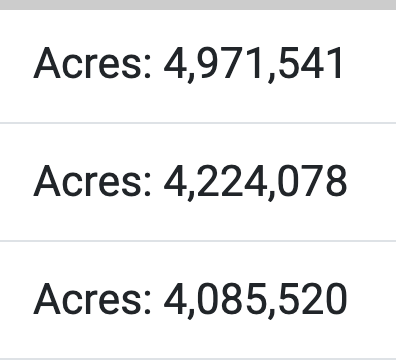
are the lowest 3 year stretch thru date in the last 10 years
That 10-year average is only 20% of the average of 1926-1935
More counters you hear nothing about
3 more. I am going to stop here, but there are many counters to the Ida missive you are hearing.
Believe me, I can go on, I wrote a book about things like this. ( The Weaponization of Weather in the Phony Climate War)
While in any given weather situation, there is always something that comes up short with forecasts, one forecast that I always know will verify is the reaction of people whose extreme seeks to destroy any search for balance. Ironically enough, to see the balance takes the willingness to go to extremes, but the problem is if a fixed goal becomes the God you seek, it eliminates the lesson of the journey and limits the chance for the right answer. The extreme in the pursuit must be focused on finding the balance that nature always seeks, not ignoring it for your own ends.
Ponder this: You have seen me list some of many many counters I can list. If one believes in God and truth is a trait of God, what is hiding the truth a trait of? Ah yes, there is IMO a spiritual aspect to all this
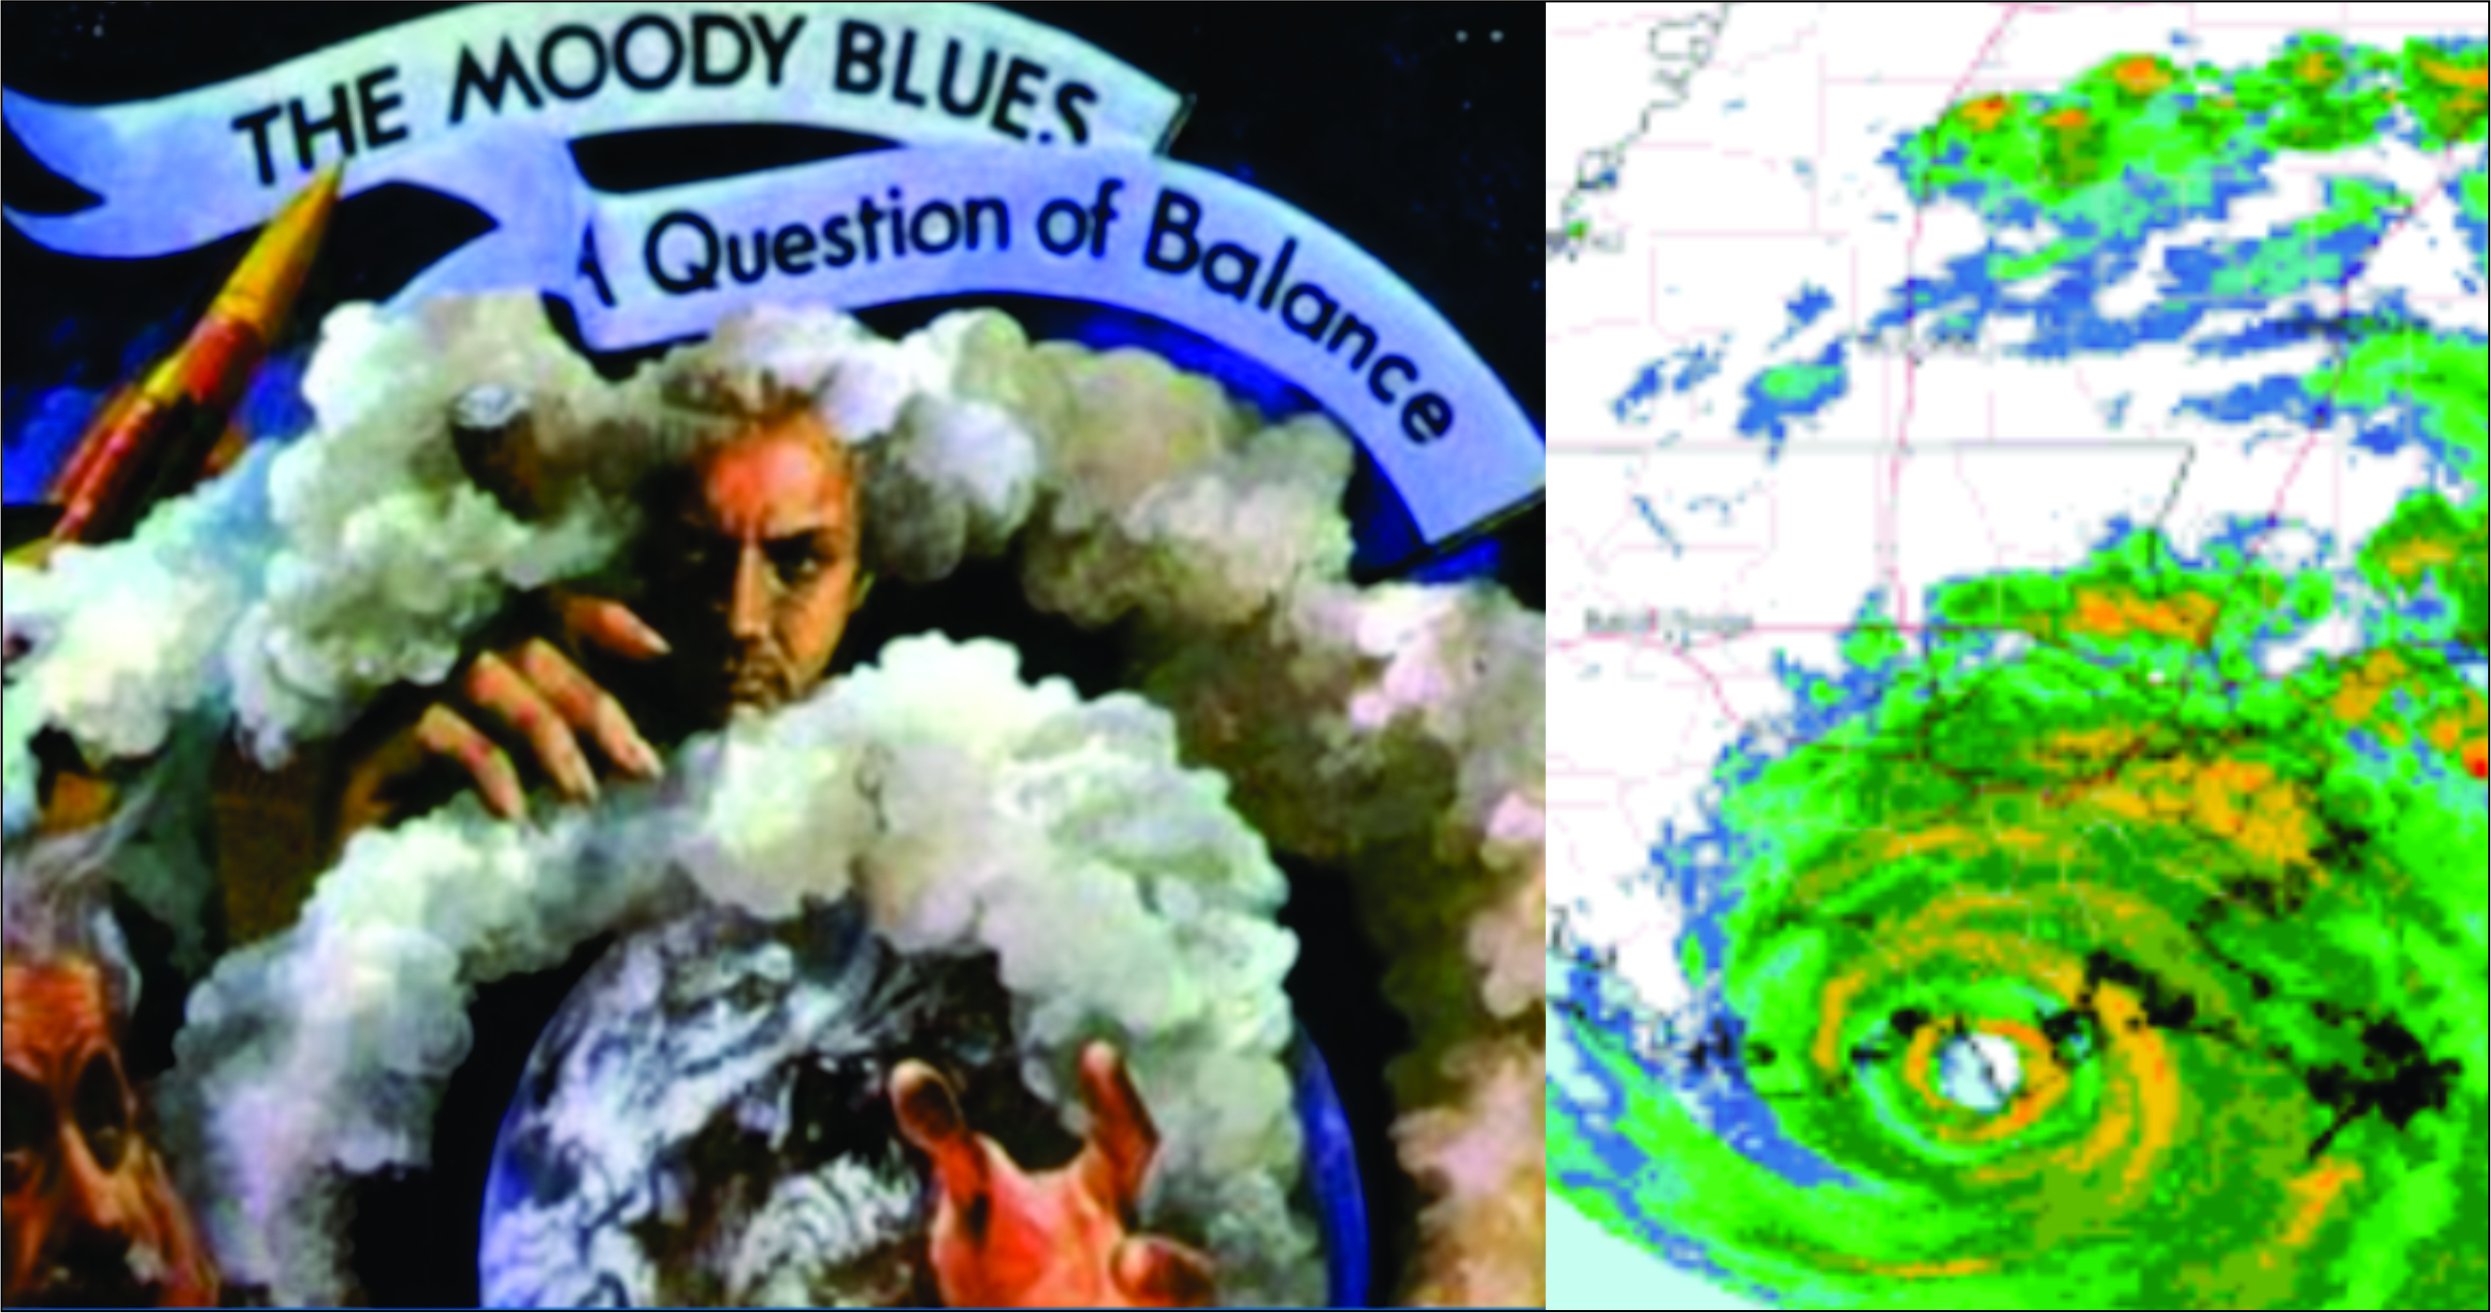
But how does an extreme like Ida help answer the Question of Balance in the weather and climate?
Well First consider the MJO and this chart
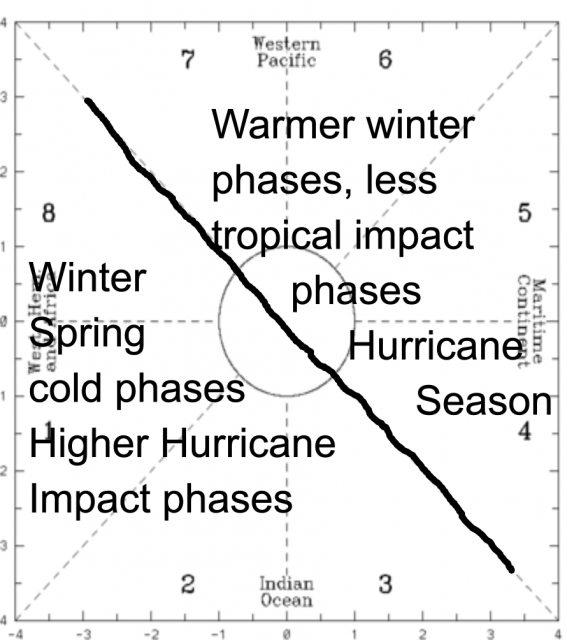
Once again, like last year, the tropical cyclones impacting the US are stacked in the SW hemisphere of the MJO
Last year
.png)
Again leaning in the means in the southwest hemisphere
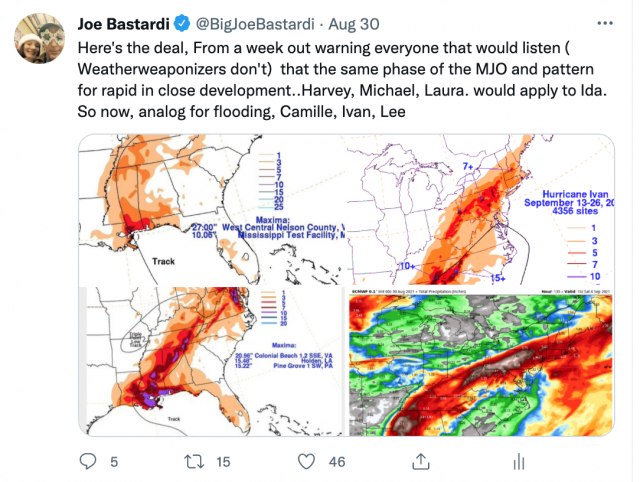
All 4 major hurricanes since 2017 that increased in intensity in the last 48 hours to the coast ( and all forecasted by us using this methodology) occurred in this phase 2
Remember Irma was weakening and was a longer tracked storm
Harvey: August in Green
.png)
Michael.: ( October in red here, Michael hit on the 10th)
.png)
Larua:. August in green
.png)
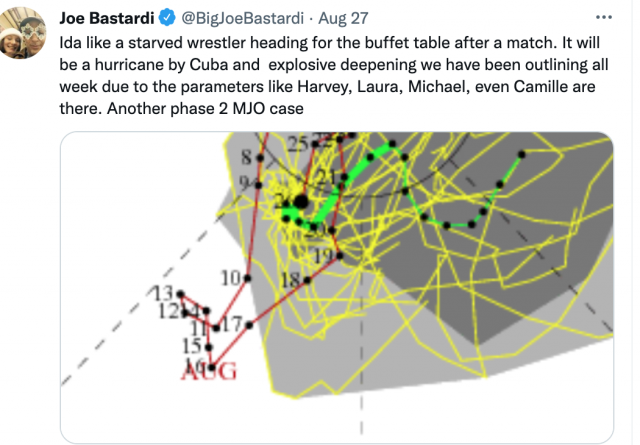
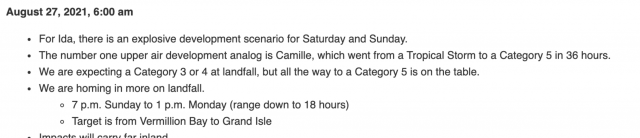
Ida
.png)
you can see it in phase 2 at the time of landfall.
You can not ignore that, All of them within 2 days of the coast exploding. And all predicted by Weatherbell.com well in advance because we understood what was going on. It was the nature of the season we had forecasted in all these years.
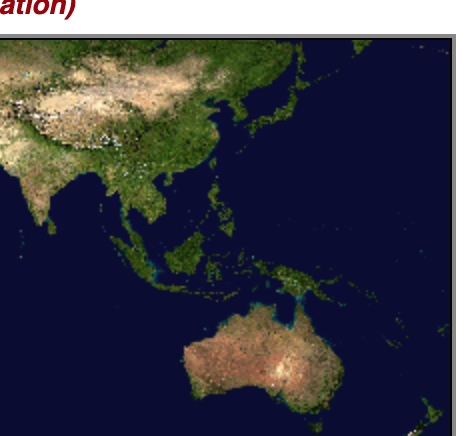
Meanwhile, as mentioned above, the western Pacific, home the greatest amount of tropical activity for an individual basin, (4x the Atlantic) was completely shut down and had one of the least active Augusts on record
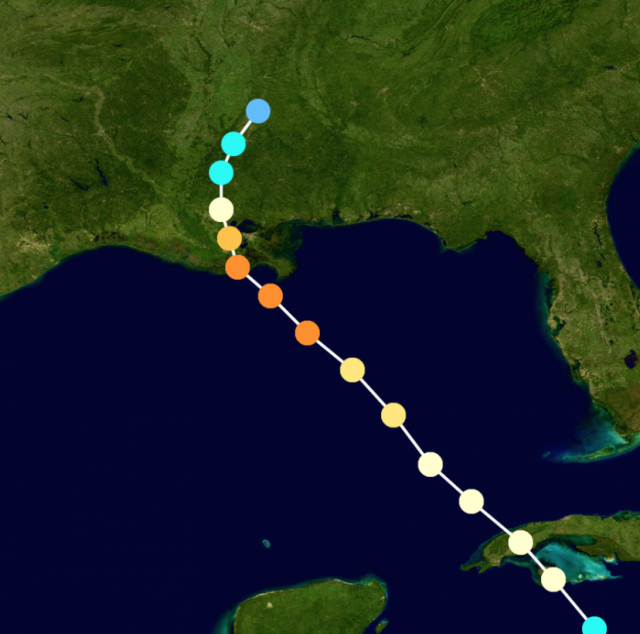
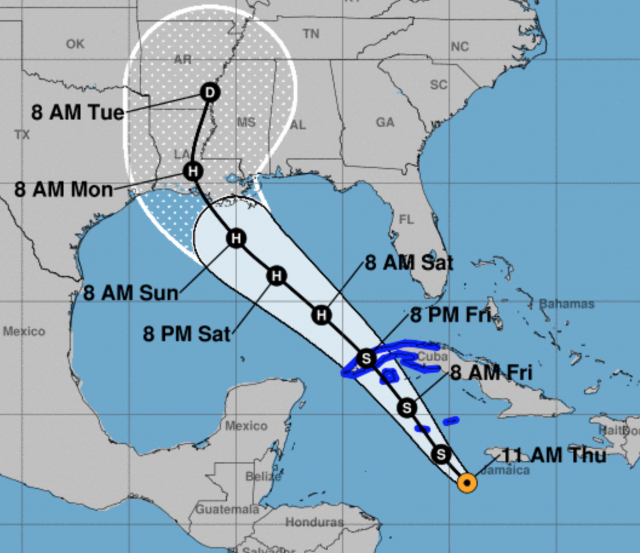
Now here is something to consider. Katrina, which also occurred in the favored phases shown at the very start of this ( in this case )1 moved like this
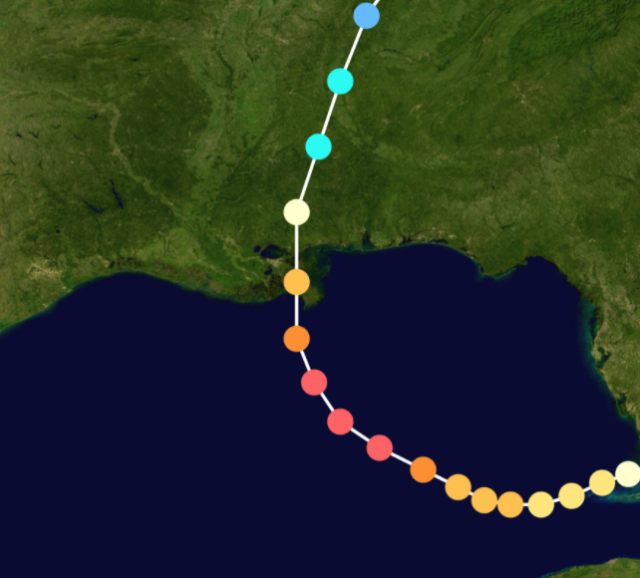
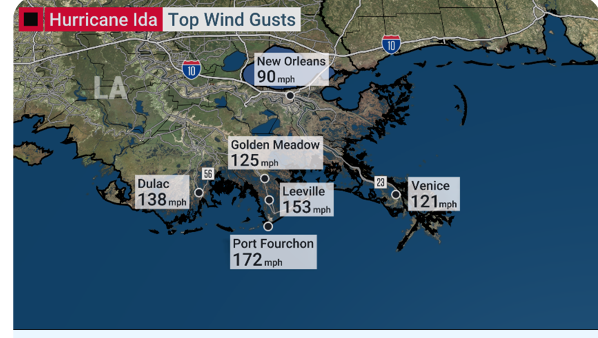
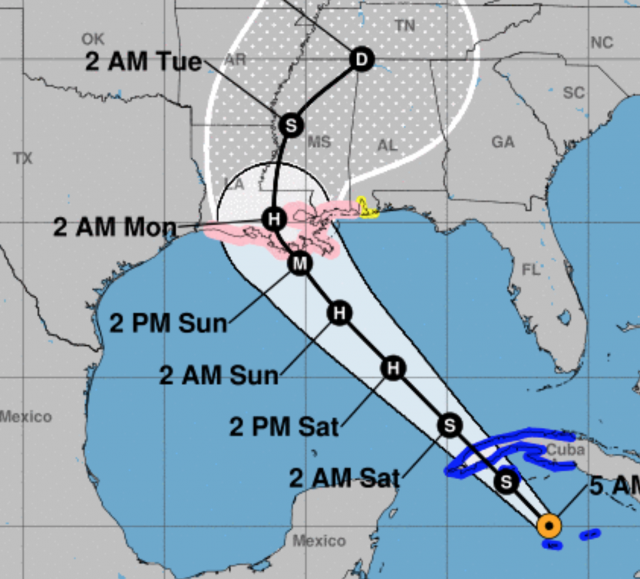
Ida moved like this:
This almost split the difference between 2 of the most infamous storms in New Orleans history, another being Betsy 1965
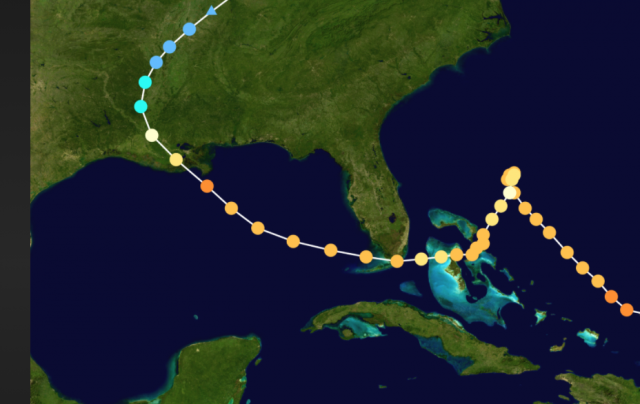
Notice how much longerBetsy was a major hurricane btw.
Now if we throw in the 1947 storm which was a cat 5 when it hit Ft Lauderdale but less in New Orleans
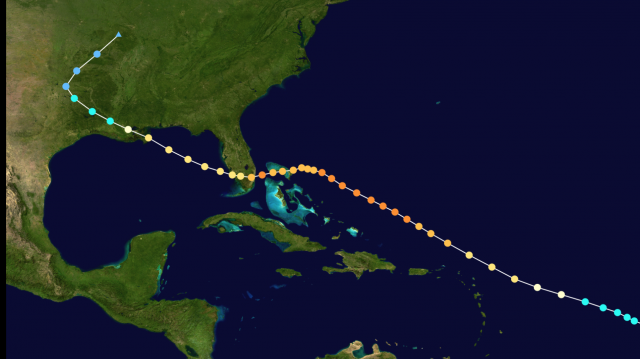
you see the perfect track for the worst case. So when putting IDA in perspective, why should WE NOT EXPECT some time in the future, a storm with the 1947 type track and the intensity of the other storms, hits? The very position of Louisiana makes that a matter of when not if. When considering IDA and its size relative to Betsy which had much more extensive hurricane winds further west,
Betsy
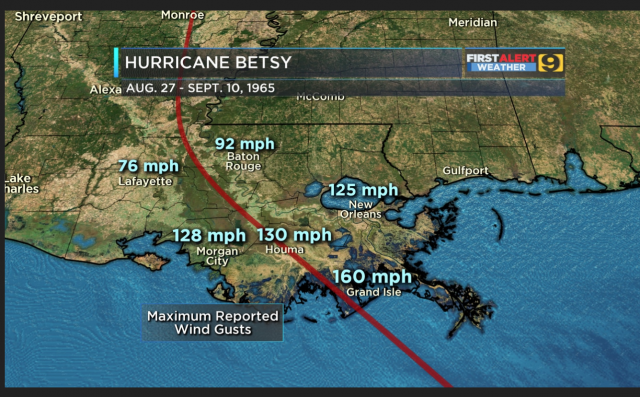
A Betsy would have done more damage today than Ida simply because it was more widespread and there are more people in the way. A 1947 track with Betsy’s intensity or greater, certainly well within the realm of nature, would have likely dealt a blow where much of the area impacted by Ida might never recover. But it is no hocus pocus co2 driven reason. The question of balance here looked at, would lead to the conclusion that an extreme has to eventually happen. But if you have an agenda, you hide the knowledge of such things so that when. ( or even worse you do not know and so are not qualified to make the statements you do ), not if, but when it shows up, you claim its because of what you are pushing,
It also argues for 3 things
1) MJO research and development is a must
2) The Power and Impact scale, which incorporates pressure tendency and would have upped the category will in advance ( as well as the radius of tropical storm and hurricane winds) is needed
23 Project storm fury and the seeding of rapidly intensifying hurricanes coming to the coast should be restarted. There is nothing to lose
But we knew and understood this in the preseason last year and this year. So the impact forecasts issued in April plainly showed, relative to averages where we thought the greatest activity would be
In fact, the trap for the Weather Weaponizing Climate Predators ( they weaponize the weather and prey on people that do not know some of the facts we are showing here)was laid in the spring, Just like last year.
Last year
This year
So the overall pattern detection methods from spring put people on alert, not for the number of storms or whatever, but the idea that there would be high impact, Then it becomes a matter of honing on as you get closer to the variables that line up.
In addition, the larger scale intensification problem was outlined beforehand with an explanation as to why storms like this have been occurring ( hitting at their peak with rapid intensification, while longer tracked storms have weakened off their peak relative to their heyday in the 30s, 40s, and 50s and into the early 60s.. Again a question of balance. Close to 80% of storms that were major hurricanes. more than 4 days away hit as majors in these years. Close to 80% of landfalling storms 4 days out in the last 25 years ARE NOT hitting at their peak. So as another example of the balancing act, let me refresh your memory with this:
SLP pattern for storms hitting near or at their peak
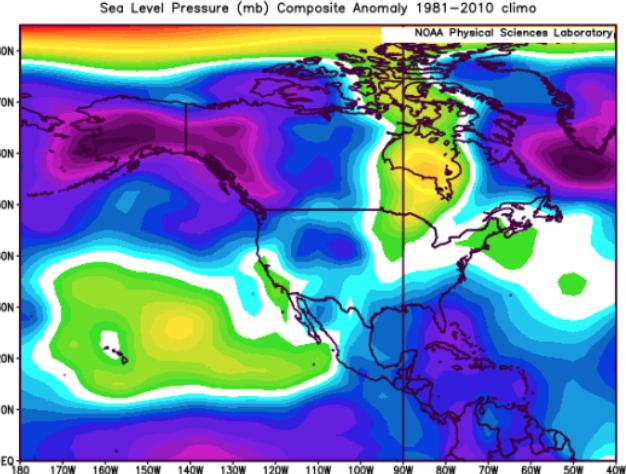
Recent years in the warm era
notice the displacement north of the center of lower pressure, which in effect causes storms to “unwind” in the means as they come out of the tropics. The type of convergence we see when high pressure is to the north is not there.
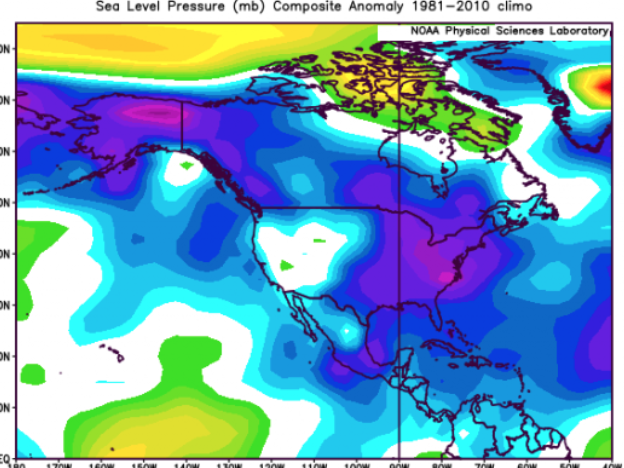
Notice what the SLP pattern looked like for the 4 shorter tracked, but very intense storms I have described, ones that stick out like sore thumbs in recent years as most storms have hit off their peak since 1995, especially if longer tracked.
There is that higher pressure in Canada trying to stick its nose into the east, rather than the lower pressure that has become a by-product of warming
notice also the common denominator of lower pressure over the west with the short tracked intense hits and the years’ longer tracked storms hit near their maximum, The key here is understanding what is going on to allow a storm to hit while it is at its extreme, Its a question of balance that the extreme event is answering, The fact is that the warming world and lower pressures in the means across North America make it less likely that the monster long tracked storms we saw in the 30-s through the mid-60s hit. ( these were not only strong but bigger), So in the warmer era, they weaken like we have seen with Irene, Matthew, Irma, Florence, and Dorian, off their peak and have been replaced by a more compact storm that is actually easier to forecast if we simply line up the MJO and SLP patterns!
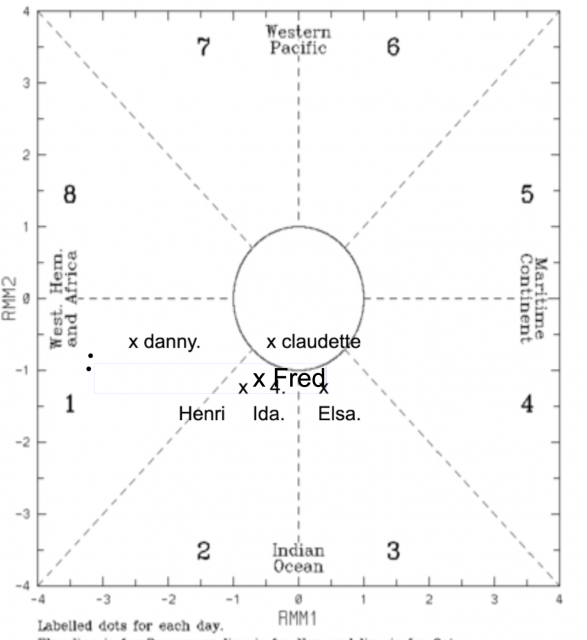
But look at this year. We have the majors Grace, Ida, and Larry, The 2 that hit NAMER that were majors hit in phase 2 Larry is way out at sea. Claudette and Danny were minimal tropical cyclones at landfall, Elsa, Fred, Henri underachieved, Fred and Elsa likely due to a track so close to Fla, Henri likely because Fred’s low pressure to the north destroyed the pressure pattern needed for the big hit wth Henri which could have joined the classic New England hurricanes and then some as it hit from a direction, moving west of north, that is something that has always been feared but never attained.But for the extremity of Ida, you had the question of balance answered by the opposite, For the first time, FIVE tropical cyclones hit the US without one of them being a hurricane, UNTIL IDA. Perhaps it should have been 6 if a feature that hit Texas in May was classified. And back to back, Julian and Kate were likely the weakest, short-lived tandem on record. Are those not extreme events, the other way to balance off the event being blamed on climate change?
But I set the trap for them right after Henri, This is because I understand what their strategy is, Its no different than the guy sitting in the crowd at the baseball game, that thinks he can play better than the guy on the field that actually works at it, Is there any difference? He yells and screams that he could have hit the pitch, or made the catch, or whatever. Where were any of these people 5 days before Ida and 3 days before the flooding? Where were their forecasts? nowhere to be found. Instead, they wait till after the fact.
But the reason I stayed on Twitter is so I can publicly show people what we are showing our clients and by doing so lay the trap to expose the ignorance and hypocrisy of those that use the weather as a means to an end. So like the Texas freeze, let’s look at the timeline. And since they have no idea what is going on until it is a threat, I know they will walk into the trap! They are more predictable than the weather
I even stated I was doing it
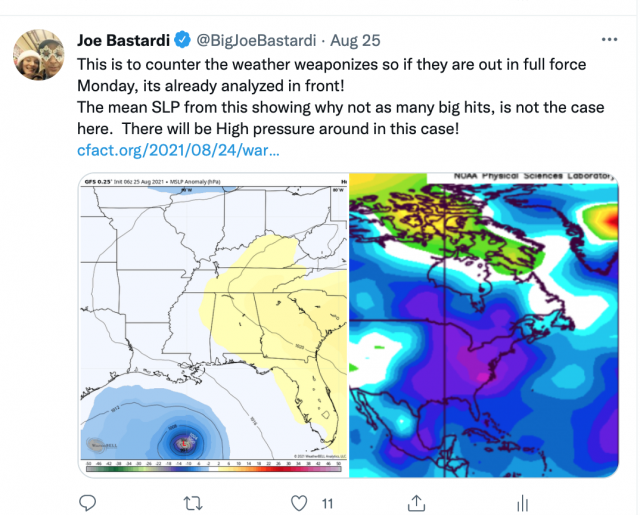
This is from the 25th:
http://Weatherbell.com premium discussion on impending Hurricane. Phase 2 MJO like Harvey and Laura and similarities to pressure pattern jacking up risk factor for major development last 2 days in, …. similar SLP patterns to Harvey, Laura
.png)
So we are showing people the why before the what and saying a major hurricane is going to develop. At this time what did NHC have out?
Nothing,yet.
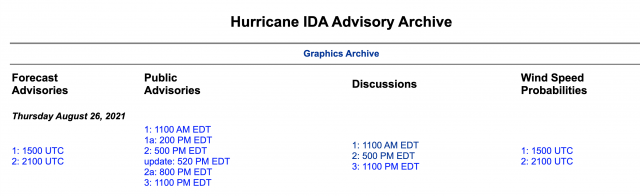
advisories started on the 26th. I put this on to prevent Monday morning quarterbacking, not from NHC, but from people who will claim it was obvious. Before an advisory was issued we were forecasting a major hurricane!
Also from the 25th
·
I AM PUTTING THIS OUT NOW. The type of situation next week we are dealing with may be of the genre of Harvey, Laura, Michael…IOW the set up for a storm hitting at peak intensity.
And this, trying to explain the situation due to the phase of the MJO:
·
I have been very vocal about MJO rotations into the phases for major hits especially around the gulf and the MJO sneaking into the same phase as Michael, Laura, and Harvey ( and Grace further south) is something we have been pushing
When have you ever heard any of these weatherweaponizers get out in front and try to show people this kind of why before the what?
then it was a matter of honing in.
This was on the 26th
·
My take is this is going to be a major hurricane. Number one UPPER AIR ANALOG is Camille which exploded. This is in the same MJO phase with similar upper air/slop patterns as the 3 majors that exploded coming to the US gulf coast, Harvey, Laura, Michael.
Look at the names being mentioned here for people to look at to understand what is coming, The Who’s who of in close exploding storms that hit at their peak. Are any climate predators even looking at this time?
NHC at this time
So the first advisory had no major on it, Again this is to stop the Monday Morning quarterbacking that says the climate change made it so obvious. How is it the best Tropical Cyclone center on the planet did not have it if it is all about climate change? That is not a knock on NHC, it is to demonstrate what these agenda-driven people are about, and it should be obvious I set a trap for what they are saying now
So the first forecast for the Major from NHC. WHICH IS THE BEST IN THE WORLD OF ALL THE TROPICAL CYCLONE CENTERS IMO was the 27th
If it’s Climate change, why not sooner? And why so many other storms that have stayed so weak?
Lets go to the 27th
We embargo these for several hours since our clients then subscribers see it, but this is 6 am Aug 27
I wanted people to understand why this is perfectly natural from Aug 27:
Awesome demonstration of phase 2 MJO correlation as the west pac is completely shut down ( which is a huge climate signal) while all the action around NAMER AND ATLANTIC.
On the 28th most people were picking up on what we were saying from early in the week
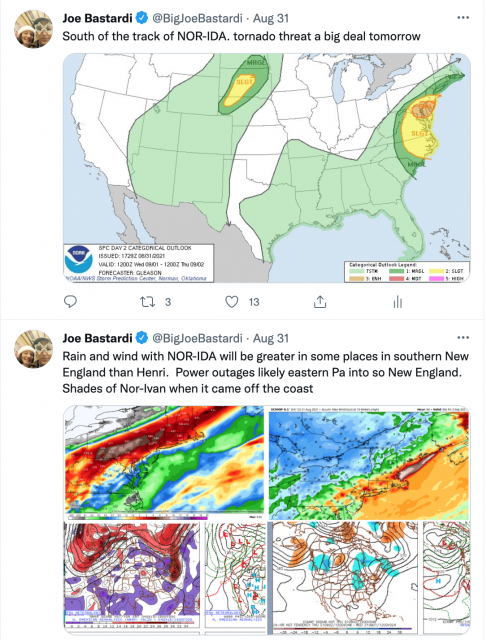
But I want to show you one of the tweets on the 30th
but by that time, the feature we dubbed as NOR-IDA ( I stole it from a mentor of mine) was already being shown and we warning people!
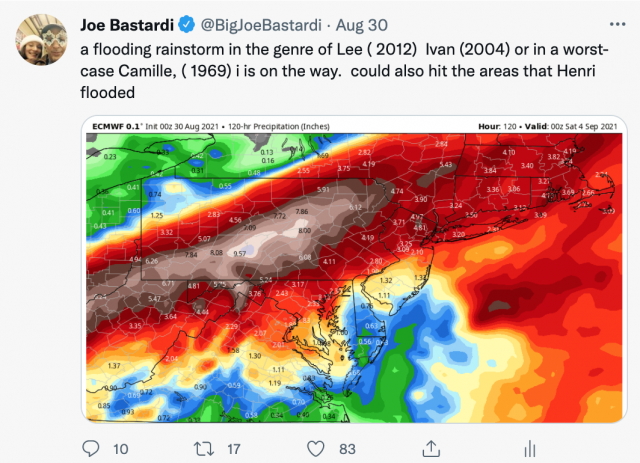
If you understand weather and do not use it to push an agenda, those names should alarm you, And there it is again. CAMILLE. which dumped over 25 inches of rain in the mountains of VA in 10 hours! Henri the week before had dumped half of foot of rain around NYC and right here you can see us saying it was coming again. ( tweet 1)
On the 31st referenced hurricane Carol which put Providence underwater, to try to add perspective to anyone objective enough to see it
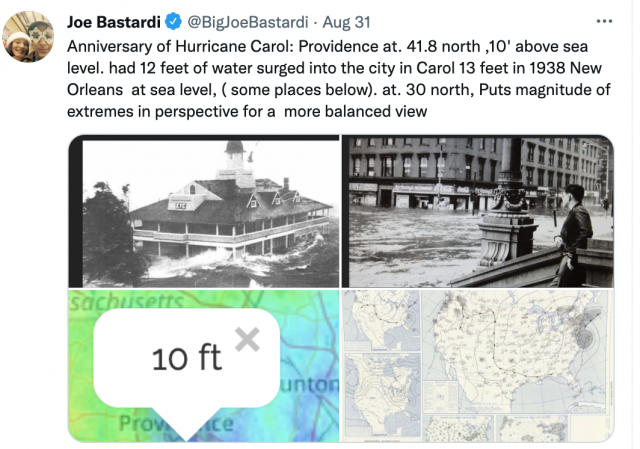
I can not let people know any better, even put maps on from what I called Nor-Ivan in 2004 which this looked like, Had flooding and tornadoes and pulled something even wilder, came all the way around back into the gulf ( funny story, the first time I was on John Kasich’s show was the Saturday Ivan was coming off the east coast. When I told him what it was going to do, I thought he was going to leap thru the screen and choke me. The following week he had me on again and I used to do Heartland quite often). But we dubbed this Nor-Ida. ( combination of Noreaster and Ida)
So while the Weather Weaponizers are out in full force, you can plainly see not only was the Why before the what on this was talked about way before but the trap was set to catch them at their own game and expose them. Where were they before? And why does anyone listen to someone that never makes a forecast and using all this for an agenda?
But the timeline is there, The counters with other major events ( dare I saw extreme, the slowest August on record in the largest basin for tropical production is extreme) that answer the question of balance, speak for themselves.
This is long but does not even contain all the evidence that counters what you are being told. I think you can see the trap was set, and here on CFACT, it is sprung for all to see. Let those with eyes see, those with ears listen, And above all understand that for every extreme you see one way, there is another the seeks to answer the question of the balance nature seeks but can never have, because of its design. And who designed nature? It wasn’t man. But leave it to man to hide aspects of the truth. If you do believe in God and truth is a trait of God, then what could be the source of non-truths or hiding of all aspects that lead to an answer?
If you do not believe in God, fine, If you want the answer to the question of balance, you still need to look at the whole picture, Why would you trust someone that does not even know about the aspects I mention here, and if they do, why are they not way out in front forecasting events like this?
Above all if its important to you , search. Its a great big wonderful world out there and the information is out there, While I started with the Moody Blues a Question of Balanace I will end with a quote from their song “The Voice”
“Understand the voice within”… it is the way to find the answer to the Question of Balance.