The Evolution of this forecast started in May.
On July 7th, a summation of what we were looking at for this winter was posted. Since many in mid-summer are not looking at these things (or since many new subscribers are coming on now), this is the kind of update we are trying to give you based on research I have been doing for many years, since hurricanes started hitting the US Again. So, I want people to know some things, though the full story is a lengthy one. If one is going to be wrong, at least anyone watching can see what has happened to arrive here. If right then the remarkable stretch of cold Mays, high impact hurricane season, warm Sept/Oct, then the turn to cold for the front part of the heating degree day (HDD) season can be seen, this would make 15 out of 15. Conversely, 10 warm Mays have low impact ( 2 majors in 10 samples), and the warm Start would work— both the analog and antilog would line up.
So, a rehash below is needed for those who have not seen it (see article on July 7th from Weatherbell.com):
“Think of your favorite Man-Made Global Warming Scientist.
Now, what if that person put out research that had 20 Major hurricane hits preceded by a cold May for the eastern US, and then a cold December that looked like the Mays?
Imagine if that scientist reveals this research (by the way, that in itself is a long shot since you have to forecast all the time and be looking for ideas that are not obvious, which is what forecasting actually does if you do it long enough).
Mays with high impact hurricane season following them:
.png)
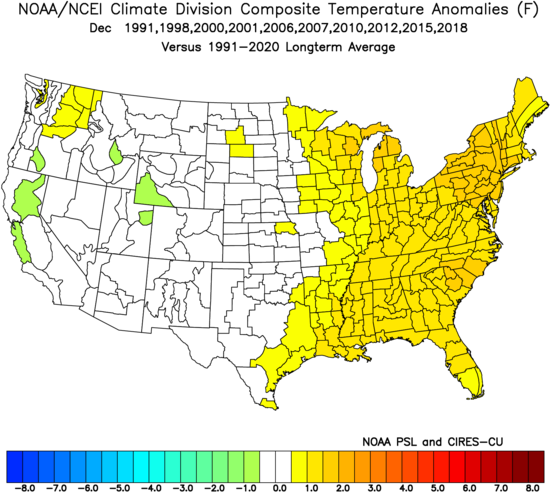
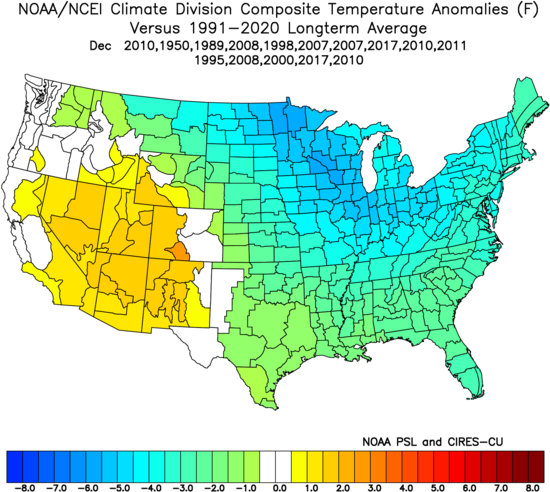
Widespread cold right? Now look at the following Decembers:
.png)
Widespread cold.
Following winters:
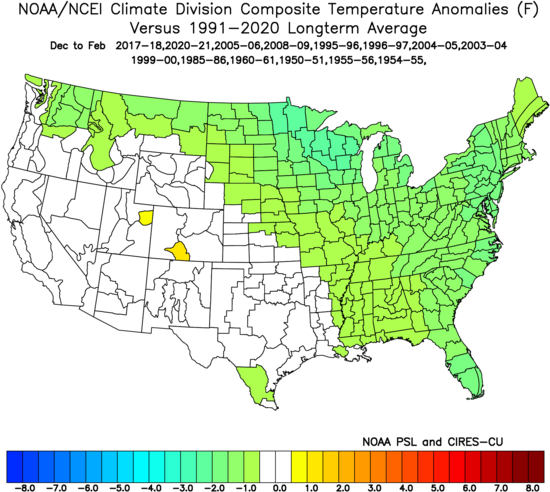
So a cold May (most likely due to high amplitude spring Madden-Julian Oscillation (MJO) trending toward phases 8,1,2,3), then big hurricane season, then a cold December and colder than average winter—which of course a lot of companies would love to know.
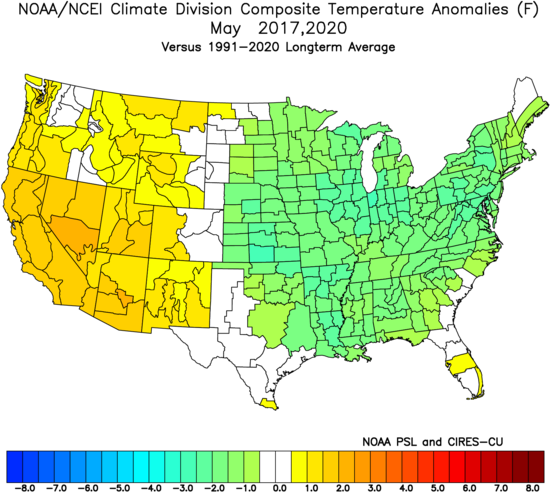
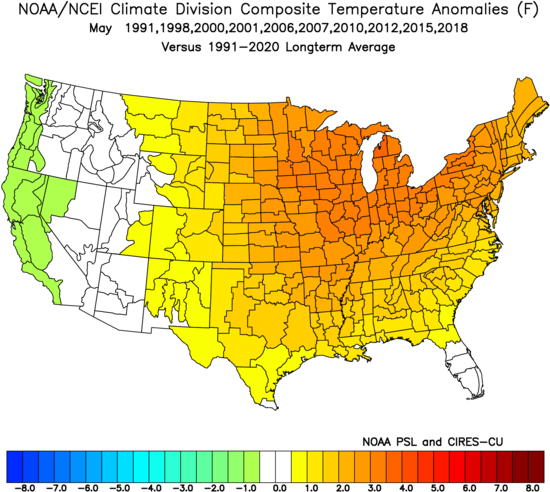
Now check out this May:
.png)
Widespread cool.
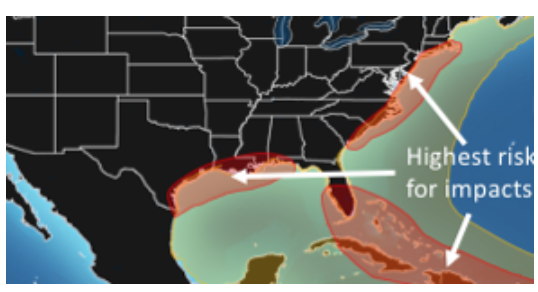
The Weahterbell.com forecast this year already has had 3 storms, though minor, move through the highest impact area relative to averages:
.png)
Already, the preseason idea is starting to show it has merit.
Now check out the coupled forecast system model (CFSV2). Like most models, it cant’ really see cool in the longer term anymore, but hints at where normal is.
For December:
.gif)
The hypothesis is that the pattern that leads to a cold May (most likely the active spring MJO) continuing as it is, has a natural evolution higher than average US landfills. That in turn is a signal for a colder start to winter over the east.
Last year we had this in December. There is the cool admittedly in the southeast, but still there (looked more el nino-ish):
.png)
2017:
.png)
What did those Mays look like?:
And let’s remember what our impact forecast looked like last year:
And then the nice postseason National Oceanic and Atmospheric Administration (NOAA) warning chart that showed how close we were:
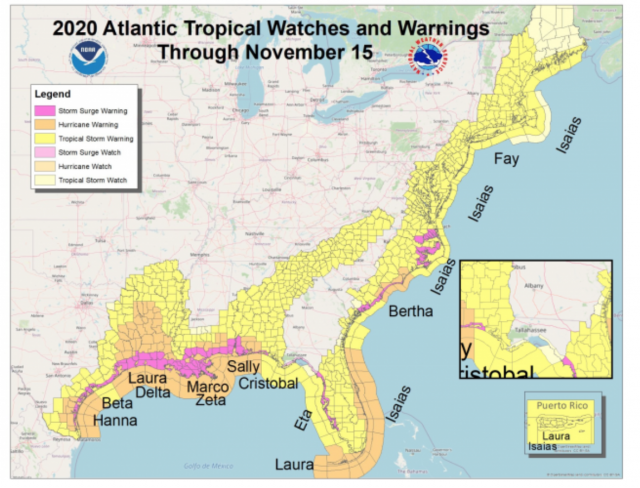
In any case, 14 cold Mays, the following hurricane seasons, December and winter, all show strong linkage.
In those 14 seasons, 20 Major hurricanes hit the US and December had a lot of cold in at least a part of the eastern US. More importantly, the entire winter tended to turn out cold. So the implication are, if you nail the cold May and then the high impact season behind it, you have a tool that can see almost 9 months down the road for winter. How does that happen? The global pattern that sets up that kind of a cold May can indicate that the big impact season is coming (this has been discussed in our preseason hurricane forecasts) and then left to its own accord—if it is moving along naturally, the result is the colder look for winter.
Now look at these Warm Mays (which would be the antilog). We have 10 samples:
ONLY 2 Major hurricane hits in 10 samples. So the cold May sample is about 1.3 majors a year, while the warm May sample is only 0.2 major hits per year. That is a huge difference. In addition, the magnitude of the difference indicates greater skill! But, check the following Decembers:
And then the winters that followed:
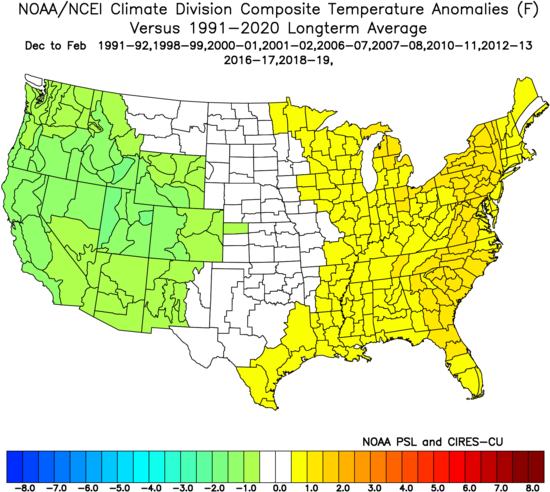
I believe this is too strong a correlation to ignore.
So think about this: None of this will see the light of day because of the source. Sure. You see it. And if I send it to a blog, then their readers will see it, but something like this (which could be a fascinating tool that shows some linkage) will not. But, you can be darn sure if it was someone that was in the hierarchy of anthropogenic global warming (AGW), and then somehow said it’s because of man-made warming, well guess what—that would have a better chance than right now.
However, do not think that I am upset. In the end, if I am who I say I am, then I have to work in front of the good Lord. And the best way to do that is to be right and to be happy, no matter who sees it or if seeing it, raises curiosity. This then gets the reader to think, ‘wow this guy takes it to the limits to get an answer.’
An answer that is not always right if the natural progression changes, but if the link of the progression of the pattern from the cold Mays, to the hurricane season (and then they continue along that line), we then have a good idea of where the winter is going.
Why can this possibly have any merit? Because the large-scale feedback of the atmosphere over long time scales, sets in-motion action and reaction that may indeed be more obvious due to the distorted warming, and increased water vapor. Though, this would take a lot of research. In what we do, we real-time test our ideas for you to see. However, if I was at a university, I could see the way something like this could fund a grad student or two’s master thesis. And guess what , I suspect the MJO amplitude in the spring is involved (another sorely needed subject for research).
For now, I can only wonder, ‘if I were a prominent Man-Made warming person would something like this get attention?’
Then again, it is longer than a sound bite, so maybe not.”
The only part was the lack of Hurricane impact on the US coast. Then again the early season feature brought tropical storm conditions to the NC coast and what just happened recently did more damage to the Cape than any storm including the perfect storm and Dec 23 1994 noreaster, since Bob.
So lets go now to the front part NDJ
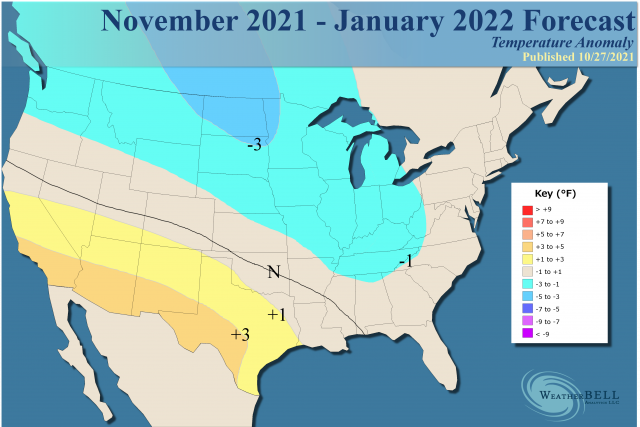
October 27, 2021
Winter pattern Hypothesis (updated)
The established major warmth over central North America to start October has been undercut as we thought as the jet in the Pacific is slamming into the Northwest. Then, it will send energy into the southern Plains. We did not see a named tropical storm but what is slamming New England is an example of what that warm water can do. Since the northwestern Atlantic is so warm, it is more than happy to contribute to the ridging. So this will continue to work its way to the northeast, and once over northeastern Canada and Greenland, the trough can run rampant underneath. Then whether cold air can be delivered over the U.S. becomes a matter or source-regions of the air masses. The threat of early severe cold relative to averages remains and we are pointing at the Thanksgiving to New Years’ period as the coldest of what is now a more obvious forecasted colder turn starting.
However, as this process continues, the combination of the MJO likely advancing and feedback that occurs in the subtropics as the jet strengthens over the southeastern U.S. will start forcing the Southeast ridge to appear. Then it will become a fight between that and the cold air that can drain into the U.S. and push.
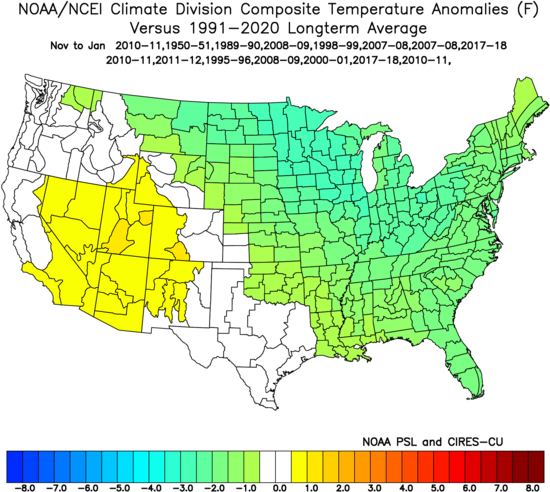
The new analog pattern is from the team. It has many of the long terms ones we have had, but others have been added as members of the team contribute extra flavoring to the brew. So given supply situations, it is a winter where weather may be ultra-important. Unless you get a total breakdown as we saw in the 1989 and 1950 cold starts there will be enough demand to warrant plenty of concern. Even as 2018 fell apart, December of that year and 2017-18 found the MJO stuck in Phase 7 in February before the wild March comeback. God help us all if we ever run a winter coast to coast (November-March). The last one really was 2013-2014 and before that 1995-96 as they were more common before the Atlantic warmed. Though there have been no hurricane hits in October, this Nor’easter certainly means something and there could still be a development in November. That being said, the ACE index for October globally is near the 2008 analog season and that year saw almost no action in October. In any case, the modeling is trending colder and headed toward our idea.
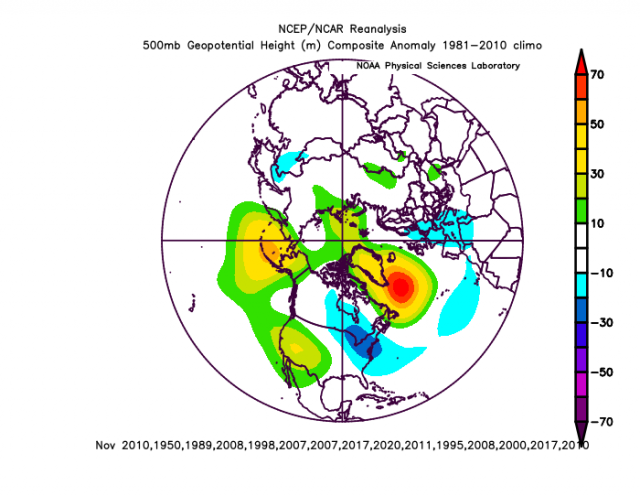
Analog composite:
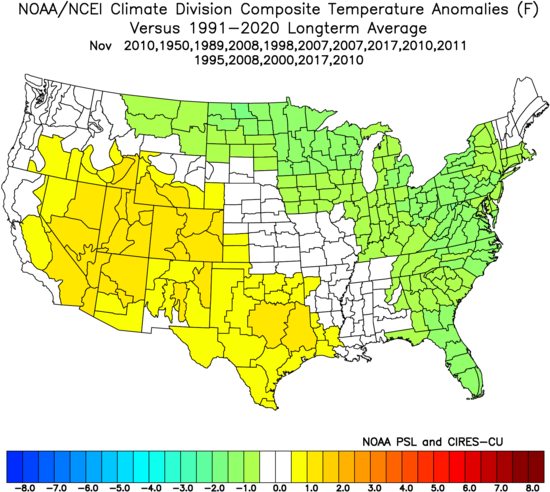
November
So November was made a bit cooler. The analogs are now completely a team effort all of us in there. Mine carried us to this point, now its time to bring in other big guns
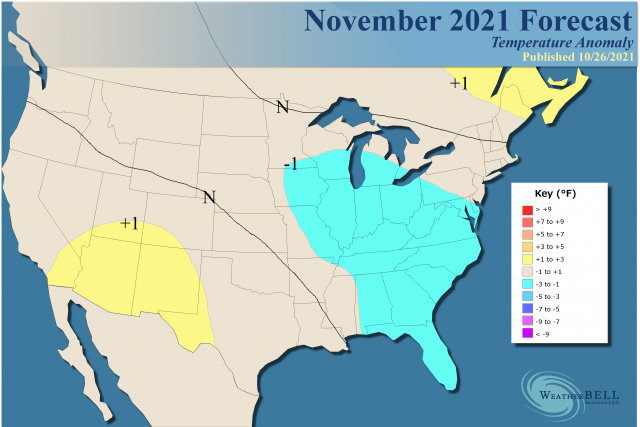
You see the hole starting to open in the East. The trick then in November is the timing of a flip. In 1950 it was dramatic and severe.
The Euro for the 30-day period for November:
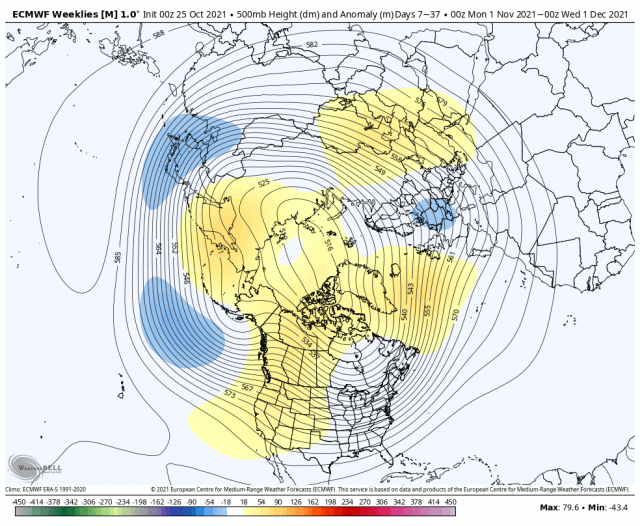
This obviously could be colder, as we have the inverted horseshoe developing over the top. The analog blend that leads to the temperature map above is quite similar overall:
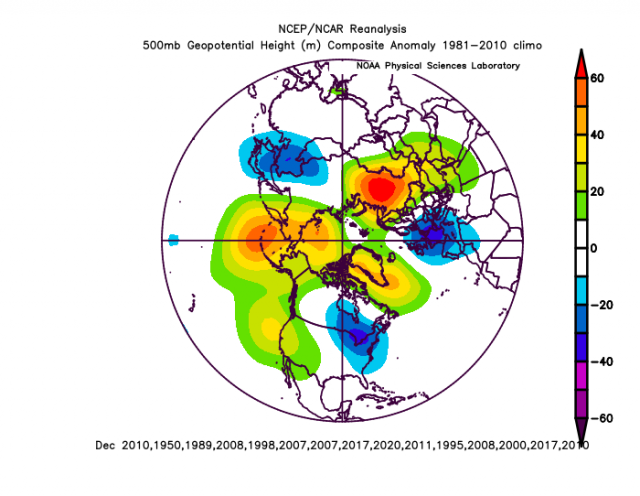
December
For December, we really expanded the forecast range, as the new analogs have a wider spread based on the timing of the cold push(es).
500 mb analog below the temp map
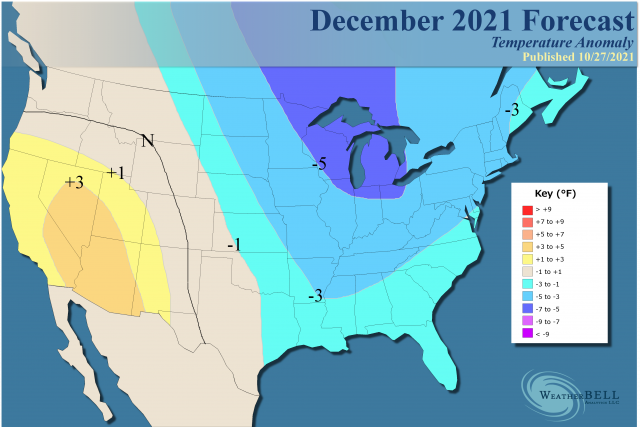
Temperatures:
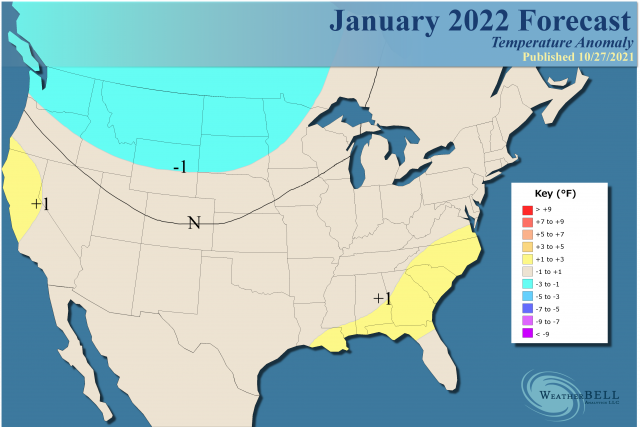
January
May start very cold but I expect some relief to show
Analog:
Joe D’Aleo, the Moses of Meteorology, weighs in with his work on spot-checking outstanding areas of warm and cold SSTs and their correlations to North America.
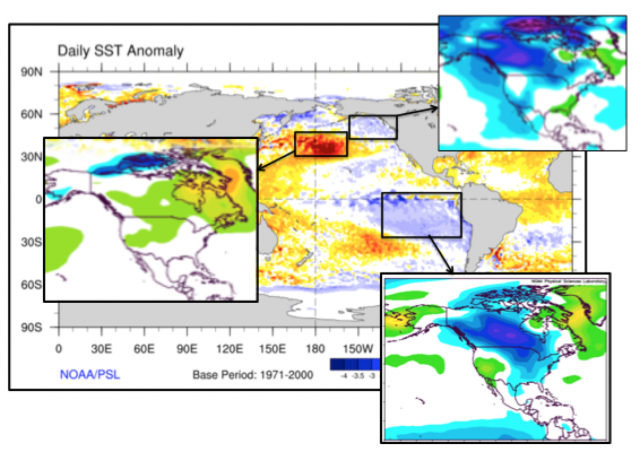
The warm spot in the Pacific favors a widespread normal to above normal early winter with some semblance of cool air in the Southeast. The cold northeastern Pacific would have much of western North America (especially Canada) cold, and this is where I think mid and late winter will go. The cool southeastern Pacific is favorable for what we have been saying for the start of winter, but the theory is the dominating La Niña signal with a colder central than eastern Pacific will lead to a northeastern Pacific cold pattern taking over.
The QBO:
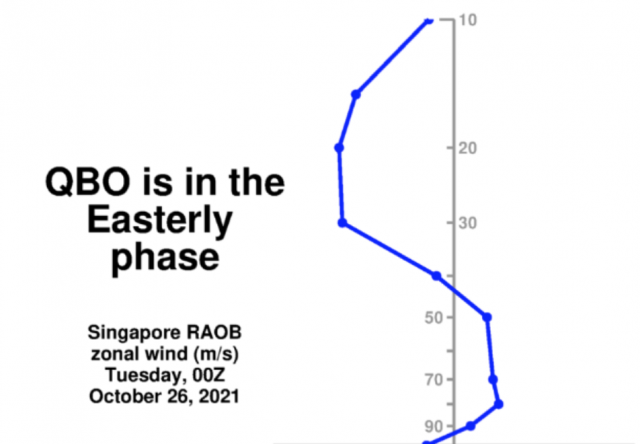
You can see that phase of the QBO favors a colder pattern:
So we have contradictions and that means a lot of big challenges.
latest Euro 10mb and the GEFSextended show another major strat warm loading up for December
The Verdict
The turn to a colder pattern we have outlined has begun, and assuming this works out to the degree our forecast has it will add another year to the analog package of a high amplitude MJO in the spring, the cold May, the high impact hurricane season, and then a cold start to the winter. However, keep in mind that the signal diverges after that.
The team-based analogs show that independently. We arrive at the overall same idea, but the big divergence occurs in the middle and latter part of the winter, with a spread ranging from years like 1951,1989, 1999, and 2012, with a blowtorch to some that remained quite cold. December looks like the coldest of the three months, with a break starting in January. The threat of renewed blocking would thwart that of course. Even with a western trough, the severe cold will be at the gate and ready to push at a moment’s notice. This sets up quite a battle zone and the big question is where that will line up, as in that area it’s going to be quite wet, snowy, and stormy, and to the northwest of it frigid. Snow getting put down will of course grow more important each day as the days become shorter.
Winter Seasonal including snowfall
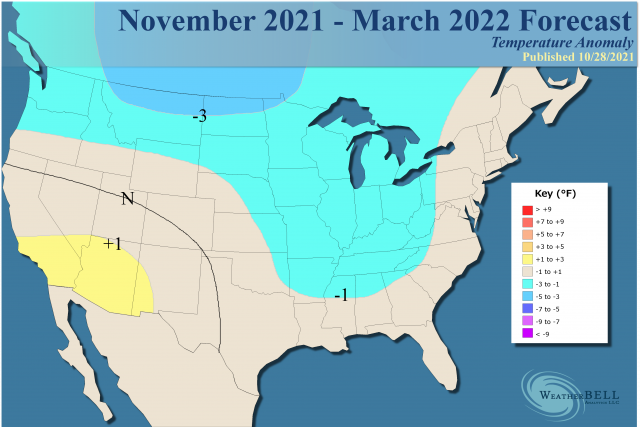
October 28, 2021
- We have made the forecast a bit colder than the first two issuances.
- The expected fast start to winter from the Plains eastward will happen as outlined.
- There is strong analog support from models through mid-winter.
- Overall the coldest weather should be centered on the northern Plains and Canadian Prairies with intrusions farther to the south and east.
The snowfall map remains the same:
.png)
The implications to the nation with the supply chain problems, the increasing energy shortage, handcuffing of traditional sources (sorry, say what you want), and etc. should be obvious. If the winters get worse than years 2013-2014, it will indeed be a long, and in some places at times, a dark winter.