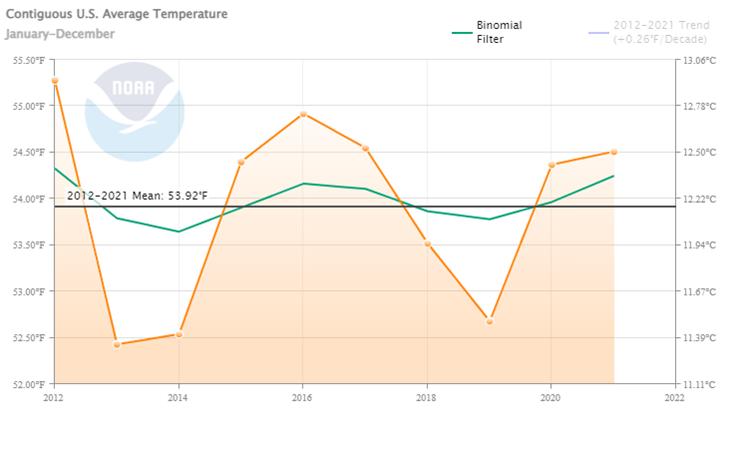
The National Oceanic and Atmospheric Administration (NOAA) is the official government record keeper of temperature and rainfall. Comparing the decade beginning in 1912 to the decade beginning 2012 shows a nearly six times faster increase in temperature for the earlier decade.
Below are the graphs of each decade. They are the monthly temperature graphs from NOAA, accessed 3/23/22. When accessed is important because NOAA has the habit of changing temperature records. Interestingly, always cooling the past or warming the present.
Here is an example.

The NOAA unadjusted data (dotted line) versus the adjusted data (red line). Berkely Earth (blue line) is pretty close, but different to the NOAA adjusted data. Why do they adjust the data? They have never explained it.
It would make far more sense, if you were adjusting data fairly without bias, to warm the past a bit or cool the present. At least at certain record stations. Why? Because of the Urban Heat Island effect (UHI).
The urban heat island effect is well documented. It is the fact that cities and even suburbs are warmer than forests or farm fields. Buildings, blacktop and concrete all radiate heat and warm the area they are in. This is a very real man-made contribution to our gently warming earth.
There are temperature stations that used to be in a farm field and are now in a black top parking lot. Rather than move the stations to a nearby locations, NOAA continues to use the data. A thoughtful person would say these stations are compromised and the data should be discarded. But that isn’t what NOAA is doing. In addition, they adjust the data.
The unadjusted data reflects more accurately the warm and dry decade of the 1930s, when we had the dust bowl. We know it was hotter in the 1930s because so many all time heat records were set then.
The unadjusted data also reflects the cooling from the 1940s to the 1970s. In fact, during the 1970s many experts were warning us that there would be a coming ice age and it would be a catastrophe. Just like they are warning us now of the coming heat catastrophes.
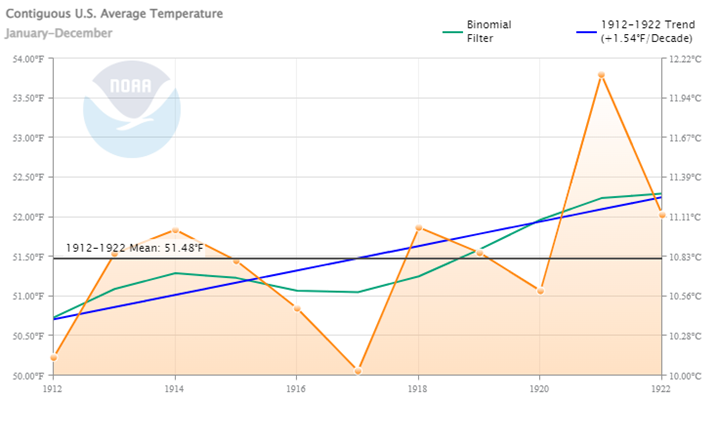
In the most recent decade, temperatures increased by about 0.26°F (0.14°C). In the decade 100 years ago, the temperatures increased a whopping 1.54°F (0.85°C). This was the warming trend leading up to the warm 1930s.
Weather and climate have always changed since the beginning of time. And weather and climate always will change, whether we like it or not. No matter what we do, the weather and climate will always change.
We have been in a gently warming cycle since about 1850. Which was the end of the Little Ice Age. Also known as preindustrial times. Carbon dioxide in the air only really reached levels that would affect the climate significantly around 1960.
The earth was warming for about 110 years without the help of all that additional plant food, carbon dioxide. As far as I know there have been no scientists that can explain the warming or cooling in the past 10,000 years. The earth has experienced warming and cooling many times.