Despite the dreaded “polar amplification” and 1,000 new coal fired plants in China, apparently the fragile Antarctic ice shelves have barely changed in the last 40 years. Indeed, instead of fragmenting, they are melting slightly slower now than they were in 1980. Naturally, the researchers *know*, as only high priests can, that things will change any day now. The tipping point is just around the corner, hiding, ready to pounce.
Mankind has emitted fully 65% of our total carbon emissions since the year 1980 — and yet it has not done much at all to the melt-rate of the ice shelves of Antarctica. In fact, if anything, climate change is slowing the ice melting.
That’s 1.1 Trillion tonnes of man-made CO2, and no catastrophe to show for it.
The new study by Banwell et al used satellite microwave data and modeling of meltwater.
Note that the “small but significant decrease” in melting gets headlined as “a minor change”. Since when where significant warming trends reported as just a “minor change” of indeterminate direction?
Antarctic ice shelves experienced only minor changes in surface melt since 1980, study finds
The results show Antarctic ice shelves overall have seen only minor changes in surface melt rates over the past 40 years, and the modeling results even show a small but significant decrease in melt rates during the study period.
The findings appear to be good news for the Antarctic region, but the researchers caution that they do expect Antarctic ice shelves to see higher surface melt in the coming decades.
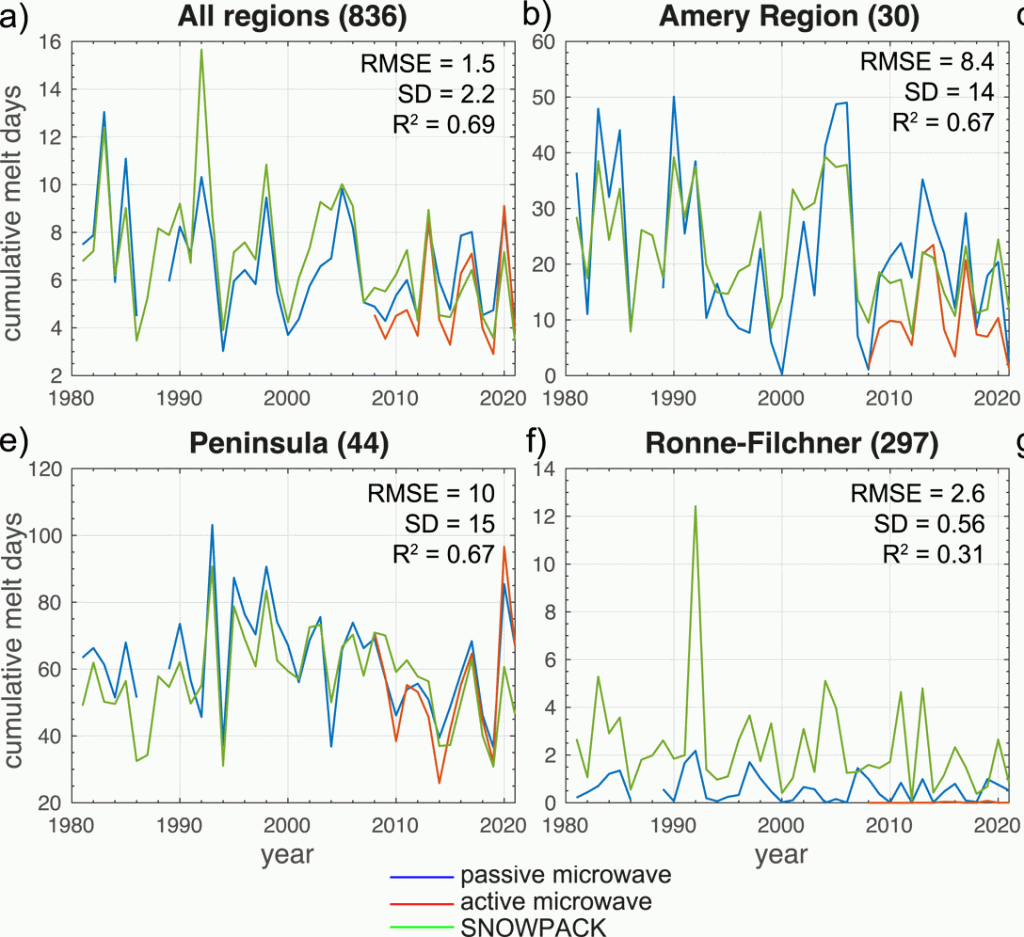
Not to put too fine a point on it, but the “small but significant” decrease in melt rates is visible to the naked eye.
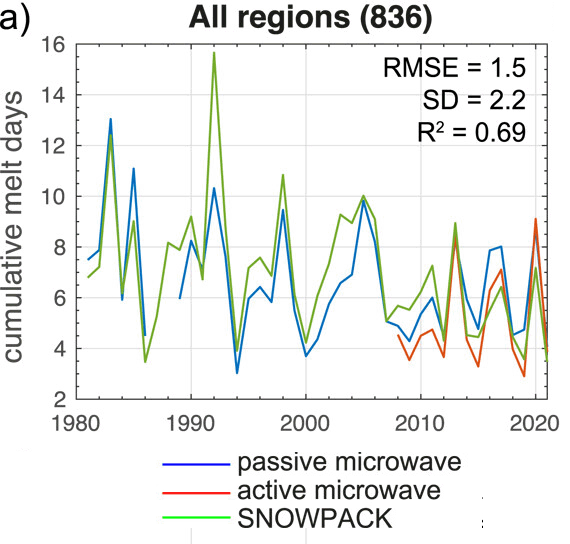
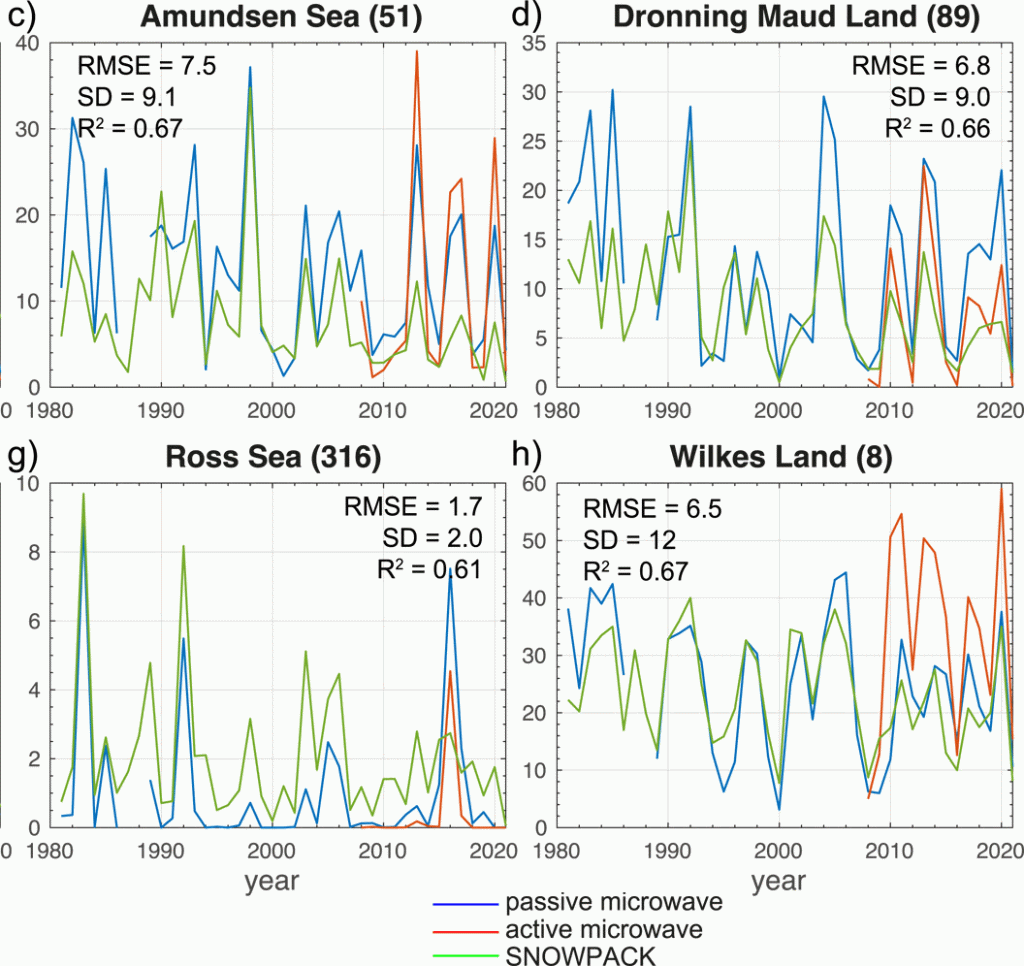
Timeseries of observed and modeled melt days. All ice shelf regions in Antarctica. –Banwell
Since 1998 the Antarctic ice shelves have had cooler mean summer temperatures and lower meltwater volume. Which climate models predicted this?
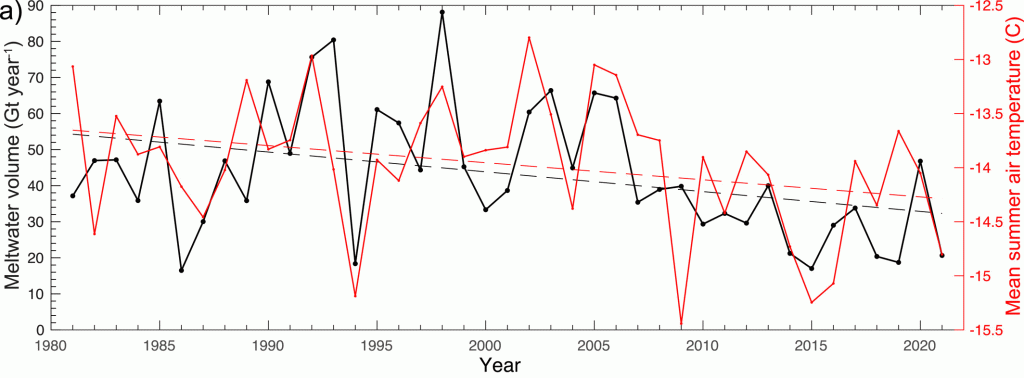
Figure 4. Modeled meltwater production volume. (a) Modeled annual meltwater volume (Gt yr−1) over all ice shelves (black line, left y-axis) and Modern-Era Retrospective analysis for Research and Applications Version 2 mean summer (November 1 to March 31) air temperature over all ice shelves (red solid line, right y-axis). Banwell
Feel the faith of the research team — “it just hasn’t kicked off yet”.
“As air temperatures increase over the coming decades, we’re expecting a real increase in these surface melt rates up until the end of the century,” Banwell said. “So although we haven’t seen much change in melt rates yet, we will see that to come. It just hasn’t really kicked off yet.”
If Antarctic ice shelves were melting faster we would have seen headlines every year. Indeed we got them anyway — from August 2022 — “Antarctica’s Ice Shelves Could be Melting Faster than We Thought.” That was Caltech, which modeled the effects of a small current running counterclockwise around Antarctica and predicted the ice sheets were melting more than the great climate models thought they would.
When will “The Team” admit they were wrong?
These are not the graphs of the Antarctic tipping point we were told to expect.
…
REFERENCE
Alison F. Banwell et al, Quantifying Antarctic‐Wide Ice‐Shelf Surface Melt Volume Using Microwave and Firn Model Data: 1980 to 2021, Geophysical Research Letters (2023). DOI: 10.1029/2023GL102744
This article originally appeared at JoNova
