Despite twenty years of media stories telling us how every rain-bomb was “climate change”, a new satellite study of rainfall suggests that during the last 20 years, the intensity of rainfall has mysteriously declined a little in most places. This is despite predictions it would increase, and CO2 itself rising by 41ppm globally during the same period. In terms of total emissions released by humans since the stone age, it’s been a bonanza — in this 20-year period, we emitted 38% of all the emissions we ever emitted.
So humans put out 656,000 Mt of CO2, and there’s been either a decline or no trend at all in rainfall intensity.
Is 38% of all human CO2 emissions enough of a test? The satellites cover all the Earth, including the oceans, which the met bureau gauges don’t.
Thanks to Kenneth Richards at NoTricksZone for finding this paper:
New Study: 21st Century Precipitation Trends Have Become Less Intense Globally
Hydrological processes were expected to intensify with warming. The opposite has happened.
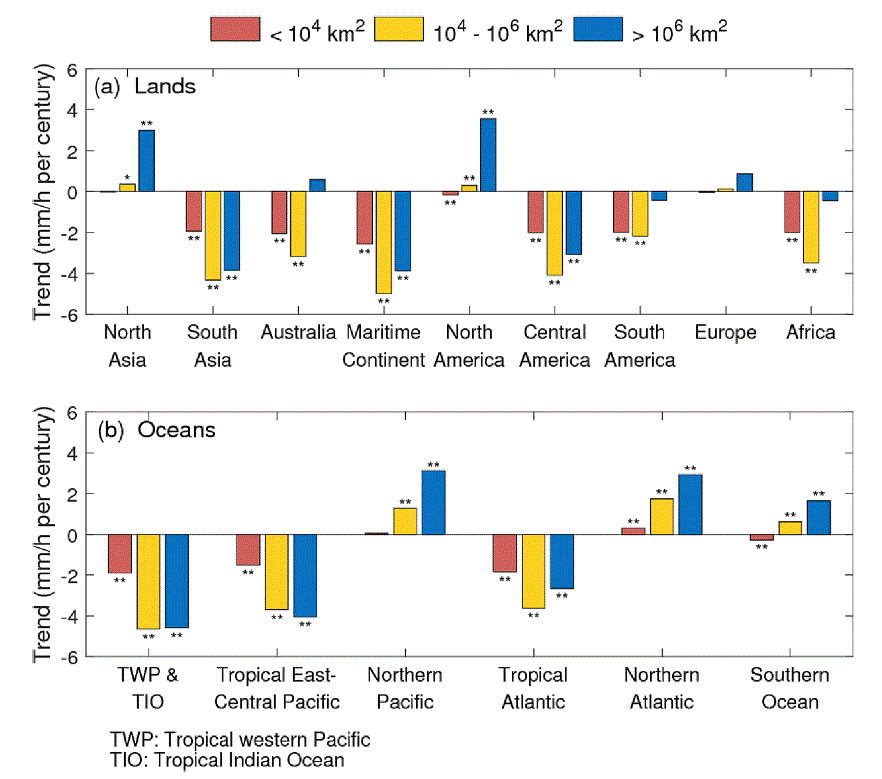
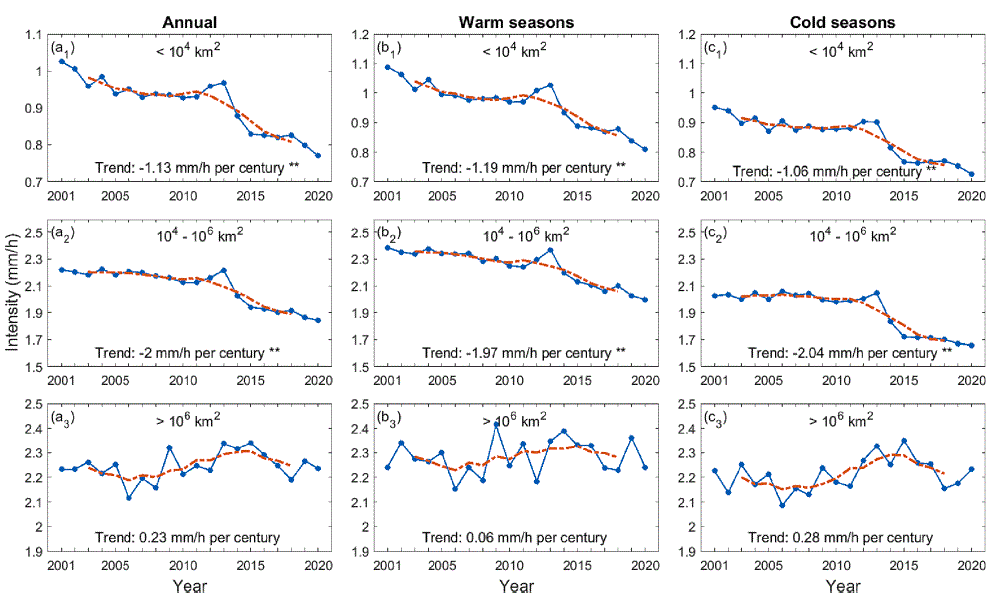
Nearly every which way we look at it, across the year, on different continents in different seasons, rainfall intensity is not getting worse. Small and medium size “precipitation systems” (red and yellow) have reduced in intensity in summer and winter and all over the globe. More widespread systems (green) are a wash with some up and some down, and none of it in a pattern that climate models predicted.
Fig. 9. Trends (unit: mm/h per century) of the mean core-region precipitation intensity of precipitation systems categorized by different precipitation system sizes at the annual timescale in (a) nine continental regions and (b) six oceanic regions during the 2001–2020 period. * and ** denote the 0.1 and 0.05 significance levels, respectively.
This is really quite complete. Small and medium size “precipitation systems” have reduced in intensity in summer and winter and all over the globe. And larger weather systems have “done nothing much”.
Fig. 8. Time series of the mean core-region precipitation intensity (in blue) of precipitation systems categorized by different precipitation system sizes (a1-3) at the annual scale and in (b1-3) warm seasons and (c1-3) cold seasons during the 2001–2020 period. The mean core-region precipitation intensity is calculated by the mean values of all the precipitation systems with different sizes during the study period. The 5-year moving average (in red) is also shown. Trends are calculated and shown, and * and ** denote the 0.1 and 0.05 significance levels, respectively.
And if there is a climate change signal hidden under a declining natural trend, the problem is that those other mysterious forces are more powerful than CO2, yet we have no idea what they are or how to predict them. Call it climate poker. Would you like to bet your national economy on these models?
This well-established theory is going swimmingly.
The UN experts are certain that rain will become more intense over most land regions. Listen to the peer-reviewed science. It’s all simple really…
ScienceBrief Review: Climate change increases extreme rainfall and the chance of floods
Theory
It is well established that the frequency and intensity of extreme rainfall increase more strongly with global mean surface temperature than does mean rainfall (Berg et al., 2013; Myhre et al., 2019) as the latter is limited by evaporation, whilst changes in extremes are also affected by local in-storm processes. In simple terms, warmer air can hold more water vapour that can subsequently fall as rain. For each degree of warming, the air’s capacity for atmospheric water vapour increases at about +6% to +7% per degree of warming, assuming other atmospheric conditions remain roughly constant, known as Clausius-Clapeyron scaling (Allan et al., 2014). A warming atmosphere with more moisture can therefore produce more intense rainfall events, with this scaling providing a first approximation (Fowler et al., 2021a)…
Future projections
Relatively coarse-scale global climate models show future increases in daily rainfall extremes over most land regions with warming (Seneviratne & Hauser, 2020; Coppola et al., 2021a)….
This ScienceBrief Review is consistent with the IPCC Special Report on 1.5 degrees (2018) Chapter 3 and Special Report on Climate Change and Land (2019) Chapter 4, both of which noted that human-induced global warming has already caused observed increases in frequency, intensity and/or amount of extreme rainfall in several regions.
There’s a consensus — it can’t be wrong.
The numbers:
Man-made CO2 emissions: By 2001, humans had cumulatively produced 291,000 Mt of carbon from fossil fuels, and cement production, but by 2020 our total cumulative emissions amounted to 470,000 Mt. (CDIAC data). So from 2001-2020, mankind produced 179,000 Mt of carbon or 38% of all-time homo sapiens emissions. Converting pure carbon to CO2 means humans have emitted 656,000 Mt of CO2 yet seen either a decline or no trend at all in rainfall intensity.
Global CO2 rose from 371ppm in 2001 all the way to 414ppm in 2020.
REFERENCES
Zhang, Yan, (2023) Climatology and changes in internal intensity distributions of global precipitation systems over 2001–2020 based on IMERG, Journal of Hydrology 620 (2023) 129386
CO2 levels at Mauna Loa
CO2 emissions: CDIAC
This article originally appeared at JoNova


