
Tropical cyclones have become a pawn in the man-made climate change game. If you ever want to gauge deception and ignorance as a metric, you can find it here. I aim to show the GLOBAL reality of this season in the tropics to counter the propaganda — sadly, on both sides, much more though on the alarmist side. President Trump did not stop the hurricanes this year, as I have seen in some social media comments. In this day and age, I can never tell who is kidding. And the lack of hurricane hits is no more a sign of climate change than years with multiple hits. I did not use “climate change” as a reason for the Dec. 7, 2023 forecast for a season from hell for the U.S. for 2024, nor was it used for this year’s much less forecast than last year (and of course it wound up well under even that idea).
First of all, and I reviewed this earlier, the centering of the ACTUAL HIGHEST ACE RELATIVE TO AVERAGE this year wound up about 350 miles east/northeast of what we had as our idea. I have stated that the whole numbers game adds up to nothing; it’s who gets hit that really counts. But the numbers game is what everyone focuses on. It’s like pickleball to real tennis to me. So, our impact forecast was overdone for the U.S., unlike last year, which was issued further out. The reason is simple. I thought the congregation of tracks would be further west. Even with that, the amount of damage from non-named storms and the ones offshore to the beaches was quite high. North Carolina had 16 houses fall into the sea. In 2011, when Category 2 Irene hit the NC coast, only six houses fell into the sea. So the unnamed storms, one of them that should have been named, did their dirty work this year
Of course, man-made climate change people would point to that as a sign they are right about sea-level rise. And the counter is that they all stayed out at sea, and if you build a house on a sandbar, there are bound to be problems.
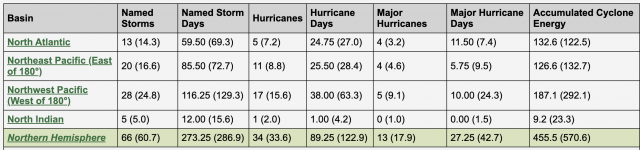
But look at this chart below and see how you can play the game. Skeptics can say, less than the average, all out at sea. Alarmists say more major hurricanes than average and higher than average ACE/storm. Which, by the way, is where we were in the 1950s, as ACE storm has fallen because we name so many storms now. ACE overall is above normal, but named storm days, hurricanes, and hurricane days are all below normal.
The charts below are National Hurricane Center/Joint Typhoon Warning Center data as tabulated by Colorado State University.
So you can play a game like this, one way or the other, and try to get sound bites. But in the end, it’s much ado about nothing. And the vast majority of the meteo media talks about the Atlantic and TRIES TO EQUATE THAT TO CLIMATE CHANGE; it’s the western Pacific that is the canary in the coal mine and gets no attention unless there is a super typhoon.
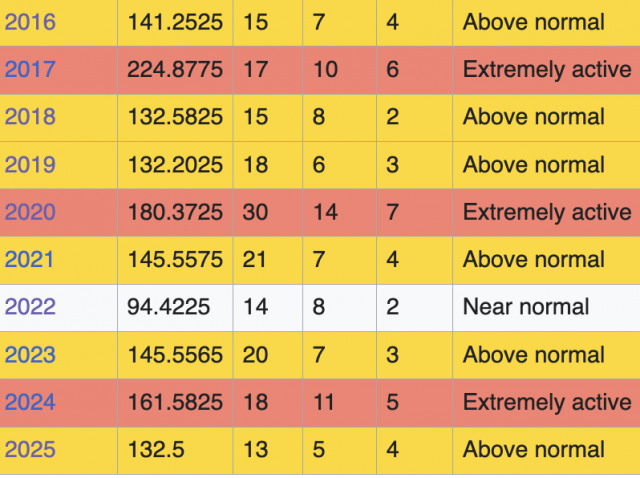
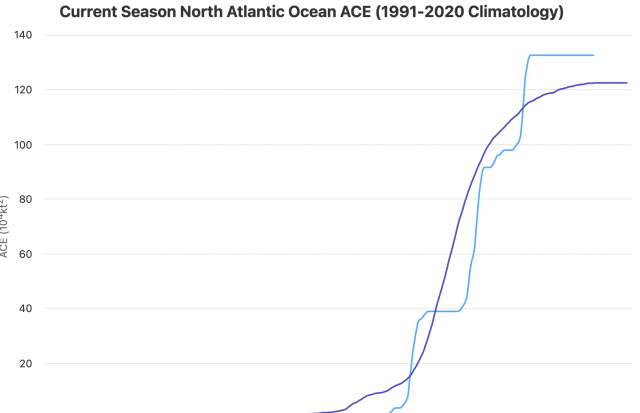
So when we look at the Atlantic with the highest 10-year period ACE index wise, it leads to the hysteria over climate change. The Atlantic ACE averages 122.5 per year, so this is an impressive stat as a stand-alone. Problem is, the average ACE/storm is over 2 per storm under the 1950s, which means the average storm is weaker. Fewer storms were named in the 1950s, but, on average, were stronger. So when a dime-sized feedback storm goes wild, the screams of “storms are getting stronger” should be muffled by a look at past years (and adapting our power and impact scale where size matters).
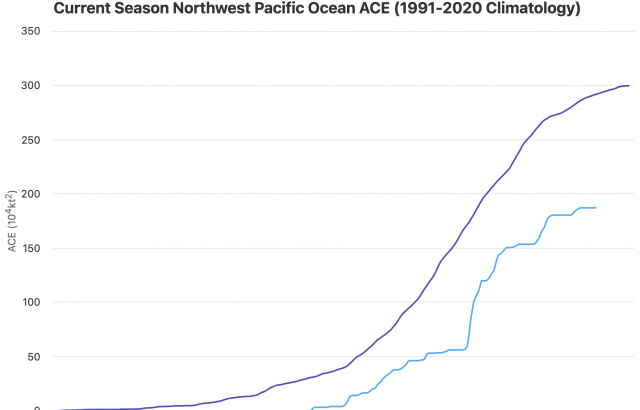
But look at the western Pacific in the 1950s, keeping in mind their average ACE is 2.5 times of the Atlantic:
.png)
That is nuts.
But look at the last 20 years:
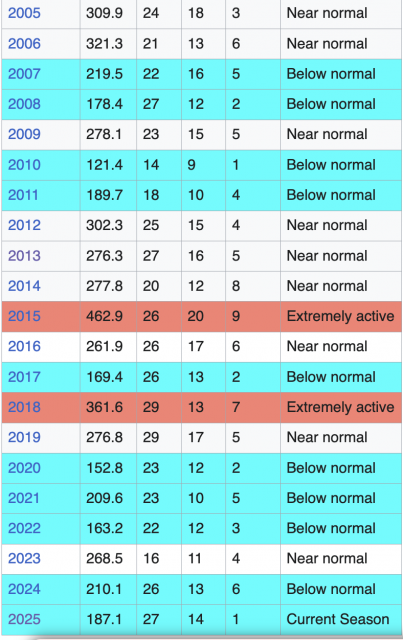
This is wild, and if you are trying to make some kind of climate statement, it should be heavily weighted on what is going on in the western Pacific. And it impacts global activity, so global activity is below normal.
The Atlantic was the only basin above average:
The west Pacific way below average:
And there you are, globally:
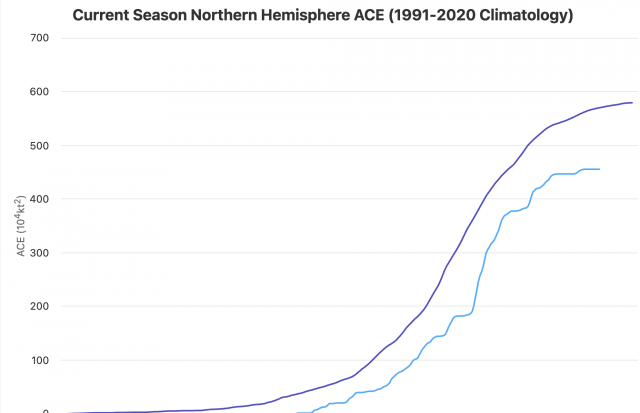
So all this hysteria about storms getting worse is cherry picking and not showing the big picture. Which is exactly what someone wanting to hide the whole truth would do. Besides, given the “we are the world” mentality that is prevalent in the climate community, is it not better that a more populated area of the planet is not being hit as badly?
But if you want to make a climate statement on tropical activity, it’s where the biggest, strongest storms are that should be front and center. The Atlantic, puny as it is compared to the western Pacific, is trying to take up the slack, but falls short.
There are reasons I have put forth involving the distorted warming spreading out energy, so there is less focusing of the energy in the tropics, leading to reduced upward motion (as shown by fewer clouds), but that is not what the mission of this blog is. It’s to point out that yelling, “No hits, Hoorah for my team,” and then someone saying, “More rapid feedback, see the world is going to hell in a handbasket,” is all trivializing the big picture, which I look at, since the Indo-Pacific is so important. There is no magic CO2 fairy in charge of all this. The actual result globally, as the world warms, is either no change or less. In the western Pacific, it’s down. In fact, way down. Combine that with no U.S. hits this year, and all I can say to the climate alarmists is, better luck next year (OH, wait, an El Niño is coming on… maybe the west Pacific will come up, and you get to use that).
The only way to rise above all this is to make sure if you love the weather, you enjoy the weather, cause it’s the only weather you’ve got.