I will be speaking at the Heartland Climate Conference in April and presenting a case study on how sudden warming from geothermal input can ruin a forecast. The name of the talk is going to be “A Weather/Climate Tomahawk Fight with Geronimo,” because that is exactly what this is, and there is no cavalry coming to solve the problem. Not only that, but frankly, no one in research on either side gives a darn about this, because they don’t forecast and have to tolerate it. Many meteorologists simply accept the model output, so I am on an island. AGW people would not want to see it in the first place, because it blows the whole CO2 argument out of the water, and people on my side don’t want to hear it because they sweep it away — as one person put it because it’s like “the input of a Bunsen burner at the bottom of a swimming pool.”
Well, there are estimated to be 10 million Bunsen Burners (the estimate of vents). Interesting, though, I certainly understand that if one is not involved in the application of what this does to the weather, one would be skeptical. I get it.
I have found that everyone is married to their own idea to solve a problem that, to me, is a simple equation: the sun, the oceans, stochastic events, and the very design of the system far outweigh any input man can put in.
So, my goal is to get some people to say, “Hey, this is the oldest global private-sector forecaster out there, who has produced a value-added product for his company every day since March 1, 2011 — maybe we should look at what he is saying.” So a dose of weather is coming at attendees, and then, the simple implication is that over the last 35 years, there have been countless hot spots showing up. Though they ebb and flow, overall, that input is what is raising the SST, and then, of course, the rest follows.
But, back to the case study.
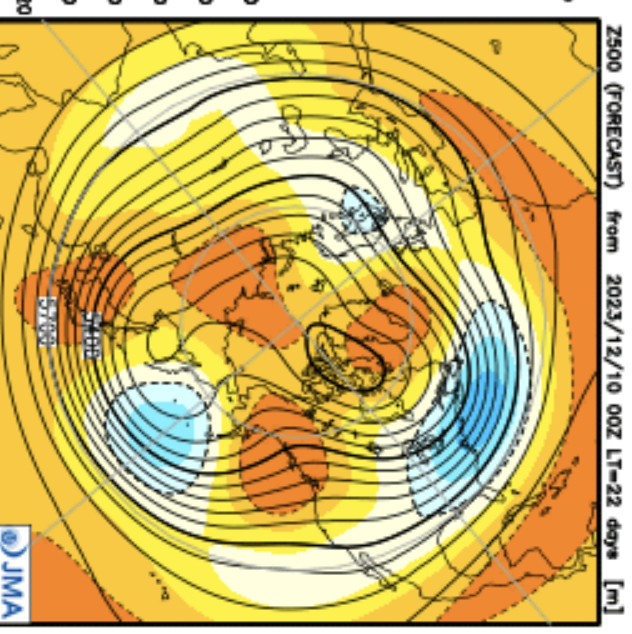
The European is going to be used here. By September, it has a borderline Super Nino developing.
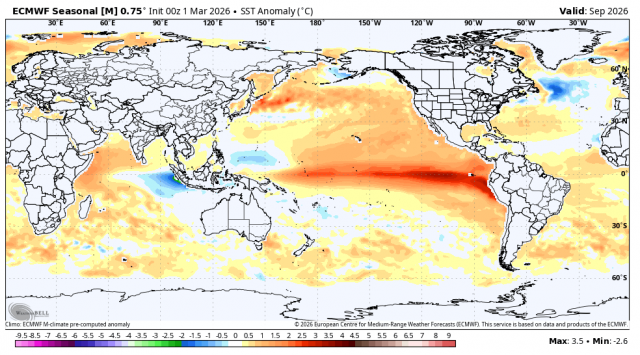
Far ahead of what it had with the strong Oceanic Niño Index El Niño it had in Sept 2023.
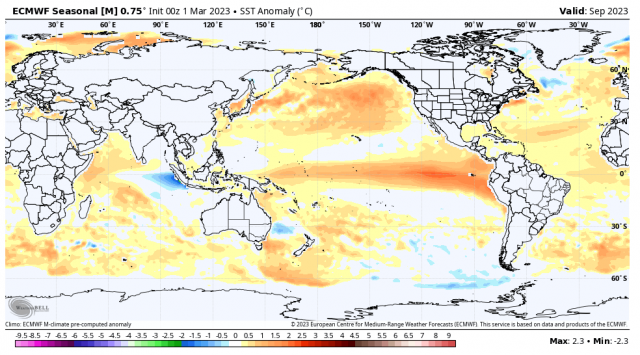
What is hugely different in the FORECAST is the Atlantic, which is heading for a negative AMO look, and that means that hurricane numbers I have out have to come down.
But notice where its forecast went in subsequent months.
.png)
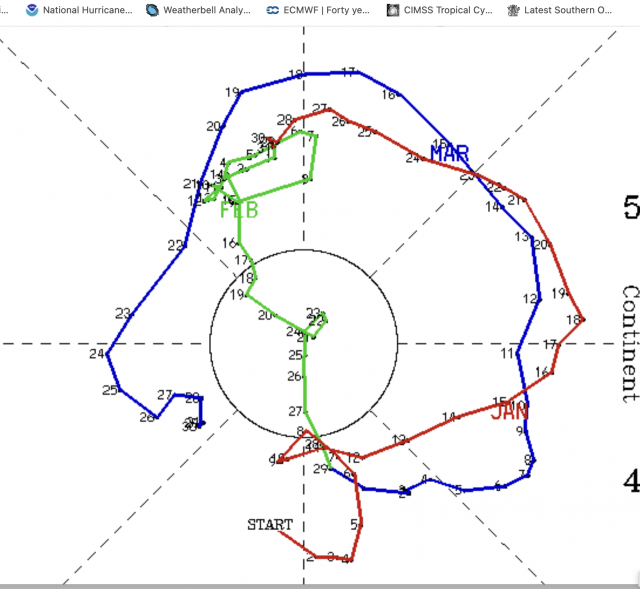
By November, it had the classic look of colder water to the northeast of Australia.
This has an impact on the MJO as cold water around Australia tends to blunt the MJO trying to move through the kiss of death for winter phases of the MJO, phases 4/5/6.
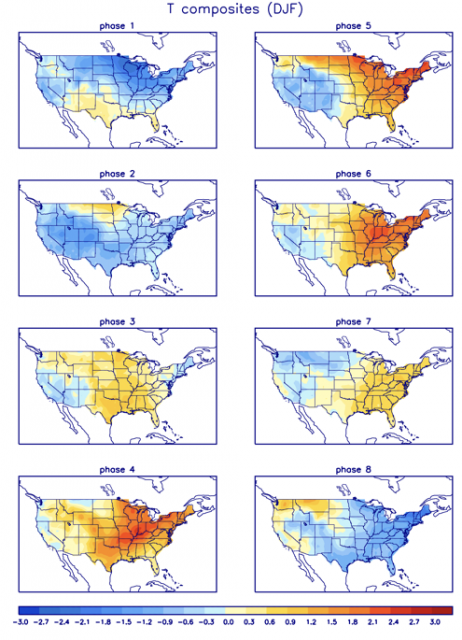
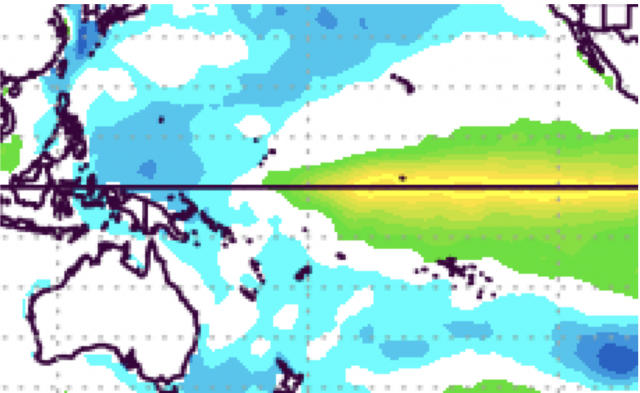
If we look at the MJO chart, we see the center of the strongest convection
.png)
moving through phases 4/5/6 sets off reactions that in turn impact the global pattern in a way that favors warm U.S. weather. The La Nina base state favors this most of the time, and it’s why many La Nina winters are warm in the eastern part of the country. When the water is cold, it suppresses convection there, so in November, this looked great for the winter. And models were not shy about it. They showed plenty of blocking and a pattern similar to some of the great winters of the 1970s.
While I have you here, it shows how absurd it is for the people pushing climate change to explain the buckling jet stream as we had in the extreme cold period in the east this winter, as being due to man-made warming.
It reveals the ignorance of past events. Blocking has always been with us. But the fact is, we are a 10-minute sound bite society, and so people will fall for it. And so the average person is open to accepting simplistic arguments to blame something driven by an agenda. As meteorologists, if we are going to push that, we should be ashamed of ourselves, FOR NOT SHOWING THE HISTORY OF THE PAST TO FRAME THE ENTIRE PICTURE. So how is it 2 of the greatest blocking winters ever occurred in a time when there was talk of another ice age coming?
BTW the La Niña and El Niño, because of the oceanic warming, are not what they used to be as far as reactions.. The surrounding oceans have changed so much that their impact is distorted. The aforementioned winter and case study, 23-24, did not even have the Southern Oscillation Index averaging out to an El Niño in the winter. It was there in November, but the sudden warming of the water to the east of Australia was unlike anything ever seen in an El Niño, and it impacted the SOI. Yet no one seems to care.
But let’s look at this and understand why this is so important
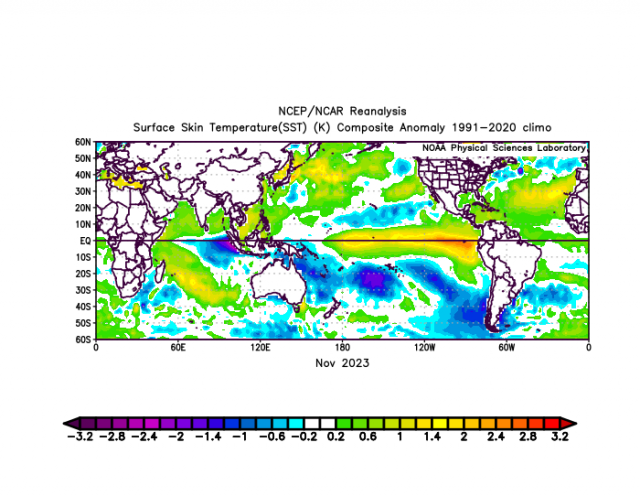
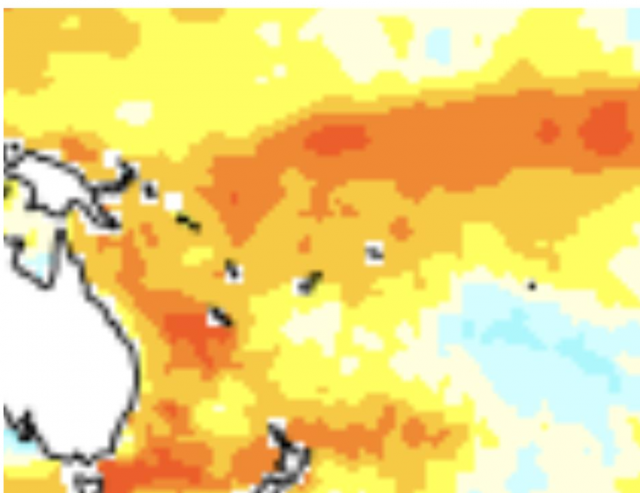
The SST in November was very cold around Australia. What does that do to the MJO? It SUPPRESSES convection in phases 4/5/6 as the greatest convergence is going to occur in the western Indian Ocean and northeast of Australia in a pattern like this.
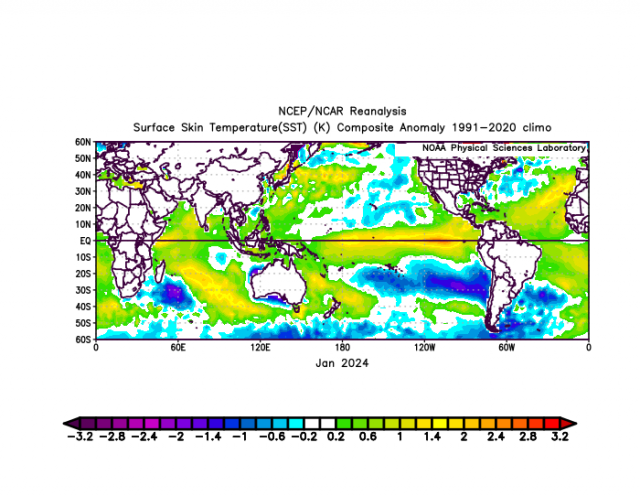
But look what happened
IT WARMED ALL OVER THE PLACE AROUND AUSTRALIA!
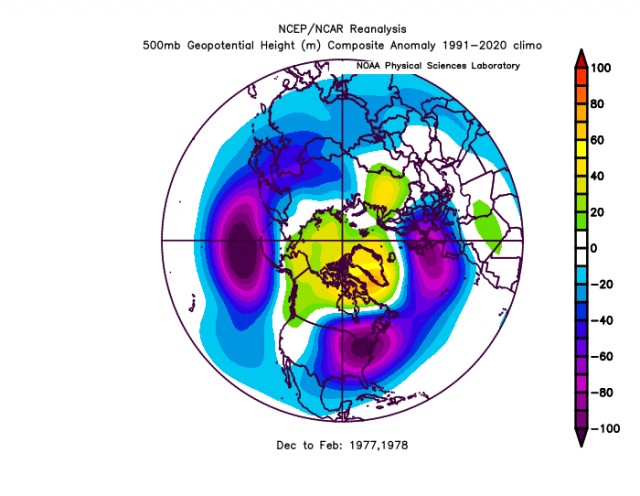
Here is the average of El Niños, with SST. Again, cold water around Australia. What happened here was unprecedented, a sudden winter warming
Look what happened
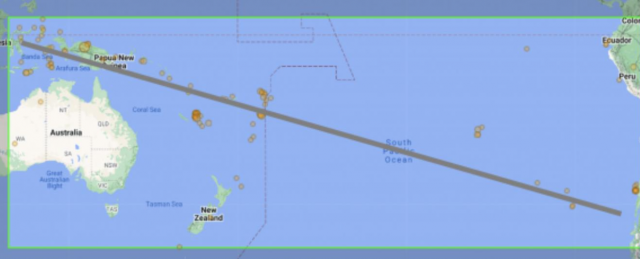
Here is the change in SST
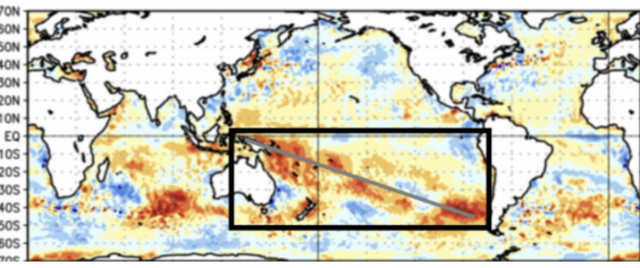
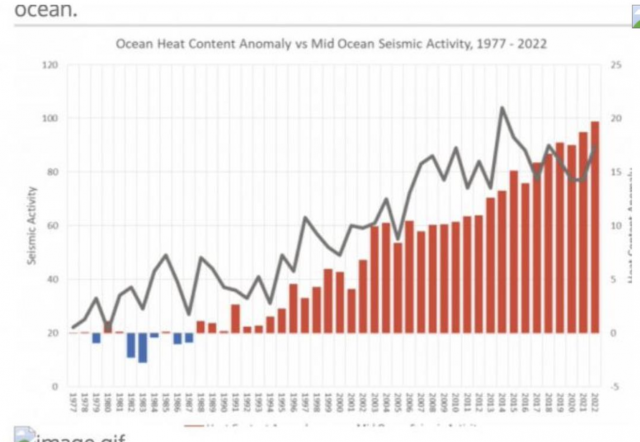
All the warming is away from the El Nino RIGHT OVER THE AXIS OF UNDERWATER VOLCANIC ACTIVITY, which we do not know about until after it happens. We suspect it’s going on when the water suddenly warms, but because of the terrible data gathering, it takes months for the data to come in.
How do you ignore this or think this is a Bunsen burner? Well, it’s a product of not having to actually forecast the weather. The sudden warming is Geronimo. The tomahawks are the input of warmth.
The entire weather/climate community has been duped into thinking that putting buoys that go down to 6,000 feet—once for every 100,000 square miles—is somehow enough data for the source of 99 percent of the heat available for the entire system.
So the argument is, “Joe, you have no proof.” No, I don’t—until I see the water warm like this, because it’s not the sun, it’s not CO2 that could have done that so fast and against all indications. But if someone is not looking at this, they simply dismiss it.
And what needs to be done—for all the money we have spent on climate change and weather forecasting—is to suck it up and saturate the bottom of the oceans where these things are going off, and actually go to the source region. But that would solve the problem.
As for those that dismiss it: well, you have no proof it’s not, because the data is not there to disprove it. So if you are not looking and you are married to one idea or one agenda, then you dismiss it.
BTW, this is nothing new
And by now you have to know that with the help of Dr. Arthur Viterito, the explanation for this kind of warming of the ocean since the late 1980s
.png)
.png)
Has to have a linkage to the increase in geothermal input, which preceded the rise in temperatures.
Put water vapor in the air, and guess what happens to the global temperature, which, by the way, is a horrible metric. Wet bulb temperatures and better still saturation mixing ratios are much better for quantifying and explaining the whys of the climate. But far be it from people pushing the global temperature almighty to go to the source, because it reveals it can’t be CO2 to any great degree.
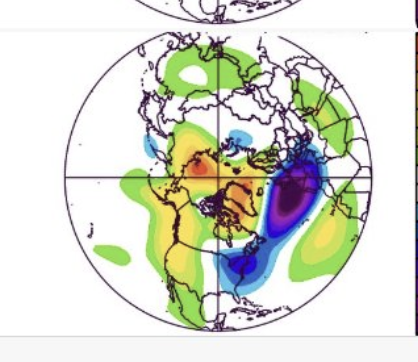
So what did the winter MJO do in 23-24? Just as cold air was trying to come in and did for a while in January, off it goes
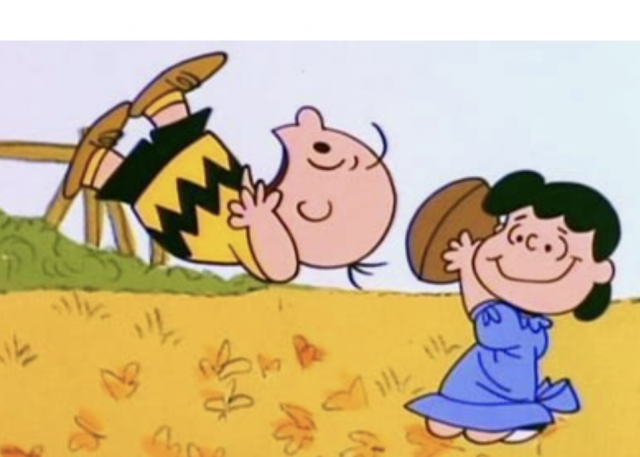
Lucy pulls the football away from Charlie Brown ( my forecast)
And you can kiss the winter goodbye mid Jan on
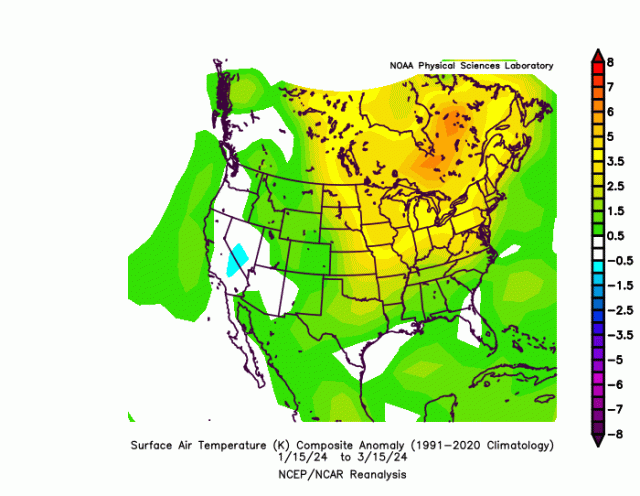
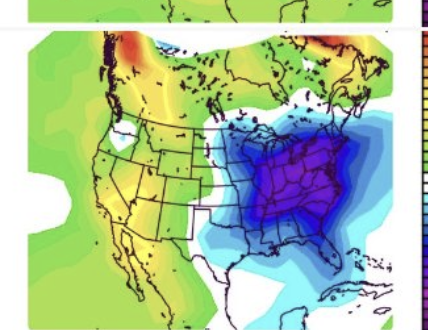
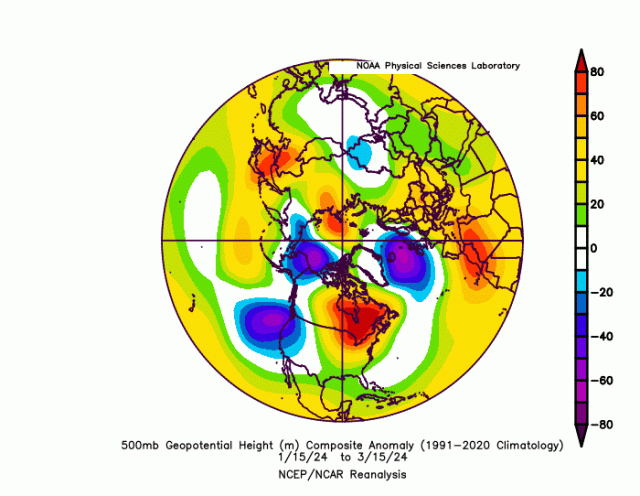
That awesome 500 mb pattern? Here is what happened
So can you understand why this is important? It can’t be 3 months after the fact that the data comes in and shows the increase in geothermal activity. How the heck does that help you? And if you are not looking at all of this, you simply accept what you are told. It’s the opposite of the great reason to search that the Apostle Paul implied when he said. ” Those who know what they know. DON’T KNOW WHAT THEY OUGHT TO KNOW.
The unmoved mover of a lot of what we see going on may be this aspect. I have shown you with an actual case study. The scars of a wrong forecast heal, but are always there to remind me of what happened.
So I ask you not to necessarily accept what I am saying, but at least understand where I am coming from. If you saw me in a tomahawk fight with Geronimo, at least you would have some sympathy or try to get me something to fight back with, wouldn’t you
See you at the conference.