
Every year, hysteria over heat and hurricanes reaches a fever pitch. In a couple of weeks, if I am right about MJO progression, some hurricanes will show up and threaten as they are apt to do when the MJO rotates into the favored phases of 8,1,2,3.
.png)
8/1
.png)
2/3
.png)
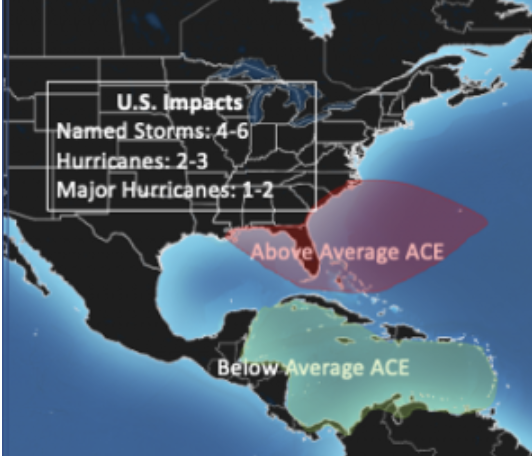
So, while the overall global tropical activity is abysmally low:
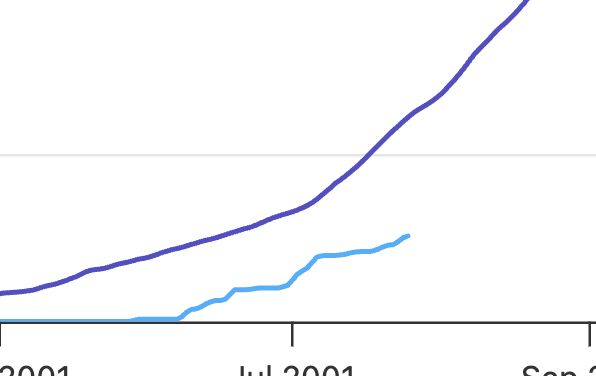
You can be sure if one shows up in our red zone, then moves out of it up the coast or west into the gulf and intensifies, we will hear the screams of anguish about that being worse than ever, as we do with heat.
But I want to use where I live as a classic example of where and when warming is occurring and why using temperatures rather than wet bulbs, or better still saturation mixing ratios, is a faulty climate metric. For wet-bulb temperatures and saturation mixing ratios would point the finger for warming at water vapor, not CO2, and then we would have to really get into a fight about what is actually warming the oceans, which there is no way to do because of the laughable data sources we have in the ocean. 1 data buoy for every 100k square miles down to 6k feet when the average bottom of the ocean is 14k and virtually no sensors actually detecting what is going on when 10 million hydrothermal vents, capable of releasing streams as warm as 400 degrees Celsius, may be more active than average, makes it a fight better to ignore just in case it has something to do with it. I am being sarcastic here, but I cannot believe in 2025 we can’t go and get real-time data rather than have to wait months to see what is going on AFTER WE WATCH AREAS OF THE OCEAN SUDDENLY WARM.
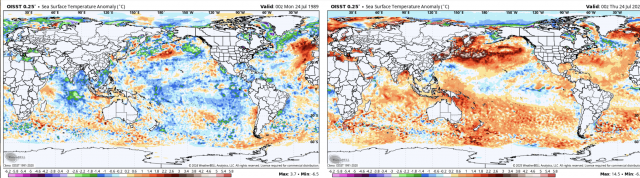
But the fact is, there is more water vapor in the air, as there should be. Just what do you think is going to happen when you have a change like this from 1989 to now?
In the period where geothermal increase preceded the rise
.jpg)
and then a fall like this right in the area of mid-ocean spreading, when it fell off ( graphic lower right).
.png)
The question is, does it continue, and what happens if it does? Another discussion for another time, but it’s a test I am curious about.
Back to State College, PA.
The thermometer is near the Walker building on the PSU campus. When I was there, it was open to the southwest with a golf course that got cool at night, and around sunrise, when the air starts getting mixed, that cool air would flow unabated to the site. It’s a classic case we see on clear, calm nights. There are nothing but buildings around it now, so that is no longer the case. Parts of the open areas near the golf course have been paved over by parking lots.
So, look what has happened to nighttime lows:
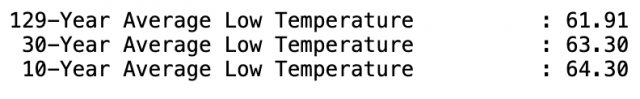
They are up 2.5 degrees from the 129-year record and a degree vs. the 30-year record. The combination of the UHI that is developing and increased water vapor in the air puts a floor on how low temperatures can drop. The only way you will get a record low now is with a strong wind blowing, and that air is well mixed anyway, so if, let’s say, the average dew point is a couple of degrees higher even in the arctic air mass due to water vapor injection over the past 35 years, it’s highly unlikely you will get a low.
But what about daily highs?
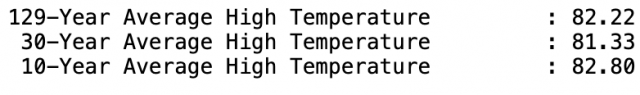
Isn’t that special. Overall, only .6 vs the 129 year record, but the buildings and concrete are bringing it up more in the last 10 years, as you would expect.
But what does that point the finger at? The only “man-made” aspect of all this is the building that is going on around the site.
Anthony Watts has outlined this ad nauseam for years (has to make man-made climate change advocates sick, so they don’t even bother to look).
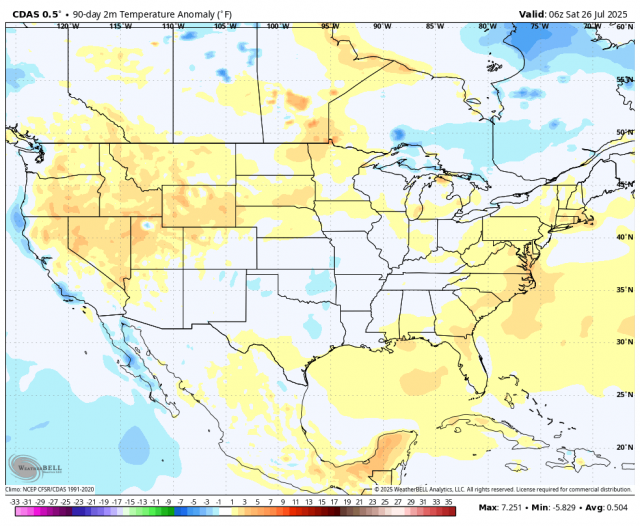
But for all the hand-wringing on how hot it is, the last 3 months are nowhere near as warm as climate models had it.
Actual temps last 90 days:
Model forecast for MJJ
Euro
.png)
CFSv2
.png)
One wonders what we would be hearing if it were actually right.
Then again, as John Christie shows:
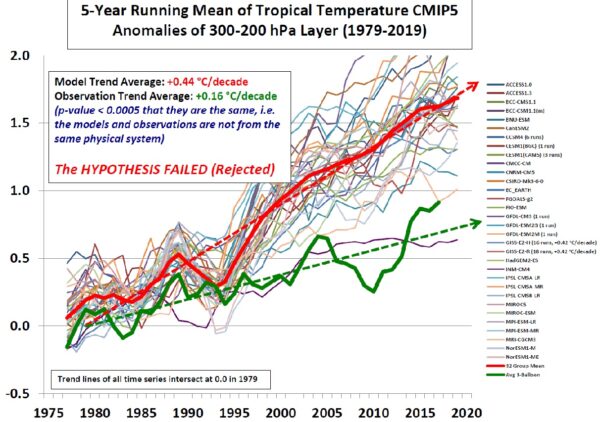
Climate models are out of control and can’t see cold when it’s coming, most of the time, until it’s obvious. Last winter was classic in January and February. All models a month before had the month’s warm and completely whiffed.
And the spike that had occurred is obvious proof it’s water vapor, as global temps are backing off now. July, for instance, is .25°C cooler than last July globally. Tonga and El Niño were a double whammy, but the big test in my mind is if geothermal input drops enough so oceans start to cool. So I am going to get my answer, even if no one wants to even hear the question.
But July is classic. For all the hand-wringing about the heat, max temps are only the 20th warmest in the last 25 years against the PRISM temperature record.
.png)
Minimum temps are THIRD WARMEST though in the last 25 years.
.png)
The mean is 12th warmest in the last 25 years, or right in the middle of the 25 year period (which has been above normal vs the entire record).
.png)
It’s the nighttime lows that are strongly skewing it, and the hysteria about all the heat is being driven by something other than actually looking at the whole picture.
Why are nighttime lows higher? More water vapor and UHI. Man contributes to the UHI, but what is really warming the ocean? If the oceans were the same temperature they were 35 years ago, wet bulbs would be lower. Al Gore is fond of saying oceans are boiling. Well, it’s not from man-made sources to any degree that we can actually measure, given the large natural forcings that are at work here and always have been. Then again, he has gotten rich off it, so he has got that going for him. Even as opined here, he should be one of the people held accountable for all this agenda has done to limit the progress of mankind.
https://www.cfact.org/2025/07/05/it-is-time-to-hold-the-climate-cabal-accountable/
So to the people screaming about how hot it is, it shows why temperature is a lousy metric. If you were quantifying wet bulbs, you would understand that with more water vapor, nights are warmer and driving the upward trend. You are feeling more uncomfortable because it is more humid, but that also means that there is more rain falling, trying to limit those high temperatures. And the data shows that. Now, if it were just dry everywhere, that’s a problem. But the rain shows, first, the atmosphere’s natural response to extra water vapor, and second, that it’s not warming enough aloft to slow condensation processes, so it rains. But it’s also a strong indicator that water vapor is the reason — not man-made input, at least not to the kind of hysteria people whip up over normal summer weather. And in this case, it’s actually one of the cooler Julys since 2000, as far as high temperatures go.