Back in the 1980s, when I volunteered as a strength coach at PSU, our head coach argued with a ref in a relatively restrained manner over a horrible call. Because our guy was in such good shape and was better than his opponent, our coach said, “You know, you can have those points; it doesn’t matter”
Our guy wound up winning by technical fall.
So when it comes to such things as the global mean temps, which the man-made climate control knob people are loving, fine, though it’s a horrible call as far as looking at the better metrics, let’s do this. I’ll give you your point, so let’s see what it means for claims that the weather is getting more extreme. Just like our coach knew what was going to happen, I know what the AI will come up with here when presented with the temperatures they love to use so much.
BTW, I am writing about the temperature so much because it has to be exposed for what it is: a deceptive metric that avoids using the ones that really explain the climate BECAUSE THOSE WOULD NOT CAUSE ALARM.
So, the AI (Grok) was tasked with answering questions based on the observed warming being touted as causing the worst weather ever. Again, remember I am using AI, so you don’t think my anti co2 climate control knob agenda position is getting in the way of a logical conclusion.
It was presented with 4 levels of the atmosphere, left to right, 250,500,850,1000 mb, and the anomalies relative to the 30-year average, ending in 2020


For comparison, we’ll look at the same levels for the decade ending in 1985, before geothermal input started.


Let’s go back to the most recent 10 years
.png)

as that is when the claim is that the weather is getting even more extreme. So extreme, according to AOC, we now have less than 5 years.
ME: So to the question: With it warming more aloft, isnt that a more stable atmosphere?
AI: Yes — greater warming aloft relative to the surface produces a more stable atmosphere.
ME: Now with this warming, more poleward than the equator, does that not imply less zonal potential energy now than the 1976-1985 map on the left
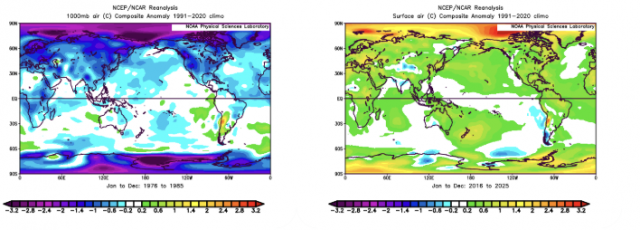

Yes — stronger poleward warming (polar amplification) relative to the tropics reduces the equator-to-pole temperature gradient and therefore implies less zonal-mean available potential energy (ZAPE) compared with the earlier period.
I have discussed this earlier.
Me: Now let’s look at the vertical implications for the decade 1976-1985. 1000,850,500,250 mb. What does this say about the stability in the lower troposphere vs the most recent example
.png)

AI: For 1976–1985, the vertical structure of the temperature anomalies points to a less stable lower troposphere (steeper lapse rates) in many regions compared with the 2016–2025 period
So it’s more unstable.
Me: So, what is the intuitive answer for a more stable troposphere with decreased zonal potential energy?
AI: Less extreme weather. A more stable troposphere makes it harder for air to rise, so you get less convection and fewer thunderstorms. Decreased zonal potential energy means less fuel for the large-scale eddies that create mid-latitude storms and cyclones. Where most people live, the straightforward dynamical result is fewer and weaker storms.
OPPOSITE OF THE MESSAGE PUSHED BY THE ALARMISTS.
Again: Where most people live, the straightforward dynamical result is fewer and weaker storms.
So the very scale they use to raise alarms about how bad it is refutes them. You can’t get your behind kicked any worse than that conclusion. They promote ideas refuted by real-world observation.
I’d say it’s like pissing down our backs and telling us it’s raining, but they will say that is a sign of a man-made climate disaster also.