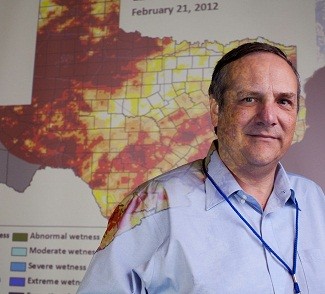
Have global temperatures warmed, cooled or flattened? If so, by how much, since when, and how can we know? I have posed these questions to two highly credentialed climate scientists who have different views on this topic. Texas State Climatologist Dr. John Nielsen-Gammon, a Regents Professor of atmospheric sciences at Texas A&M University, will present a view that global temperatures have seen an upward trend since the late 1970s. Former director of the U.S. Weather Satellite Service and University of Virginia Professor Emeritus Dr. S. Fred Singer will present an argument that there is no convincing evidence of warming since that time.
 John Nielsen-Gammon: What would it mean to say that global temperatures are rising? Global temperature anomaly measures how much global temperatures differ relative to a reference period, and the anomaly here often changes erratically from year to year. Some years are warmer than the previous one, some are colder. Underneath that year-to-year variation, though, is a longer term time-varying trend. Standard global time series show an upward trend from about 1910 to about 1940, a weak positive or negative trend from about 1940 to about 1975, and an upward trend since then.
It’s conventional to define the trend by the slope of the trend line, a best-fit straight line through a segment of the data. There’s no reason to expect that the Earth is actually warming at a perfectly steady rate, but the slope of the trend line is a convenient measure of the average rate of warming.
With those preliminaries out of the way, here are the global temperature trends in the two most well-known global analyses, from 1978 to the most recent time available:
NASA Goddard Institute for Space Studies (NASA-GISS) : +0.3 F/decade.
Hadley Centre/University of East Anglia: +0.3 F/decade.
These numbers are not perfect, and they come from observations that are definitely not perfect. For example, there are concerns about urban heat islands and about siting issues, concerns which I share and have helped publicize. So these trends need to be double-checked and confirmed in some way.
One good way is to look just at ocean surface temperature trends. That’s 70% of the Earth’s surface, with no urban heat islands! According to the Hadley Centre, this increased warming amounts to +0.2 F/decade. So yes, it’s still rising, but not as much. What does that mean for the trends just over land? It indicates that that increasing land temperatures must be larger…and according to the University of East Anglia, that trend is +0.5 F/decade. Since most of us live on land, we experience the land surface temperature trend.
Are land temperatures really rising that rapidly? Let’s take a look at what some independent experts from UC Berkeley came up with. Their “BEST” project calculated that land temperatures are rising at a rate of +0.5 F/decade. Really, no matter how you slice and dice the actual temperature observations, you get roughly the same answer.
So how can we check this independently ourselves? We could use microwave satellite retrievals of temperature from the lowest few miles of the atmosphere. That’s not exactly surface data, but the two are strongly connected. Most computer models indicate that the trend in the lower atmosphere ought to be just a little bit larger than the surface temperature trend.
On this basis, two different research groups have independently done their own merging and intercalibration of the data from various satellites which have been in orbit at various times since 1979:
The University of Alabama-Huntsville (UAH) Land-only TLT trend is +0.3 F/decade.
The Remote Sensing Systems (RSS) Land-only TLT trend is +0.3 F/decade.
Those also aren’t as large as the surface data would indicate, but TLT represents the average temperature in the lowest three miles or so of the atmosphere, not at ground level. Still, climate models predict that the TLT values ought to have a slightly higher warming trend than the surface temperatures, not the lower trend that the data indicates.
In this case, it’s hard to know which is wrong: the models, the surface data, or the satellite data. Most likely, they’re all wrong to some degree: no data are perfect, and no models are perfect. The truth probably lies somewhere in the middle.
These are not the only data sets that point to unambiguous warming. Night time marine air temperatures (NMAT) measured on ships show warming. Also, a recent study analyzed the weather using only sea surface temperature and sea level pressure observations. The resulting temperatures over land produced a trend of +0.4 F/decade.
We also see an unambiguous response to warming in the environment: glaciers, combined Arctic and Antarctic sea ice, ocean heat storage, the ranges of species and so on. On a multi-decade time scale, there’s no global indicator that presently shows cooling.
In summary, the reported land surface temperature trends over the land portions of the globe since 1978 are about +0.5 F/decade if measured directly, and they are around +0.3 to +0.4 F/decade if we use independent methods immune to urban heat islands. Ocean-only and land+ocean temperatures are rising, too, but at a somewhat lower rate.
Sure, there are corners of the Earth that have gotten colder, and some that haven’t changed much. There are also some places that have warmed much more than the global average. Overall, though, all lines of evidence point in the same direction: warming.
 S. Fred Singer: First, there would be very little public interest in funding climate science, were it not for an assertion by alarmists in the political and environmental communities that a human-caused (“anthropogenic”) global warming crisis exists, which can be mostly attributed to carbon-dioxide emissions from burning fossil fuels to generate energy.
Debates about those claims revolve around several contentious issues. Key among these are: whether there is, in fact, reason for alarm; what reliable evidence supports that supposition; i.e., what degrees of impact do human have versus natural influences on global temperature changes (both warming and cooling); and what trends can be observed and projected to guide prudent responses? It is not my intent to argue that the global climate has been cooling since the late 1970s, but merely to present a case that there is no convincing evidence that it has been warming.
John, With regard to the matter of species migration you raised, I believe that this topic is entirely too speculative to discuss here. There are too many variables, too many special circumstances, too many uncertainties. Likewise, ocean heat content data is very poor, requiring numerous “adjustments.” Vertical temperature profiles are most surely controlled by currents that vary with depth. They are not one-dimensional, as implied by the data.
Since I am primarily a data guy, I’ll confine my comments here to discussing recent climate trends but note that the global climate has warmed since the Little Ice Age (about 1400-1700 AD), and it will likely continue to warm for another 200-300 years, in fits and starts, towards a max temp roughly matching that of the Medieval Warm Period. In this context, “recent” refers to the decades since 1978 when satellites became available to measure atmospheric temperatures globally to supplement global radiosonde (balloon) records that reach back to about 1958.
We also get temperature information from (non-thermometer) ”proxy” data. And while all of these methods present specific problems and have limitations, let’s review what we can learn.
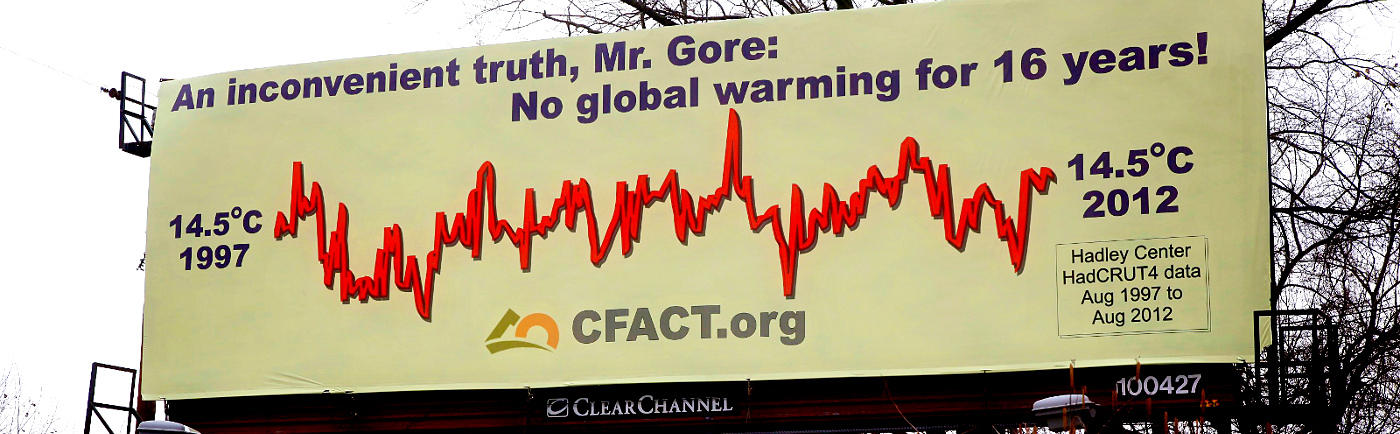
John opened his discussion with a statement that there has been a (reported) rising global temperature trend since 1975, while in fact broad agreement exists that there has been no warming for at least a decade. Phil Jones [of the University of East Anglia] has stated that global temperatures have been flat for 17 years.
John also provided earlier surface data compiled by NASA-GISS and the Hadley Centre/University of East Anglia (Hadley-CRU). The close agreement between those trend results does not indicate independent confirmation. This shouldn’t be at all surprising when we consider that they use mostly the same raw data.
Problems with surface measurements are notorious. Recording stations are sparse, even nonexistent in vital global locations, most particularly throughout the Southern Hemisphere and in remote polar regions. After 1970 the number of reporting stations dropped suddenly and drastically. (Stations at airports have seemed to be unaffected, and may even have increased in number.) And as John noted, urban heat islands have developed over time, not to mention problems resulting from faulty placements of temperature recording instruments which have to be “corrected” by applying subjective ‘homogenizing’ (tuning) procedures.
Even then, according to UN Intergovernmental Panel on Climate Change (IPCC) figures, the reported global temperature increase between 1942 and 1995 was approximately +0.5° C, while U.S. and Western European data showed approximately zero.
While the IPCC claims that a large temperature increase occurred between 1977 and the turn of the century (presumably based mainly on sea surface temperatures (SST), recent SST data published by Viktor Gouretski and John Kennedy in Geophysical Research Letters (2012) and the latest Ocean Heat Content (OHC) data from the National Oceanic Data Center (NODC) show only a minor warming between 1975 and 2000; Hadley NMAT data show nearly the same results. In short, SST and NMAT show a ~zero difference between 1942 and 1995, while OHC showed a difference of less than 0.1° C. These comparisons are summarized below.
Global land-based surface temperature differences (UN-IPCC)= approx. 0.5° C
However, U.S. land-based surface temp. differences (NASA-GISS) = approx. zero
Sea surface temperature differences (Victor Gouretski-GRL, 2012)= approx. zero
Nighttime marine air temp (NMAT) differences (Hadley Center)= approx. zero
Ocean heat content differences, 1979-1997… average (NODC)= less than 0.1° C
Atmospheric satellite temp. differences, 1979-1997 (MSU-LT)= approx. zero
Atmospheric radiosonde temperature differences, 1979-1997= approx. zero
Proxy sample temperature differences (mostly land surface)= approx. zero
Despite some discrepancies between various data sets, the global temperature differences between 1942 and 1997 are small to none – except for land-based thermometer data outside the U.S. This disparity with your warming premise demands an explanation – as do the much larger in trends of the Northern Hemisphere compared to the Southern Hemisphere.
Further, satellites show atmospheric trends that are smaller than surface trends – even though atmospheric theory (and the models incorporating that theory), show the opposite. Instead, models predict that there should be an “amplification” of the surface warming trend to produce a “hot spot” in the tropical troposphere. Instead, both satellite data and independent balloon data show a near-zero trend from 1979 to 1997, followed by a well-known 1998 temp “spike” which is universally attributed to a Super-El- Niño. This absence of an observed hot spot suggests that the land-surface temperature warming trend (1979-1997) is greatly overestimated, and should be close to zero in the Tropics.
Various scientists attach different interpretations to this disparity between models and direct atmospheric observations. Some suspect the fault lies with the quality of the atmospheric temperature data; some blame the models; while others merely note that the disparity exists and do not attempt to reconcile it at all.
John also mentioned sea surface temperatures (SST), which avoid urban heat island influences. These measurements, covering (imperfectly) 71% of the planet’s surface, are taken by four different methods, each introducing unique problems and uncertainties as well as referring to different depths of the ocean:
* The bucket method has been used since earliest times. The samples come from near the surface (about 1 meter), and temperatures are recorded manually. They should show a pronounced max after noon due to direct solar heating.
* The ship-engine cooling-water intake method collects and records ocean temperatures at depths of several meters.
* Floating surface buoys (“drifters”), record temperatures within a meter below the actual sea surface. The temperature data is collected by satellite, and should show a post-noon maximum.
* Nighttime marine air temperature (NMAT) is taken by thermometers at the decks of ships, well above the sea surface. The relatively minor warming of the ocean surface (71% of the Earth’s surface), stands in contrast to the reported global warming between 1970 and 2000. It suggests that land surface warming has been greatly overestimated.
A similar conclusion is indicated from atmospheric temperature measurements. Although they use two independent methods, and as with other tools, each is imperfect, satellite and radiosonde data confirm each other’s trend results quite well. Satellite temperature records, which have only been in existence since 1978, cover the whole globe, but are subject to problems associated with various drifts which must be accounted for and corrected. Balloon-borne radiosondes are best used for data at detailed altitudes, but have problems with instrument calibration and interference from direct solar radiation.
Still, taken together, the data reveals a consistent and convincing picture of near-zero warming trends in the tropical troposphere –i.e., absence of an observed “hot spot”. Coupled with a modeled trend “amplification”’ of about 2, this suggests an extremely low value for the land surface trend – hence low values of climate sensitivity to increases in CO2.
John Nielsen-Gammon: Fred, even if there was no anthropogenic component to  climate change, the farmers and ranchers in my state would still be desperate to know what’s going to happen with this present drought, and with future droughts. Our analysis shows our drought is mainly natural, with the Pacific and Atlantic Oceans playing important roles. In the long run, the more we know about ALL the causes of climate change, the better off we’ll be.
You can get some interesting numbers if you mix and (don’t) match time periods. As a general rule, the shorter time period you choose (or the smaller the area), the easier it is to find a temporary downward trend. The Skeptical Science blog (quite one-sided, but usually accurate) calls this “going down the up escalator”.
Like Fred, I’ve stuck mostly to the data. Here’s the data Fred relies upon, with the trends over the whole interval from 1979 to the latest available:
Land:
* Global land-based surface temperature trend (HadCRUT4) = 0.5° F/decade
* Likewise, U.S. land-based surface temperature trend (NASA-GISS) = 0.5° F/decade
* Atmospheric satellite temperature trend over land (RSS MSU-LT) = 0.3° F/decade
Oceans:
* Sea surface temperature trend (Victor Gouretski-GRL, 2012) = 0.2° F/decade
* Using bucket method only = 0.3° F/decade
* Using ship-engine cooling-water intake method only = 0.3° F/decade
* Using floating surface buoys only = 0.3° F/decade
* Nighttime marine air temperature (NMAT) trend (Hadley Center) = 0.2° F/decade
* Atmospheric satellite temperature trend over oceans (RSS MSU-LT) = 0.2° F/decade
* Ocean heat content trend (0-2000 m, NODC) = 80,000,000,000,000,000,000,000 Joules/decade
Global:
Surface temperature trend (HadCRUT4) = 0.3 F/decade
Atmospheric radiosonde temperature trend (Angell) = 0.3 F/decade
Atmospheric satellite temperature trend (RSS MSU-LT) = 0.2° F/decade
How does this compare with the IPCC projections for the trend over the interval 2000-2030? Not too bad:
Projected trend over land: 0.4° F/decade
Projected trend over oceans: 0.3° F/decade
Projected global trend: 0.3° F/decade
To me, that’s impressive consistency from lots of independent data.
The recent lack of warming does deserve discussion. As several have shown, including me in blog posts such as this, the short-term variations in the trend are mainly due to variations in El Niño and volcanic eruptions. The last two years have seen the key El Niño region running cool, and as has almost always happened in similar situations in the past, the globe has run cool too.
Underlying those short-term variations are a long-term trend whose cause is known and whose existence is supported by all the available global analyses.
Fred Singer: With regard to those drought conditions in Texas, it’s very apparent that 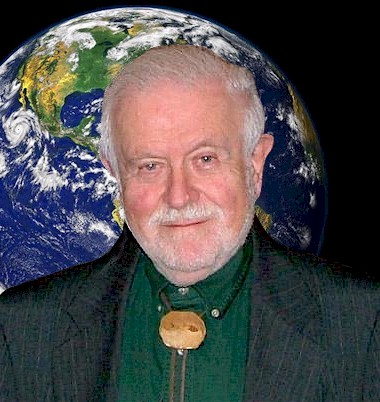 ocean cycles have had an important influence. The Pacific Ocean has shifted to a cooler phase while the Atlantic is still in a warm phase. This circumstance is similar to what occurred in the early 1950s when the drop in tropical Pacific temperatures caused less moisture to be present in the atmosphere here in the U.S. then when that ocean is in its warming state. That causes conditions to be drier, especially near and east of the Rockies, as well as in the Deep South. As a result, we see hotter, drier summers, and winters tend be warmer earlier, and colder later. We’re also seeing colder spring temperatures caused by a multi-decadal warming temperature shift in the Atlantic which has greatest influence in the late winter and spring.
Now, with the Pacific cooling again, temperatures are starting down again. None of this has anything to do with atmospheric carbon dioxide levels. This particular combination of entirely natural ocean conditions is producing a change in the in the entire global weather system. While some who are unfamiliar with ocean influences attribute the Texas drought to global warming, the reality is exactly opposite. It’s due to cooling of the Pacific that is causing a mid-level moisture drop. It actually directly contradicts the theory that so-called anthropogenic global warming is leading to drier conditions around the globe.
With regard to glaciers, their individual flow rates are recognized to be complex and varied, both in location and time. In any case, ice melts only after a certain delay and does not respond to short-term temp fluctuations.
In Greenland, glaciers with growth rates that have been found to be accelerating during a few years, decelerated in others. Some accelerating glaciers were in proximity to others that were decelerating. A variety of local factors are believed to control these individual behaviors, including: fjord, glacier, and bed geometry; local climate; and small-scale ocean water flow and terminus sea ice conditions.
As for combined Arctic and Antarctic ice, there is always a natural balancing act going between the two. There has been a lot of recent media attention directed to overall melting conditions in the northern ice cap region which is attributed to global warming. The cause is that the Atlantic Ocean has been in its multi-decadal warming phase. Meanwhile, the southern ice cap has increased to record levels.
Southern ice cap expansion is particularly impressive because, since is surrounded by water, it requires more cooling to freeze that ice than it does to warm cold dry air a bit on continental surfaces that surround the Arctic Ocean. When the Atlantic Oscillation returns to its cold mode, the northern ice cap will expand again as the southern ice cap shrinks.
Finally John, your statements attributing later fall coolings and earlier spring bloomings as evidence of global warming lack example and specificity needed in order to frame a substantive response. One very plausible explanation could be attributed to CO2 fertilization. Notwithstanding the matter of where and when these conditions arise, CO2 increases most certainly benefit agriculture. By the same token, if there is no reliably measurable evidence of global warming from thermometers, those undocumented species migrations you alluded to prove nothing either.
Larry Bell: Thank you both for contributing your thoughts and rationale in this exchange. Unfortunately, due to length, let’s close this part of the discussion here recognizing that these will certainly not be the last words in this discussion. For now, we can leave those to reader commentaries. I can only urge and hope that responders continue the spirit of mutually respectful civility and substantive dialog that the two of you have exhibited.
————
A version of this article first appeared in Forbes Online.
Global warming…. Bwwwwahahahahaha! If you believe in that bunk then you are a full-on retard.
You cannot trust a man that has a hyphenated last name.
Manmade CO2 (AGW CO2) is only 0,001152% ≈ nil of the atmosphere.
So it simply can’t have any influence on global warming nor for that on Climate
Change!
A “scientist” who says otherwise has no common sense; to just put it politely!
Climate Change has always been present on earth during eons, caused mainly (at least 95%) by the state of agitation of the sun and the influx of cosmic rays (Prof. Svensmark et al).
So, suppressing AGW CO2 at huge cost is totally ridiculous.
Wind turbines have an economic effectiveness of 2 ‒ 4 % ≈ nil, because they need back up (preferably gas fired) electricity generating installations in the many cases there is not enough wind or too much wind or they are in repair, etc., etc.
The whole system of turbines and back ups does not diminish AGW CO2 at all, but instead has cost trillions of € worldwide!
Therefore, the subsidising of wind turbines is the most stupid decision politicians have made and consequently should be held responsible for that total waste of public money, paying back at least a great deal of that loss, with their own money!
In this corner we have an actual climatologist and in the other corner a guy who read a few books. Very comical.
I had the pleasure to take an environmental science course at the University of Virginia in the early 1970s that Dr. Singer taught. It was on coastal environments. I entered the class thinking that it might be fun, but that I was going to have to filter through the noise to get to reality. What I found was that Dr. Singer was pragmatic, fact based individual that was not swayed by what everyone else was saying or doing. To copy the old E.F. Hutton commercial, when Dr. Singer talks, I listen.
Fred Singer is a paid shill for fossil fuel insdustries.
Industry Ties:
The Cato Institute, Competitive Enterprise Institute, Heritage Foundation, Heartland Institute and others. Singer has also done consulting work for major oil companies including Texaco, Arco, Shell, Sun, Unocal, the Electric Power Institute, Florida Power and the American Gas Association. Has previously worked for the tobacco industry to debunk the “junk science” linking their products to cancer.
Funny how $ can make you sell your soul to the highest bidder.