Global warming radicals will stop at nothing to get control of the world’s energy and prosperity at the UN global warming summit that opens in Paris next week.
In true Orwellian fashion they want history amended, or expunged.
It appears that they may have tampered with temperature records to cool the past and warm the present.
You probably remember Michael Mann’s infamous “hockey stick” graph that tried to  smooth the medieval and Roman warm periods and little ice age out of our understanding of past temperature. The idea was to scare us by making it look as if temperature didn’t start varying until the second half of the 20th century. It has been thoroughly debunked.
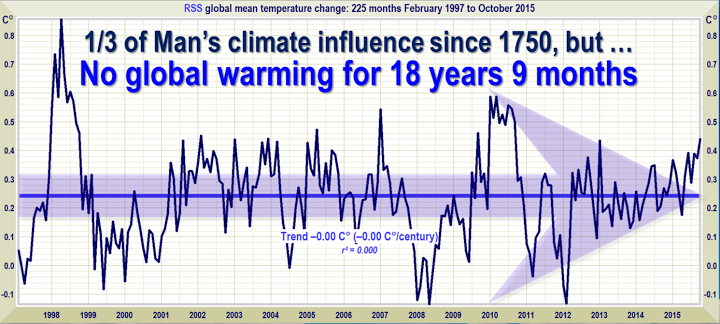
You are probably also aware that temperature satellites can find no global warming since the last El Niño ocean event at the end of the 20th century. (Watch for the warming crowd to try and attribute warmth from the current El Niño to human activity and then forget about it when it ends).
This two decade “pause” in world temperature is terribly inconvenient for the warming narrative.
With world leaders headed to Paris to try and lock us into a UN global warming pact, they badly want to get their story straight.
Now it appears as if researchers at NOAA tried to do it again. With climate computer models projecting temperature increases that never occurred, they “adjusted” past temperature records to try and conjure up some warming.
Congressional investigators want to get to the bottom of this. NOAA is stonewalling and refuses to turn over the records taxpayers paid for.
It is a rock solid rule of science that researchers must adjust their conclusions to conform with their data. They must never adjust their data to fit their hoped-for conclusions. To do so is a terrible transgression against science.
George Orwell wrote, “Who controls the past controls the future: who controls the present controls the past.”
It appears we can no longer have confidence in the researchers who have been appointed to “control the present” at our scientific institutions.
Getting them functioning honestly again will be a monumental task.
Its a shame that there hasn’t been the warming promised. We would all be much better off.
“Science is the belief in the ignorance of the experts” – Richard Feynman
This article is total nonsense.
This is what another expert had to say about your discussion;
Christopher Keating to moallem1 2 days ago This was about the Viking history story.
There are so many false statements in this comment that it simply isn’t worth my time to address all of them here. Fortunately, I’ve already addressed just about all of them as submissions to the challenge (which was closed on July 31, 2014). You may refer to the submissions for my responses. However, I will comment on your claims about the MWP. These claims are false and/or false arguments. Your claims have so many errors they have been so debunked I’m always surprised whenever someone pulls them out. Making these claims is a true-blue indication the person making them has rejected science and the facts in favor of an emotion-driven conclusion. For starters, take a look at the link below from Wikipedia. There are numerous resources from scientific institutions and scientific peer-reviewed papers on this topic debunking your claims. You are free to do a search on Google Scholar to find them.
https://en.wikipedia.org/wiki/…
Comical bumbling about by this author aside, this was the most comical bumble:
You are probably also aware that temperature satellites can find no global warming since the last El Niño ocean event at the end of the 20th century.
Best,
D
Another funny bumble.
Best,
D
Another funny stumble:
NOAA is stonewalling and refuses to turn over the records taxpayers paid for.
The taxpayers paid for records that are already available on those Series of Tubes, and were given to the Senator. Twice.
Best,
D
The denial of reality of no warming and the attempt to re-write history exposes the global warming extremists as behaving just like doomsday cult zealots who either deny the predictions that they made, change the date for ‘doomsday’, or change the real world data to claim that they were right after all.
~19 years, ~570 billion tons of anthropogenic CO2, and it has caused NO global warming. THAT is the empirical science: http://www.woodfortrees.org/plot/rss/from:1997.15/to:2015.75/plot/rss/from:1997.15/to:2015.75/trend/plot/esrl-co2/from:1997.15/to:2015.75/offset:-370/scale:0.08/mean:12
From the beginning of the Industrial Revolution to 1997 humans added ~1 billion tons of CO2 to the atmosphere. It has never been empirically shown that this was the primary cause of the slight warming since then. Actually, there is peer reviewed science that shows it was merely a natural warming in recovery from the Little Ice Age: “We learn that the recovery from the LIA has proceeded continuously, roughly in a linear manner, from 1800-1850 to the present … the Earth is still in process of the recovery from the LIA; there is no sign to indicate the end of the recovery before 1900. … These changes are natural changes.” – Akasofu(2010)
Well since 1997, humans have added over 500 billion tons more CO2 to the atmosphere, and it has caused NO increase in global average temperature. http://www.woodfortrees.org/plot/rss/from:1997.15/to:2015.75/plot/rss/from:1997.15/to:2015.75/trend/plot/esrl-co2/from:1997.15/to:2015.75/offset:-370/scale:0.08/mean:12
When you can add a 50% perturbation in the factor that the global warming extremists claim is the primary cause of climate warming and it causes no increase in GAT, this is clear empirical evidence that anthropogenic CO2 is an insignificant factor in causing climate warming.
That’s the real world science. It’s sad that the doomsday climate zealots deny that real world empirical science, and rather place their faith in the failed predictions from flawed, faulty, falsified climate models.
They can’t support their claims with empirical science. They can’t cite a single peer reviewed paper that empirically shows that anthropogenic CO2 was the primary cause of the most recent climate warming in the late 20th century, because there isn’t one. They are doing religion and ideology. So sad.
We climate realists are doing science, as there is empirical science that shows the late 20th century warming was cause by natural climate factors, just like every other climate warming in the history of the planet. The climate alarmists are the real deniers, of reality and empirical science.
Warning: be prepared for the scientifically illiterate climate cult fanatic trolls to play their games, obfuscate, and deny reality. They are not worthy of any responses, because they won’t and can’t address the empirical science.
Another Standard Dishonest Assertion from this lame disinformer.
Why is this another Standard Dishonest Assertion from this lame disinformer?
This is another Standard Dishonest Assertion from this lame disinformer because this transparent disinformer cherry-picks its data to dishonest about the trend. Always. All the time, transparently.
This is how this lame disinformer cherry-picks its data:
http://woodfortrees.org/plot/hadcrut4gl/from:1960/to:2015.1/mean:20/plot/hadcrut4gl/from:1960/to:2015.1/trend:20/plot/hadcrut4gl/from:1994/to:2015.1/trend/plot/esrl-co2/every/normalise/plot/uah/from:1979/to:2015/mean:20/plot/uah/from:1979/to:2015/trend/plot/gistemp/from:1960/to:2015/mean:20/plot/gistemp/from:1960/to:2015/trend/plot/rss/from:1979/to:2015/mean:20/plot/rss/from:1979/to:2015/trend
Blatantly dishonest and predictable. Again.
Best,
D
Sadly the climate cult troll Dano2 has shown up. He adds nothing
substantive to the discussion, and trolls to taunt and incite emotional
reactions and play his silly games. Hopefully one of these days the CFact will block him to keep the discussions civil and on topic.
The paleoclimate plot taking from the 1990 IPCC report is taken from Lamb (1965). It is for *central England only* (not global). It is described by Lamb himself as “qualitative” and it only goes up to the 1965, not the present day (as incorrectly labeled by this article). Mann et al represented the first attempt at a quantitative, global reconstruction. If all we had to rely on was that single paper >15 years ago, serious skepticism would be due. But, we don’t need to rely on Mann’s work exclusively (or even at al). We can rely on a large number of independent reconstructions made since. Instead of showing IPCC AR4, it would be more representative to show the plot from the most recent report, which now includes many paleoclimate reconstructions. The progression from Lamb to today is not about “rewriting” past data – it is about the replacement of a vague, qualitative sketch (Lamb 1965) with new quantitative techniques (MBH 1998), and then repeated by many researchers (1998-2015).
As for NOAA, “conjuring up” warming: all of their raw, unadjusted data is available online. Their code, their adjustments, and all of the relevant papers are freely downloadable. The adjustments made are based on standard statistical techniques. One is welcome to disagree with particular technical choices made in their recent revision. That’s fine and a number of people have made such arguments. But, unless they are not doing what they explicitly claim to be doing in their papers, accusing NOAA of dishonesty is unfair. These sorts of adjustments are common in science. The satellite record, shown prominently at the top of this article, has many large adjustments made to the raw data. And, again, one need not take NOAA at their word. One can look at any number of the other surface temperature reconstructions which all show a robust warming trend.
One minor correction (I double checked): The description of the Lamb reconstruction as “qualitative” came from the I990 IPCC report. Lamb describes the curve in his own 1965 paper as the “analyst’s opinion”, and it is stacked next to some quantitative proxy data. In any case, it is only central england, not global (as implied). And, it goes up to mid-20th century, not “the present day” (as this article claims).
Sorry, but when the IPCC published that plot, Figure 7.1, in FAR, the Figure’s description said: “diagrams of GLOBAL temperature variations”
Of course that was before the climate cabal took over fully and they decided that they needed to ‘disappear’ it because it was so embarrassing to their propaganda that recent temperatures are “unprecedented”.
“As for NOAA, … all of their raw, unadjusted data is available online. Their code, their adjustments, an all the relevant papers are freely downloadable.”
That is NOT true.
Let’s demonstrate that with a specific example.
Please link me to the “raw, unadjusted data” for Providence, RI.
There are currently ~2 dz paleoclimate studies, so we can look at all of them and find out that today is likely warmer than at any time in the past ~125K yr.
Best,
D https://uploads.disquscdn.com/images/241aacc32746bfaf9bf183359c3ec47be67e598a18e9714cd90330593bb04e65.png
@realoldone2:disqus:
Been a while since I looked at that. You are right that the figure presents the plot as global. But, there are two key caveats in the text:
1) Fig 7.1 describes the plot as a “schematic diagram”
2) In the body of the text, they write of Fig 7.1 “it is still not clear whether all the fluctuations indicated were truly global”.
The figure is extracted from Lamb’s 1982 textbook, where it is made explicit that the plot is derived from northern England proxies. I wish the AR1 report had explicitly cited Lamb for that plot, but they do reference it in the end notes for the chapter. Jones et al (2009) show IPCC AR1 Fig 7.1 overlaid on top of the Lamb figure and it’s clear they match. So yes, knowledge of paleoclimate was vague and tentative if 1990. Newer techniques have been applied on larger data sets in the intervening 25 years. I wouldn’t expect that “schematic figure” to remain immutable (that isn’t how science works).
As for the raw unadjusted NCDC data:
https://www.ncdc.noaa.gov/data-access/land-based-station-data
I just requested the data for all stations in the Providence area from Oct 1950 (arbitrary choice on my part). It takes about a day for them to send the requested data. I will post it when I get it.
Obviously you’ve been drinking. When Phil Jones admitted in the FEB 2010 BBC interview the real temperature of the world, HE ADMITTED: THE REAL GLOBAL TEMPERATURE is THAT of the RAW, UNADJUSTED DATA put that way online to protect the people from ADJUSTMENT FRAUD.
You need to go read the BBC 2010 PHIL JONES INTERVIEW
in light of the fact a few months earlier he got Snowden’d and was seen saying
”The scientific community would come down on me in no uncertain temrs if I said the world cooled since 1 9 9 8. OK IT HAS but it IS ONLY
SEVEN YEARS of DATA (every year between ’98 and ’05)
and it isn’t
statistically significant.”
What world wide data set DEPICTED that READING in 2005?
The RAW DATA posted UNADJUSTED ONLINE by LAW.
to STOP PHIL and MANN and HANSEN and SCHMIDT committing
ADJUSTMENT
F R A U D.
Then – JONES was FIRED even though he was given the opportunity to FESS UP and TELL the TRUTH.
Met Office: His OLD employer when he was DATA KEEPER for the WORLD.
2013: WHAT do they ANNOUNCE? NO WARMING since ’98, slight but not statistically significant COOLING.
Did world meteorological organizations go back and correct that data after PhiDDLiN PhiL SPiLLed the BEANS ABOUT no WARMING?
Did they go back and correct their records after the Met admitted no warming since ’98, two YEARS after they’d FIRED JONES for NOT ADMITTING
there had BEEN no WARMING since 98?
Ok then every WORD they PRINT is FAKED.
Every NUMBER,
Every MASSAGED DATA SET,
Every CLAIM of new MAGIC warming, it’s all FAKE.
When JONES was seen saying it in ’05
When JONES/MANN/HANSEN/SCHMIDT/TRENBERTH were seen on email DISCUSSING it in ’09
When JONES admitted it rather than GO to JAIL in ’10
When the MET admitted it 2 years after they fired HIM for NOT admitting it
IT hasn’t WARMED and THOSE DATA being massaged and released, are FRAUD.
They’re FAKE. Not MAYBE not MAYBE TUESDAY, not maybe when the Prime Minister jiggles the Yen so he can get that great little property on the harbor, all the capitalists fall over themselves about –
IT’S all FAKE.
END of STORY.