“Ocean acidification” (OA) is receiving growing attention. While someone who doesn’t follow climate change science might think OA is a stomach condition resulting from eating bad seafood, OA is claimed to be a phenomenon that will destroy ocean life—all due to mankind’s use of fossil fuels. It is a foundational theory upon which the global warming/climate change narrative is built.
 The science and engineering website Quest recently posted: “Since the Industrial Revolution in the late 1700s, we have been mining and burning coal, oil, and natural gas for energy and transportation. These processes release carbon dioxide (CO2) into the atmosphere. It is well established that the rising level of CO2 in our atmosphere is a major cause of global warming. However, the increase in CO2 is also causing changes to the chemistry of the ocean. The ocean absorbs some of the excess atmospheric CO2, which causes what scientists call ocean acidification. And ocean acidification could have major impacts on marine life.”
Within the Quest text is a link to a chart by Dr. Richard A. Feely, who is a senior scientist with the Pacific Marine Environmental Laboratory (PMEL)—which is part of the National Oceanic and Atmospheric Administration (NOAA). Feely’s climate-crisis views are widely used to support the narrative.
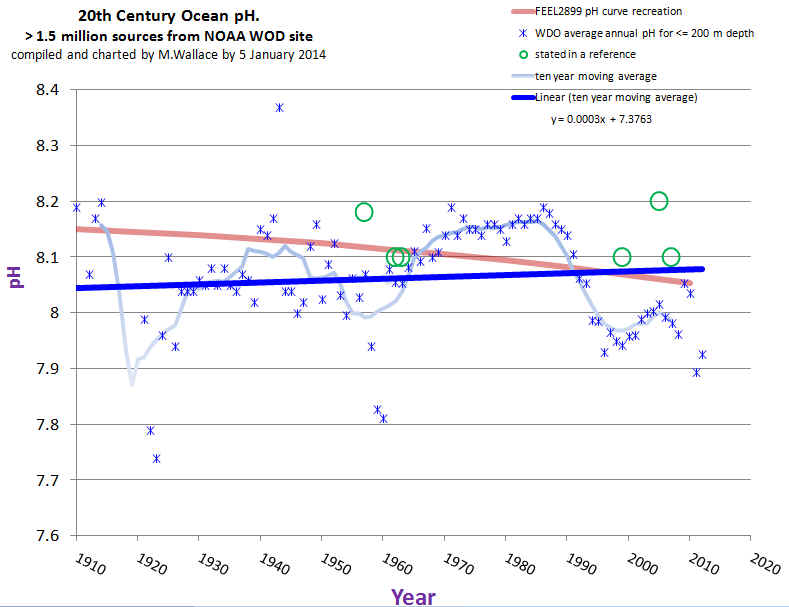
Feely’s four-page report: “Carbon Dioxide and Our Ocean Legacy,” offered on the NOAA website, contains a similar chart. This chart, titled “Historical & Projected pH & Dissolved Co2,” begins at 1850. Feely testified before Congress in 2010—using the same data that show a decline in seawater pH (making it more acidic) that appears to coincide with increasing atmospheric carbon dioxide.
In 2010, Feely received the $100,000 cash prize from the Heinz Family Foundation awards (established by Teresa Heinz, wife of Secretary of State John Kerry). The Heinz award site touts Feely’s work: “Ocean acidity is now considered global warming’s ‘evil twin,’ thanks in large measure to Dr. Feely’s seminal research on the changing ocean chemistry and its impact on marine ecosystems.”
The December edition of the scientific journal Nature Climate Change features commentary titled: “Lessons learned from ocean acidification research.”
However, an inquisitive graduate student presented me with a very different “lesson” on OA research.
Mike Wallace is a hydrologist with nearly 30 years’ experience, who is now working on his Ph.D. in nanogeosciences at the University of New Mexico. In the course of his studies, he uncovered a startling data omission that, he told me, “eclipses even the so-called climategate event.”
Feely’s work is based on computer models that don’t line up with real-world data—which Feely acknowledged in e-mail communications with Wallace (which I have read). And, as Wallace determined, there are real world data. Feely and his coauthor Dr. Christopher L. Sabine, PMEL Director, omitted 80 years of data, which incorporate more than 2 million records of ocean pH levels.
Feely’s chart, first mentioned, begins in 1988—which is surprising, as instrumental ocean pH data have been measured for more than 100 years — since the invention of  the glass electrode pH (GEPH) meter. As a hydrologist, Wallace was aware of GEPH’s history and found it odd that the Feely/Sabine work omitted it. He went to the source. The NOAA paper with the chart beginning in 1850 lists Dave Bard, with Pew Charitable Trust, as the contact.
Wallace sent Bard an e-mail: “I’m looking in fact for the source references for the red curve in their plot which was labeled ‘Historical & Projected pH & Dissolved Co2.’ This plot is at the top of the second page. It covers the period of my interest.” Bard responded and suggested that Wallace communicate with Feely and Sabine—which he did over a period of several months. Wallace asked again for the “time series data (NOT MODELING) of ocean pH for 20th Century.”
Sabine responded by saying that it was inappropriate for Wallace to question their “motives or quality of our science,” adding that if he continued in this manner, “you will not last long in your career.” He then included a few links to websites that Wallace, after spending hours reviewing them, called “blind alleys.” Sabine concludes the e-mail with: “I hope you will refrain from contacting me again.” But communications did continue for several more exchanges.
In an effort to obtain access to the records Feely/Sabine didn’t want to provide, Wallace filed a Freedom of Information Act (FOIA) request.
In a May 25, 2013 email, Wallace offers some statements, which he asks Feely/Sabine to confirm:
“…it is possible that Dr. Sabine WAS partially responsive to my request. That could only be possible however, if only data from 1989 and later was used to develop the 20th century portion of the subject curve.”
“…it’s possible that Dr. Feely also WAS partially responsive to my request. Yet again, this could not be possible unless the measurement data used to define 20th Century ocean pH for their curve, came exclusively from 1989 and later (thereby omitting 80 previous years of ocean pH 20th century measurement data, which is the very data I’m hoping to find).”
Sabine writes: “Your statements in italics are essentially correct.” He adds: “The rest of the curve you are trying to reproduce is from a modeling study that Dr. Feely has already provided and referenced in the publication.”
In his last e-mail exchange, Wallace offers to close out the FOIA because the e-mail string “clarified that your subject paper (and especially the ‘History’ segment of the associated time series pH curve) did not rely upon either data or other contemporary representations for global ocean pH over the period of time between the first decade of 1900 (when the pH metric was first devised, and ocean pH values likely were first instrumentally measured and recorded) through and up to just before 1988.” Wallace received no reply, but the FOIA was closed in July 2013 with a “no document found” response.
Interestingly, in this same general timeframe, NOAA reissued its World Ocean Database. Wallace was then able to extract the instrumental records he sought and turned the GEPH data into a meaningful time series chart, which reveals that the oceans are not acidifying. (For another day, Wallace found that the levels coincide with the Pacific Decadal Oscillation.) As Wallace emphasized: “there is no global acidification trend.”

“In whose professional world,” Wallace asks, “is it acceptable to omit the majority of the data and also to not disclose the omission to any other soul or Congressional body?”
Wallace met with staffers for both of his Senators, Martin Heinrich and Tom Udall (both NM-D), and shared his findings with them — but got no response. Heinrich and Udall both claim adherence to the climate crisis narrative.
These taxpayer-funded scientists are leaders of the OA narrative. They participate in well-funded OA research programs and sit on advisory councils, such as the Wendy Schmidt Ocean Health X Prize that offers a $2 million prize related to ocean pH measurements. “It all seems authentic and quite legitimate.” Yet their work is based on, as Wallace calls it, “a new history of ocean pH” — one that “is significantly different from the history suggested by actual measurements and other sources of peer review literature.”
Wallace came to me, because I’ve addressed similar cases of data omissions or use of bad science in relation to climate change issues, and he hoped I’d see the importance of his discovery—where his Senators did not. I am not a scientist, but I understand the broader issues. I’ve read through the e-mails, the FOIA, and Wallace’s recounting of the details. I’ve had several scientists review this accounting. It holds water (no pun intended).
As he initially did with Wallace, Sabine (should he see this) will likely dismiss me as some two-bit blogger who “will not last long” in my career. I invite him to prove me wrong—as Dr. Tim Ball has done with Michael Mann of the “hockey stick” fame.
In addition to my efforts to raise awareness of this issue, Wallace authored a petition that he urges my readers to sign. We also strongly encourage you to ask your representatives in Washington questions on this issue. Wallace concludes: “Ocean acidification may seem like a minor issue to some, but besides being wrong, it is a crucial leg to the entire narrative of ‘human-influenced climate change.’ By urging our leaders in science and policy to finally disclose and correct these omissions, you will be helping to bring honesty, transparency, and accountability back where it is most sorely needed.”
The plot in the text does not seem to have any relationship to the story. The story is about PH and the plot is human CO2 production vs year – dosn’t address PH at all. And according to Wikipedia the very concept of PH was not invented until 1909, so they could not have been measuring ocean PH before this unless I misunderstand something.
Ocean acidification (pH) occurs from absorbed or dissolved pCO2.
There are, in fact, several things you are quite clearly misunderstanding:
1) Measurement of ocean (seawater) pH has been entirely possible for over 100 years – and, in point of fact, there is recorded data regarding this measurement going back very nearly that long. Note carefully: Year of introduction/formulation of pH measurement (which is a measure of relative basicity(alkalinity) vs. acidity, as demonstrated by relative content-level of hydrogen ionization) = 1909; current year (same calendar system) = 2014; 2014 – 1909 = 105 years; ergo, more than 100 (potential) years of such data available (and, incidentally, nearly that many years of said data actually recorded).
2) Seawater pH is not “Neutral”, nor is it “Acidic” (as the pretty-obviously-falsified “research findings” put forth by Feely’s chart and published statements attempt to claim, or at least to imply), but is in fact “Basic”, generally reckoned (even by the readings noted for the years 1988-present on Feely’s own chart) as a pH Level of 8 (give or take 0.05 – 0.1).
3) Blood, as a comparison (which is generally reckoned as “Neutral”), is normally listed at pH 7.25 – 7.5, and (per Wikipedia) “…Since pH is a logarithmic scale, a difference of one pH unit is
equivalent to a tenfold difference in hydrogen ion concentration…”, which makes blood roughly 5 to 8 times as “Acidic” as seawater.
4) This makes talk of “ocean acidification”, based on actual measurement data, clearly alarmist bullshit by Feely and his cohort in junk-science crime Sabine – as is particularly apparent in both the clear fact of ignoring roughly 80 years of potentially-available data (prior to 1988) in producing that idiotic chart, and in then attempting a “projected” High CO2 Emissions curve on said chart covering the next 86 years (until 2100), “extrapolated” from (supposedly, apparently) roughly 25 years of carefully-“cherrypicked” data, with said “projection” based on – what? Another previously-debunked “projection” of Glowball Warmering (“due to CO2 emissions”, apparently) of “likely by 2100” 3,2 – 5.4 degrees C.?
5) Finally – as you make some reference to – Feely’s chart is, at base, bullshit, as it attempts to somehow equate/correlate the very small amount of actual ocean pH recorded data it may include – plus the clearly-scientifically-fraudulent “curve projection” he drew – as some kind of one-to-one matchup with “Man-produced CO2 emissions (apparently) in Parts Per Million (or something like that). That’s not even “junk science”; it’s “junk junk” – and total abject bullshit.
Feely got a $100, 000 award for that kind of crap? Nice scam…
And look at who produced the award. The wife of one of the biggest liars in this administration or any administration for that matter. Remember “Swift Boats?”
Swift Vets and POW’s for Truth: http://swiftvets.com/index.php
Cue harrumphing grandpa harrumphing that ‘acidification’ is bushit on 3…2…1…oh, you beat me to it.
Congratulations!!!!!!!! you have just now, with this comment, overturned all of the scientific discipline of oceanography. A big day for you, surely.
Best,
D
Everyone: See what I mean? Dano2 is a complete loon.
Cue Lieberal Loon dano making faces.
Fool.
In chemistry, a decrease in pH is called more acidic, regardless of the beginning and ending pH. pH 7.0 is based on the dissociation of H2O into equal concentrations of H+ and OH-, or H30+ and OH-.
{H+}{OH-}/{H2O} = 10-14.
Chemists call a decrease in pH from 9.0 to 8.9 acidification, although 8.9 is alkaline. Feely is correct in his use of the term, although his replacement of 80 years of pH measurements with a model that spits out politically correct data is fraud.
It’s just the wrong plot, though from a relevant paper (if the ocean is the carbon sink than CO2 production increase is the inverse of pH decrease) and Noon is too cynical or lazy or dumb, your guess is as good as mine, to correct it.
What started in 1988 was the collection of proper time series data at the Aloha Station in Hawaii. Before that, starting 1910, it was just opportunistic sampling which doesn’t support the kind of inferences Wallace is trying to draw out of it. The modeling method used by Feely and Sabine et al. is much more useful and its validity is corroborated by the data from 1988 to 2010. Ocean acidification is absolutely real.
You can see the correct chart at my place along with some explanation of what Wallace and Noon are doing wrong.
I just finished reading Elizabeth Kolbert’s “The Sixth Extinction”. She has a couple chapters on OA. (5 & 6). I admit; I am really confused. Are you refuting all her findings? Or…?
No, she is not refuting all of the scientific findings. This is a campaign of doubt – like Oreskes’ book details.
Best,
D
Sorry Dano2, this article about pH is based on a misinterpretation of bad data, but Oreskes’book is as good a misinterpretation of lots of abstracts from articles, where if you read the original article something different is said that doubts what Oreskes interpretates…
BTW, the Oreskes book has very few abstracts from articles. Are you just making it up because she is a totem and that was your reaction?
Best,
D
I was reacting from my memory on Oreskes as the origin of the 97% of all scientists agree, etc… where she has read a few thousands of abstracts and concludes that (near) all scientists agree that humans are to blame for the recent warming. Until you read the articles themselves… I haven’t read her book “Merchants of doubt”, thought it was the same subject…
Right, a totem. Got it.
Best,
D
In general, I accept people like they are with their good and bad behavior and their own opinion, no matter their side of the Global Warming stance… Until they say things that are clearly wrong or driven by fanatism, as is the case for Oreskes.
I have not decided (yet) what to think of Wallace, as he remains silent here and at WUWT, where I supplied lots of comments. If he doesn’t retract his claim of “good” data omitted by Sabine and Feely, then he gets in the same bin as Oreskes (must give a hell of a clash!)…
Nor have I decided what to think of Engelbeen, but if he would sign the petition, then I would like him a lot!
http://www.abeqas.com/category/ocean-ph/
I think he is far too smart to sign that petition.
Best,
D
Here we go again!!! The universe is always refining its self! It certainly does not need Gore’s help. Enough already. They want your money! Go ahead and spend, spend, spend!
There is an interesting procedure shown here by the Senators that I recently encountered with Chrysler Jeep Dodge Corporation: firewall after firewall, barrier after barrier between the correspondent and the Corporation. The purpose of this corporate – and, here, political – set of baffles is to prevent the “existence” of a problem from public attention. In summary, the philosophy behind it is “No contact means no complaint”. (Stalin had a far more frightening take on this: “Where there is a man, there is a problem. Where there is no man, there is no problem.”)
If we cannot get our public officials to admit we or our position exist, we cannot stop them from doing whatever they want while claiming they do it on our behalf. This is exactly the problem that stymies Mark Steyn vis-a-vis Michael Mann: by using the system to avoid going to court, the complaint or problem cannot become “real” in the public sphere.
The ability of public officials to simply refuse to respond is something we are going to have to address in all democratic nations. Silence is a more effective response to criticism than denial or refutation, as it makes the critic invisible first and then, if he is persistent, into an inconsiderate whiner.
You don’t have any accountability to one of Joeseph Goebell’s Big Lies when you are allowed to simply walk away with a smile on your face.
I completely agree with your statement, it is the direction that governments are headed. Don’t admit or accept a complaint and there is not a problem. 75% percent of the voters may agree, but are not organized enough to make a difference. It is sad but true.
>>>>>>>>>>The science and engineering website Quest recently posted<<<<<<<<<<<
WHERE IS THE LINK?
The link is there. Just mouse over the word “posted”–which is in blue and you’ll see it.
Sorry to disappoint you, but there is no fraud at all at work.
The data that were published by Feely, Bates, Sabine and others are data from FIXED stations and many samples over time, showing the influence of the seasons (temperature, bio-life) on pH and a host of other variables. But the 7 current fixed stations all show a similar trend of decreasing pH, which theoretically and practically (as is measured) is caused by the increase of CO2 in the atmosphere.
That caused a theoretical decrease of 0.1 pH unit in the ocean surface in the period 1850-current, of which a drop of really measured 0.04 pH unit since 1985 when the first fixed stations were starting with very accurate (+/- 0.02 pH unit, calculated and colorimetric) methods.
Wallace on the other side compiled lots of older pH measurements with glass electrodes, accurate to not better than 0.1 pH unit. That kind of measurements can in no way reproduce a trend of 0.1 pH unit over 160 years.
Worse, as most of the samples were taken randomly at different places and in different seasons (which may give difference of up to 1 pH unit), that is simply throwing garbage on one heap and showing the average result of the garbage…
That Wallace’s compilation is wrong can be simply proven: several of his results show changes of (global!) pH change of 0.2 units (and more!) from one year to the next. But that is only possible if there was a change of 200 ppmv CO2 in the atmosphere (or acid/base equivalent) in one year…
There is an overlap of both datasets in the period 1984-current which shows a drop of 0.04 pH unit for the fixed stations, but 0.3 pH unit for the compilation of Wallace. The latter is chemically and physically impossible, as that need some 300 ppmv CO2 increase in the atmosphere (or acid equivalent) over the same period…
Ferdie, they can make up any old campaign of deception they want. It doesn’t matter if it is true. Google ‘mike wallace ocean acidification’ and see what kind of websites you get at the top of the list.
Just another pasta thrown against the wall to see if it will stick.
Dano
Best,
D
I just read this whole thread. I’ve been trying to read as much climate change research as I can with my background as an MS degreed analytical chemist and I have found this whole thread totally fascinating. I appreciate your role in seeing it to it’s natural end. Personally, I see you as having the broadest and deepest understanding here. I’m jobless in science these days but looking for some kind of place to be active in this debate. I’m in Montana. My view is that the US is no longer as important in the international response to be made to the largest man made problem the planet has ever had to adapt to or evolve out of. Devolution of intellectual development may be part of the natural process of longer term evolution. I digress. I’m now reading that the international response to Trump and the US national sport of denial of critical thought is to decarbonize their economies as fast as possible as if the actions of Trump and the US make no difference. China is leading. They are advancing green energy through very large investment made possible by very large new investment banking consortiums. I have to suspect at this point that many US hedge funds have latched onto this trend and are now moving investment funding to these new banks. China wins in this scenario and the rich investors who jump into these
I just saw this – thank you for your kind words.
@ Ferdinand Engelbeen,
I am not educated in science and am trying to identify points that can easily be rationalized from both sides of the argument. I thank you for taking the time to explain the variations and errors from different type of measuring instruments. I find it suspicious that the foundation that Al Gore’s wife has a major influence in, is awarding funds to someone that is promoting her husband’s cause. I feel that is a conflict of interest, no matter how impartial the study was. The direct connection between a promoter of the IPCC’s position and his wife’s foundation could be seen as a financial award for the most sought after answer.
What are your views of the financial award give to Feely from an institute with such a close tie to Al Gore?
And do you feel that measurements taken over such a short time frame can accurately project acidification? Do you feel the reduction in the alkaline, basicity of the water, can it only be tied to the levels of CO2 in the atmosphere and the oceans and voiding any other possible contributing factor?
It’s John Kerry’s wife’s organization that awarded the prize. You’re confusing one rich, polluting Democrat hypocrite for another.
Thanks for the correction. This global warming has been very entertaining and have been following it prior to El nino being blamed on global warming. I grew tired of every weather event being contributed to global warming and devastating weather predictions failing to fulfill their prophecy. Since Global Warming is being pushed by major players, it has become the reason of storms and trends, when climate has changed previously for natural causes. Where I live, it is believed there was a glacier over a mile high. Since the glacier has not returned, I figure the world has been warming more than it has cooled. I see images presented to scare the public, which don’t tell the full story or the correct one. But terrifying predictions and images of change are meant to shock people. I only know of one publicizsed debate between David Sizuki
and Tim Ball. In my opinion, Tim slaughtered David. Which led me to believe that alarmists can’t hold their own in a head to head debate. I have read the ocean retains a heat memory, which Is easy to visualize, that reflects temperatures of a couple of hundred of years ago. So if the glaciers are melting, it’s most likely from the water temperature rather than the air temperature. So how could the rise in temperature over the last 100 years, rising points of a degree on any scale, have any effect on melting the polar ice caps?
I have sent this question to the IPCC and other agencies, I have yet to receive an answer.
The planet continues to warm unabated, and will continue to warm as long as we continue to put more GHGs in the atmosphere.
Basic physics: it works on earth too!
Best,
D
Where I live, it is believed there was a glacier over a mile high (central Canada). Since the glacier has not returned, I figure the world has been warming more than it has cooled.
How did we put GHGs in the atmosphere to melt the huge glaciers?
I’ll quote this from NASA’s website “Between 1998 and 2012, climate scientists observed a slowdown in the rate at which the Earth’s surface air temperature was rising.”
Since your answer is basic, use your answer to describe why has the warming trend slowed, while the levels of CO2 have increased? The rise should be steadily increasing, unless their theory hasn’t taken into account other possible contributing factors. A person could go as far as to say, they might not have it as figured out as they have claimed.
I don’t see it as basic physics or their predictions would have come true, it appears to have some faults.
If their science was perfect, why hasn’t the NIPCC come to the similar conclusions as NASA or the IPCC? I have read the letter of the retired NASA employees that cautioned NASA about making claims about the science Global Warming Theory as true. Why would these people that have no monetary gain for their actions, speak against the IPCC.
There is growing controversy and a line that is told to kids with the hopes of belief won’t work. If it’s simple physics, then I should be able to understand. All I understand is growing doubts within the scientific community.
I live in Virden, Manitoba, Canada, 20 miles from where Maurice Strom grew up, I have worked with his brother. Maurice Strom was one of the heads of the IPCC and has been found responsible for changing reports to present a more certain stance on Global Warming. If the science was strong enough, why the deception?
Comical mention of the NIPCC aside,
The rise should be steadily increasing,
False.
Best,
D
ya, I am still on the fence for a decision. Both sides will present what they feel is most beneficial to win people to their side. I am not for or against the IPCC, NASA, NIPCC, nor the ex-Nasa employees. I am not on any side, but am leaning more towards the people that are speaking out against this being an open and shut case.
I work in the oil industry, but am not worried about my career. I’ll find work should this industry get cut back. Canada has prime areas where hydroelectric dams could be built to supply all of North America with reliable and clean power. But is it better to address penalizing fuels and implement a carbon tax, rather than putting a rush to develop cleaner sources. Governments have the power to implement laws that force companies and citizens to work towards reducing the use of fossil fuels and can implement incentive programs to make going green financially beneficial for the citizens. There are many approaches that they won’t take, cause it is not where the most money can be made (in my opinion).
I have read that the sea levels have risen and further rises are projected. I have also read that Northern Canada is rising due to the weight the glaciers had on them, and a news blurb that Toronto rises yearly as well. If one part of the world is rising, the water will be displaced else where. I thin there are many factors that aren’t being taken into account nor communicated as part of the problem. The beauty of science is it is always developing from many angles.
You DO know, right, Keith, that the NIPCC is a fossil industry front group, formed to dupe people into reading their disinformation, just like another 5-letter acronym with which you may be very familiar?
At any rate, I’m glad your mind is open, and stick to getting your climate facts and news from well-known science sites (not blogs from groups with 5-letter acronyms, especially ones that say OA is a fraud).
Best wishes,
D
The IPCC is a political front group for the UN.
It should rise steadily if their claims of the percentage that is due to humans is true. If I claim that 95% of a change is due to something that is rising geometrically (and only 5% is due to what amounts to noise which I average out over time) then one would not expect a decrease or pause. The long term average is expected to steadily rise.
False.
Best,
D
You will quickly realize that Dano2 is a goof bag. Pay him no heed.
Dano, there is hardly any (no statistically significant) warming in the past 14/18 years in the atmosphere or the ocean surface. The warming should now be in the (deeper) oceans (to be taken with a grain of salt), but the 0.02°C warming in the 0-2000 m ocean layer needs only 1 W/m2 continuous input for that period. The theoretical influence of the 110 ppmv extra CO2 should give already 2 W/m2 extra, and three times that according to the climate models… So where is the difference?
Ferdie,
o here is a little chart that shows there is warming.
o the 0-2000m layer has tons of warming, as measured in J.
HTH
Best,
D
This chart gets around. But is it based on measurement or is it another “Feely like” chart — constructed from models?
Note it makes NO MENTION of temperature. Note it make no mention of CO2 IR.
If the oceans have been warming, it has to be an artifact of more insolation at the ocean surface, as CO2 IR cannot penetrate the ocean skin and therefore cannot warm the oceans.
And yet the oceans are acidifying.
Best,
D
Maybe…. Maybe not. We’ll see how Wallace’s claims hold up under scrutiny.
In any event your comment is irrelevant to this issue of ocean heat content.
Note it makes NO MENTION of temperature
Precious.
The y-axis is labeled for you.
Best,
D
I repeat: no mention of temperature. Joules are not temperature.
This is what makes me suspicious. I’ve taken the liberty of calculating the temperature impact of the chart’s joules spread out over the volume of the ocean. It comes to .06C…..over 60 years. BFD.
But my suspicions is not just because there’s NFW you could actually measure such a minute temperature change, but when I do a further calculation of what W/M2 over the 139mm square miles of ocean surface would be required to produce this many joules, the answer is ~1/2 W/M2. This is coincidentally very close to the alleged ‘.6 W/M2 energy imbalance’ in the global energy budget. So I suspect that all this increased heat content is an artifact of that and MERELY ASSUMED to be occurring. Trouble is, the .6C energy imbalance is more scientifically …… .6W/M2 + or – 17 W/M2.
In other words, I’m pretty skeptical of the chart.
Heat content is measured in J.
My, my. What a display.
Best,
D
You really are the Doofus I’ve always asserted.
Dumb as a stump.
Okay, how do you measure joules?
Good question – I don’t know how they do that calculation, although the floats measure salinity, so they probably use salinity as a factor in mass.
Best,
D
Dano, they measure pressure, temperature and salinity. The pressure is used to obtain the depth of the measurements. From that, the Joules per depth slice are calculated.
In the case of a defective pressure element, the depth doesn’t fit reality, which is seen by a negative pressure reading when the float gets to the surface while sending its data to the satellites. One can compensate the temperature readings for the depth error, but that is far from perfect…
Ah well. Everyone else appreciates them.
Best,
D
“Ferdie”? Boy you are a snot.
Zip it. We go way back.
Best,
D
Dano, the Joule figures look impressive, thanks to an impressive mass of water, but the temperature increase involved is just 0.02°C. The surface didn’t warm in 18 years and how the increase from 5.00°C to 5.02°C in the deeper oceans will haunt us is beyond me.
Some of the ARGO buoys needed corrections of 0.07°C and beyond, because a defective micro pressure sensor…
More important, even if that warming is real, the increase in temperature need an average small net difference of 1 W/m2 in radiation. The theoretical influence of 30% more CO2 is 2 W/m2. According to the models, including (lots of positive) feedbacks, around 6 W/m2. Where is the rest?
The difference between cloud cover and clear sky under sunlight is average 120 W/m2, 1% difference in cloud cover makes 1.2 W/m2…
Sorry, needed to add that the 0.02°C was over the past decade of better ARGO data. The data before ARGO have much larger error problems and some parts were more “corrected” than the trend…
I didn’t read the comment of David Russel before mine was posted, but he shows similar problems with the ocean data. Same problem with the satellite data that should show the radiation imbalance: the corrections of the satellite data (drift, measurement device deterioration,… (~6 W/m2) are a lot larger than the difference one likes to measure…
Right. You want to measure in J because of the gigantic inertia and volume of water makes C difficult, and doesn’t allow you to capture the radiative imbalance in W/m^2.
/basic
Best,
D
Dano, we are talking about ocean surface temperatures:
http://woodfortrees.org/plot/hadsst3gl/from:1998/plot/hadsst3gl/from:1998/trend
There is no statistical significant warming, only a lot of noice from ENSO, including the 1998 super El Niño and 1999 La Niña and the 2014 would-be super El Niño, which diverted a lot of hot water to the NE Pacific Ocean.
As far as I know, ENSO still is a 100% natural phenomenon, not influenced by greenhouse gases (but maybe by the sun).
Oh, now we are talking about SST?
If you don’t succumb to starting point bias (that’s cherry-pick for the rest of you), then the SST is warming too. 2014 is the warmest SST on record, so it continues to warm.
Thanks!
Best,
D
Dano,
Have a better look at that chart: the warming 1901-1945 was as fast and high as the warming 1970-2000. There was 5 times more CO2 increase in the second period as in the first. In between there was a small cooling with increasing CO2. Since 2000 (or even before) there is statistically no warming, only noise caused by ENSO (including 2014), as good as that was the case for 1945-1970. Over the same period we have reached record emissions and levels of CO2. Thus what is the effect of CO2?
Over 95% of all climate models currently fail the real (lack of) increase in temperature: their “projections” are now already (much) too high, let it be in 2050 or 2100.
The ocean heat content, as far as reliable, shows only halve the warming than physically expected from the increase in CO2 and one sixth of what is expected by the average of climate models.
More and more articles in the scientific literature show a lower sensitivity for 2xCO2 based on empirical facts than the models expect: 1.0-1.5°C at the end of this century for business as usual…
SST continues to warm to the point this year is the warmest.
And Ferdie, you trot out the old, tired ‘models can’t project, and even put “projection” in scare quotes? I’m going to have to start accumulating points off of you, including the laughable ECS wish. You sound like you are mindlessly parroting drivel seen on Watts.
Come now.
Best,
D
Dano, I have a habit to look directly at the source of what is written at any side of the fence. That makes that I am as critical for this article (and a lot of articles at WUWT) as for what the IPCC writes. Models don’t have any value until proven right (I have 34 years experience with models in the chemical industry, some were useful, some were disasters). Current climate models have no value at all, as they “project” (their projections are even sold as predictions) temperatures which are today already higher than reality shows.
Several of the low sensitivity articles in the peer-reviewed literature were already mentioned in the latest IPCC report. Many followed since then, all based on empirical data, not models. But the IPCC only mentions the over 3°C warming for 2xCO2 from the models, including the projected resulting disasters.
The fact that the warming of the oceans is a factor 2 less than the theoretical warming by CO2 alone (without feedbacks) and a factor 6 less than the average of the models for me is a sign that the empirical estimates are not far off…
The current warming of the oceans is entirely in the NE Pacific as part of a would-be El Niño, that still is an entirely natural oscillation…
Ferdie, I have no idea why you need to put projections in scare quotes and pretend that projections are sold as predictions. It is a mystery.
And last I checked, a well-known
denierdisinformer – poor hapless Willis – tried to whine that all the heat was in the southern ocean so I have no idea what your comment is about.Best,
D
“The planet continues to warm unabated” False, it abated for 18 years. “and will continue to warm as long as we continue to put more GHGs in the atmosphere.” Yeah, learned that in high school about 40 years ago. All other things being equal an increase in CO2 (a greenhouse gas) will increase temperatures. So what? The dispute is on how much it will increase, not that it will increase.
The alarmists claimed that they KNEW exactly how much was due to CO2 based on a rate of temperature increase. A rate of increase that had been repeated many times in the past by natural variation. Which is why they were totally surprised by the “pause”. Assuming what they did there could be no pause because natural variation could never account for more than a tiny fraction of any increase. The fact that there has been a pause for 18 years shows that natural variation, at a minumum, can account for 50% of temperature change, and likely more.
They never really had any justification for estimating the speed at which earth’s temperatures would respond to increased CO2 in the first place. Even if you were to correctly calculate the end equilibrium temperature there is no easy way to determine how it would flow through the system and what negative feed backs it would cause. They are being heuristic in their claims to knowledge.
It has not stopped warming. 2010 warmest year on record, 2005 second, 2012 record low Arctic ice, last 10 years lower trop temps warmest in record, highest SSTs highest in records, 2014 likely warmest GST on record….
etc.
Best,
D
Cherrypicking Dano. There were other years in there and the trend has been flat for 18 years. If 2015 is cooler again it could be a 20 year flat trendline.
Not cherry-picking at all, but that was funny, I laughed!
In fact, using only 18 years is cherry-picking, as you can see here: http://woodfortrees.org/plot/gistemp/from:1950/to:2014/plot/hadcrut4gl/from:1994/to:2014/trend/plot/hadcrut4gl/from:1995/to:2014/trend/plot/gistemp/from:1996/to:2014.83/plot/hadcrut4gl/from:1997/to:2014/trend/plot/hadcrut4gl/from:1998/to:2014/trend/plot/hadcrut4gl/from:1999/to:2014/trend/plot/gistemp/from:2000/to:2014/trend/plot/uah/from:1998/to:2014/trend/plot/rss/from:1998/to:2014/trend/plot/hadcrut4gl/from:1998/to:2014/trend/plot/wti/from:1998/to:2014/trend/plot/gistemp/from:1999/to:2014/trend/plot/gistemp/to:1998/from:2014/trend
As you can see, not flat.
And since 2014 will likely be record year, then El Nino kicks in, your wish for 2015 is cute.
Best,
D
That chart shows no statistically singificant warming for a decade and a half, and el Nino ended last year. Thanks for demonstrating how out of depth you are.
It shows warming. November closed the David Rose Hole, so the warming is statistically significant.
And the oceans are acidifying.
Best,
D
notrickszone.com – post by 40-year NOAA senior scientist: NOAA scientists are instructed to ignore natural cycles.
There are so many, ” rich, polluting Democrat hypocrite[s]” that one needs a baseball like scorecard to keep track of them.
Keith,
You need to make a differentiation between what science says and what politics say. Even if it is sometimes mixed in the same person…
At one side you have the scientist Feely, who has done a tremendous amount of good work together with Sabine, Bates, Takahashi and many others to collect as much ocean data as possible about seawater composition at different depths and bio-life. On the other side, Feely and many other scientists are either convinced of harmful global warming/acidification or need to pretend so for their carrier…
I have the impression that in the US, it is mainly a matter of Conservatives vs. Democrats (in Europe there is hardly any political opposition against the idea of harmful GW).
Then you have politicians which profit of any hype, no matter what. In this case Al Gore is the prime example of an opportunist and a hypocrite if you look at his own energy use…
I think that John Kerry, just like many politicians like him, has very little knowledge of the scientific background of greenhouse gases and global warming, but as far as I know, he seems really believing that more CO2 is a problem…
Anyway it is, as usual, custom practice to give money/prizes to people and organizations that you like as similar minded and/or what you like to hear. In this case that the oceans are “acidifying”. Which is scientifically true, but made far more scary (for political reasons) than is to be really feared. But I don’t think that that will influence the results of what Feely and others have found and published.
Worse is that mainly research into the role of humans in global warming is subsidized. That corrupts science much more than one may think. There is hardly any research (because hardly subsidized)into the role of natural variation in the recent (non) warming: sun, clouds, ocean currents,… all have much more influence than is currently implemented in climate models…
About the drop in pH: there are several possibilities to lower the pH of the oceans, like undersea volcanoes (more SO2, HCl and other strong acids), but if that was the case, the total amount of dissolved inorganic carbon (DIC) would drop with reduced pH, expelling CO2 into the atmosphere. Now we see the reverse: DIC increases with reducing pH. That means that more CO2 is pushed into the oceans, in quite exact ratio to the increase in the atmosphere (that is governed by Henry’s law). That is what is measured over the past 30 years.
Ocean carbon chemistry was established over 80 years ago and is quite straightforward: if you have a few accurate measurements, you can calculate all the other parameters, including pH. The calculation in general is more accurate than a direct pH measurement with electrodes. In the case of historical CO2 levels, it is possible to back calculate the pH from ancient levels, like the beginning of the industrial revolution or even during ice ages…
Wallace only did use the glass electrode pH data and ignored the differences in sampling place and time, which makes than his pH “trend” has no meaning at all… And he ignored the calculated pH from the past and current which show more reliable pH levels.
There was no fraud from Sabine or Feely or the many others which measure(d) a lot of ocean items over the years, only a wrong interpretation of inaccurate pH data by Wallace…
Thanks again for taking the time to explain.
I have always thought the IPCC has tried to tie Global Warming to pollution (being CO2) and has been based more on politics than science. I support the idea of investing in developing the science of weather and climate. I strongly support developing less polluting energy sources. Which are easily attained with a small percentage of the money being invested in science. Manitoba and British Columbia are prime locations for potential hydroelectric dam, which are a source of constant reliable clean energy that could supply most of our two countries. Political decisions are usually based on monetary and/or popularity gains.
Ferdinand, what is your opinion of increased co2? Is it good or bad for the world?
thanks again for taking the time to explain and no further dialog is required. I would like to see opposing parties such as the NIPCC and ICPP combine their efforts in a study and come to a concussion that accommodates all parties concern. I think then we would have some science. Unfortunately, I feel that parties are perusing an agenda rather than an answer. The problem is trying to determine which agenda is more geared towards mistruths. I think I have an answer to that question at this time. I realize that I will never understand the complexity.
I feel that certain parties that are voicing their concerns, that have no monetary or political gain (to my knowledge), are the ones that I put faith in their honesty.
I have also decided to donate a few hundred dollars a month to a group that is reputable and not receiving any government funding. What scientific groups do you feel are independent with the least amount of bias?
As some in an unguarded moment have said, “The problem is trying to determine which agenda is more geared towards mistruths.” The answer is obvious.
ya, I agree. I am on the side of the deniers so far. Too many experts with everything to lose standing against the IPCC. Then retired people with nothing to gain or lose voicing their concerns against. Unfortunately, NASA with the ability to mistakenly falsify data is responsible for collecting much of the data.
They also have loads of money and the MSM to make their case for them.
Ferdinand, you are so wrong, so often, on so many points, that I wish you would take some time to read in full the 11 posts I have created over a period of more than a year on this topic at http://www.abeqas.com/category/ocean-ph/
And unless you truly believe that the practice of omitting most of the data should not only be tolerated, but celebrated and handsomely rewarded, then please sign the petition at the portal
http://www.ipetitions.com/petition/restore-the-worlds-ocean-ph-measurements
I don’t have time to read through all this. Could you please indicate exactly which of Ferdinand’s claims you dispute? I know that CO2 goes into solution faster with cold water for example. Did you make adjustment for temperature? Did the original paper you criticize do that too? Just pointing at your web page isn’t much of a response.
Interestingly, a science journalist asked him these same things and Wallace didn’t want to answer the journalist’s questions either.
That’s a pretty big clue.
Best,
D
It is actually very simple. The variability in a pH electrode/meter is + or – .02 standard units. The error variance in the pH readings (data that is asserted to be an increase) is less than the measured variability of pH (= or – 0.05 standard units) in the record …the signal (data increase) is lost in the static, as previously stated. As far as acidification of the ocean goes, and in addition to the excellent points made above relative to the existing ocean pH and the data record, I would ask if any of you have ever done a titration in your chemistry courses and calculated how much of an acidic titrant of a certain molarity is needed to change the pH of a basic solution of a certain volume by 1 standard unit? If so, you will quickly realize the volumes and concentrations you are talking about when you suggest that a minor variation in CO2, also a minor component of our atmospheric gases, is enough to overcome the CO2 absorption rate of the various plankton and other biological and chemical components in the ocean to then cause a world wide reduction in the pH of the oceans, which have a total volume of 1,347,000,000 cu km (more or less).
” to then cause a world wide reduction in the pH of the oceans, which have a total volume of 1,347,000,000 cu km (more or less).” – particularly if you choose to ignore the effect of carbonate chemistry on pH.
Mike, I have looked briefly to your pages. My suspicion is only confirmed: the pH data you have compiled for each year are for entirely different cruises in different parts of the oceans, sometimes east-west sometimes north-south, some in the Pacific, some in the Atlantic and many in the Baltic…
For all: compare the cruises for each year:
http://www.abeqas.com/ph-1990s/ and
http://www.abeqas.com/ph-2000s/
As the pH does change a lot with latitude, you are comparing averaging data from entirely different regions of the earth which are not comparable at all, except if you should look at the trends within small parts of the oceans where the results of different cruises over the yrars are compared.
That is what Berényi Péter has done: he has looked at 5×5 grid boxes and found:
—–
If only grid boxes with at least 20 years of data are considered (204 items), ocean pH trend is -0.002±0.031/decade, therefore the null result is reasonably robust.
I have given a try to grid box / month combinations with at least 30 years of data (81 items). The result is +0.003±0.026/decade, therefore the null result is incontrovertible.
—–
The trend measured by Sabine over the past 30 years was 0.013±0.007/decade, which is within the error margin of all (GE?) pH measurements, even as the “null result” from Berényi Péter therefore is broken (the pH change caused by CO2 is very small).
The Japanese did work even more accurate:
http://www.data.jma.go.jp/kaiyou/english/oa/oceanacidification_en.html
—–
Thus the problem with your compilation is the lack of correction for latitude and season, as both give far more pH change than the trend where one is looking for.
“… the 7 current fixed stations ..”
The small sample size is disturbing.
“.. most of the [older] samples were taken randomly at different places and in different seasons (which may give differences of up to 1 pH unit)”
Which could be adjusted for. Not sure if Wallace did so but his paper discusses these issues.
“That Wallace’s compilation is wrong can be simply proven ..”
But then you don’t do this. You merely show that assuming that short term atmospheric CO2 is the only factor effecting pH will contradict Wallace’s results. Which is not surprising because he claims this is not the case with a complex ocean environment.
“…but 0.3 pH units for the compilation of Wallace. The latter is chemically and physically impossible, as that need some 300 ppmv CO2 increase in the atmosphere (or acid equivalent) over the same period…”
It’s only “impossible” in some isolated test tube environment which won’t have things like termoclines, currents, and large geological buffers.
I don’t buy the “simply proven” claim. You need to show more than you have because there is obviously other factors besides atmospheric CO2 that influences ocean PH. If a 300 ppmv CO2 increase in the atmosphere is required to get a change of 0.3 pH units then how can seasonal changes cause differences of 1 pH unit? Seems that would require, according to you, a CO2 increase about 3.3 times higher (a 1000 ppmv CO2 increase in the atmosphere). Obviously the ocean isn’t a test tube.
Considering the oceans are highly buffered, and lay on top of large solid deposits of calcium carbonate it is pretty clear that factors like upwelling are going to effect pH measurments. Thus one would expect processes like the PDO to have a large effect. Having only 7 stations means that occilations in current flows could effect surface pH dramatically over short periods. In fact, I don’t see how such changes in current flow could not have an effect on surface PH.
Seems to me you are assuming what you are setting out to prove (that CO2 has a certain effect in an actual complex ocean environment) in order to “simply prove” Wallace wrong. That’s completely invalid. That doesn’t mean Wallace might be proven wrong in other ways but you can’t do it this way.
Brian, all good questions…
Sorry for the delay, there were too many of discussions about the same subject at WUWT and sometimes I have my family duties…
1. The sample is small, but rather distributed over the different oceans, be it with only one station in the SH (New Zealand). See the chart at:
http://www.tos.org/oceanography/archive/27-1_bates.pdf
Besides carbon chemistry these sites collect a lot of other data about bio-life near the surface and drop-out into the deep oceans.
2. As far as I can see, Wallace didn’t compensate for temperature, place or season (bio-life, which changes DIC and thus pH).
3. All other effects are quite recurrent in the time frame of seasons. If you look at the different graphs in the reference of 1., the seasonal ups and downs largely level off after a full cycle. Short term oscillations due to volcanoes (1992) or ENSO (1998 super El Niño) are covered. What is not covered is longer-term oscillations like PDO, NAO,… But if the huge 1998 El Niño has hardly any effect…
4. While the ocean is complex, the influence of CO2 on every part of the oceans is straight-forward: if CO2 increases in the atmosphere, that pushes more CO2 into the oceans (or decreases the releases, with the same effect on local DIC). The same for a global temperature increase or a global increase in bio-life.
The point is that a drop of 0.2 pH unit from one year to the next of the total volume (0-200 m) open ocean surfaces requires a massive change in one of the influences. Neither temperature, bio-life or CO2 can do that for year by year changes.
The combination of temperature and bio-life can do that over the seasons, but that is e.g. at Bermuda a 8°C change with abundant algal blooms in spring. An 8°C average temperature change from one year to the next for the total ocean surface layer is as unlikely as a 200 ppmv CO2 change in the atmosphere…
Basic chemistry: CO2 absorbed into the ocean, carbonic acid. Ocean acidifies.
You can’t wish or pretend or deny that away.
I’m sure you can start a campaign to sow doubt, that much is true. But you can’t FUD away basic chemistry. This meme won’t have legs and get spread except among the very few of the dimmest bulbs, in the dim corners of the Internets. Pacific shellfishers beat you to the punch.
Best,
D
Annual human CO2 emissions becoming ocean carbonic acid: 1 part acid per 107 billion parts ocean. Not material. The equivalent of a single drop of acid an a swimming pool 20M X 6M X 2M….. actually 40 such pools.
And yet the oceans are acidifying.
Best,
d
I’m going to withhold judgement until we see how well Wallace’s assertions hold up under scrutiny.
I seriously doubt you comprehend what he is claiming. He’s NOT saying pH doesn’t change over time, but rather that the changes show no trend related to human CO2 emissions and are explicable more in terms of changes in the cycles of deep ocean currents like the AMO/PDO.
He is wishing that he is showing the changes show no trend related to human CO2 emissions because his comical averaging is fundamentally flawed.
Best,
D
You are now spouting nonsense. I’ve had my say.
Everyone else understands what he did wrong, so thank you for putting a lid on it.
Best,
D
More blather from the blather-puss.
Free advice, Dumbo:: Do not try to understand. You don’t have the equipment.
The Feely-Sabine ocean acidification ignores 80 years of real-world data that show no acidification trend
Whoops – they “forgot” to show the trend – here it is:
http://www.eea.europa.eu/data-and-maps/figures/decline-in-ph-measured-at/ome01/CC-vulnerability_Fig_3-1_OME01.eps.75dpi.gif/download
Hmmmm. Acidification. What could be the issue when the subhed implies otherwise?!?!?!?!?
What do all the other data say?
o http://www.data.jma.go.jp/kaiyou/english/oa/tr_pH_WINTER_137E_en.png (src)
o Effects on ocean life already measured.
o More to learn here/
o More to learn here
o More to learn here/
o Readable reportage for the layperson here note how all of this contradicts this article.
All the other data from across the world say acidification. How odd. That’s not what is implied in this article. Private industry is looking to profit from solutions to acidification too.
Best,
D
Agreed, except on one point: there is no negative effect on ocean life measured. The article is about the theoretical impact in 2050, which still is in the future.
Theory and reality may differ a lot, as corals show more growth over the past 50 years than in the centuries before and most calcifying species were thriving enormously during the Cretaceous with CO2 levels 10-12 times higher than today, witnessing the white cliffs of Dover (UK) and many thick chalk layers all over the world… See:
http://www.biogeosciences.net/4/323/2007/bg-4-323-2007.pdf
there is no negative effect on ocean life measured.
Upthread I included two links that disagree.
Best,
D
Many of the Alarmist comments disagreeing with Marita Noon’s
and Michael Wallace’s comments seem to me to display an amazing ignorance of
facts and common sense.
As a fisherman, some of the best fishing areas of the
country are found in estuaries where river runoff causes brackish conditions,
and where pH changes from nearly acidic in high river flow conditions to
distinctly alkaline when low river flow and strong high tides dominate.
Estuaries that come to mind are Texas’ Galveston and Corpus Christi Bays and
Albemarle and Pamlico Sounds of North Carolina.
These estuaries are regions of high fish food production such as shrimp,
and offer great sport fishing opportunities.
The Alarmists seem to lack knowledge of 100-level courses in
Chemistry and Geology, understanding of the history of the earth’s temperatures
and CO2 concentrations and familiarity with recent reports and studies of
actual measurements of CO2 variability.
With a pH of well over 8, ocean water is clearly alkaline http://upload.wikimedia.org/wikipedia/commons/thumb/2/23/216_pH_Scale-01.jpg/640px-216_pH_Scale-01.jpg
and is in no danger of becoming acidic. Those who use the term “Ocean
Acidification,” including PhDs Feely and Sabine are clearly ignorant of Chemistry
101 and engaging in a new meaning of “Political
Science.”
Data on global temperatures over geologic time are available
at Christopher Scotese’s Paleomap Project web site, http://www.scotese.com/climate.htm.
Yale’s Robert Berner has published data on CO2 vs. Geologic
Time, the GEOCARB data set, http://ajsonline.org/content/301/2/182.abstract so it should be common knowledge that at the
present we are at a distinct minimum of global temperature and CO2.
The explosion of marine life in the Cambrian seas 550
million years ago with the global success of Trilobites and Mollusks with CO2
in the range of 7,000 PPM compared with today’s 400 PPM should give pause to
the Alarmists cries of CO2’s negative impacts on marine life.
Most of the Mesozoic had temperatures about 22C in
comparison with today’s 13C and CO2 about 2,000 PPM in comparison with today’s
~400 PPM. Clams, crabs, shrimp and
lobster have been with us since then, so a thought that a return of a little
more CO2 to the oceans will result in the catastrophic loss of marine life
proposed by Feely and Sabine is farfetched.
Feely’s statements that coral reefs are likely to suffer
with increasing CO2 and temperatures seem unfounded when we observe from
Hopley’s Encyclopedia of Modern Coral Reefs that the very successful staghorn
or branching coral Acropora
has been with us for over 60 million years, since the time when global
temperatures were almost 10C warmer than today and with 1000 PPM CO2. The
popular literature also contains information that places the Feely document in
context.
Matt Ridley notes a study from UCSD showing that at Palmyra
Atoll, a typical diurnal variation of ocean pH is from 7.9 to 8.1, a range
higher than Feely shows over 100 years. Ridley’s 7 Jan 2012 piece in the Wall
Street Journal notes “the noise is greater than the signal,” and the possible
slow reduction of ocean pH “certainly does not merit apocalyptic
headlines.”
A recent and topical publication, High-Frequency Dynamics
of Ocean pH: A Multi-Ecosystem Comparison, by Hoffman, et al, is
instructive into Ocean pH changes on a short term basis. Hoffman’s team of
researchers conducted experiments and use a 30-day time series to document
significant pH changes. Data from that paper are instructive to the audience
and specifically to the Alarmists.
A kelp forest off Santa Barbara, CA showed a pH range from 7.7
to 8.2 over a 30 day period, which is five times the loss showed by Feely over
a 100 year period. Elkhorn Slough off the California coast showed a spiky
variation from 8.4 to 7.4 pH units over a similar 30-day period. The extremes
that this group showed were from 8.1 to 7.0 pH units at the CO2 vents off
Ischia, Italy.
Clearly the near shore variations in Ocean pH are
significant and show that concerns over CO2 changes in the atmosphere are
overblown, especially when Feely uses demonstrably alarmist rhetoric “excessive
carbon dumping into the atmosphere.”
The email exchange between Michael Wallace and NOAA’s Feely
and Sabine where Michael asks for measurements, not model data, is instructive.
The reply by these government employees is clearly bullying, not collegial or
professional.
I would invite the Alarmists critics to attend the next
International Climate Change Conference which will be held at Washington DC
next June, 11-12 http://climateconference.heartland.org/. If you Alarmists are so sure of yourselves,
contact James Taylor and maybe you can present your findings there.
The web address for the Hoffman, et al, article is http://www.plosone.org/article/info%3Adoi%2F10.1371%2Fjournal.pone.0028983
The data plots are at Figure 2.
The ocean is acidifying.
Despite your little typing spasm trying to imply otherwise.
HTH
Best,
D
Robert, you are right that the very slight reduction of pH in seawater probably has zero impact in marine life, certainly not on fish and very little on calcifying organisms, as these all evolved in much higher levels of CO2 and very different temperatures, as the white cliffs of Dover witness…
But that doesn’t imply that there is any fraud in the point that NOAA (and many others) show that there is a small pH decline (0.04 pH unit) in all open oceans over the past 30 years. And that the compilation of Wallace is just good to be thrown in the waste bin: inaccurate method, different seasons and places.
Before accusing anybody of fraud, one should be extremely sure that the data on which that claim is based are correct and show what you claim, not what you like to claim…
You replied to me instead of poor Robert, Ferdie. I’ll agree and point out one little thing: these all evolved in much higher levels of CO2 and very different temperatures is true, but these animals are adapted to recent conditions.
Best,
D
I’m amazed. Dano2 finds an acorn. Good point.
I believe Wallace’s accusations are based on the fact that the testimony IGNORED the available data.
As someone once said, “…I know how difficult it is to even make a model of a simple process where most, if not all, physico-chemical parameters and equations are exactly known.”
Using a model that ignores 80 years of available data seems to me (and to Mr Wallace) to be the height of folly.
the testimony IGNORED the available data.
False.
Best,
D
Except that the seawater chemistry calculations are already done for over 80 years. Any calculated pH from other known ocean values is more accurate than the pH measurements made by glass electrodes. Modern direct measurements use colorimetric solutions to determine pH down to 0.001 unit…
The problem with the graph made by Wallace (not shown in this article) is that he lumped all available glass electrode pH data together, no matter the distribution of the samples over the places or seasons where/when they were taken in a certain year. Latitude can make a difference of up to 1 pH unit and the seasons add up to 0.2 pH unit to that. As the whole theoretical drop in pH is not more than 0.1 pH unit over 160 years (of which 0.04 pH unit, measured since 1984), what Wallace has done has no value at all.
On the other side, Feely did show the faint theoretical trend for the period 1850-1984 (~0.05 pH unit). If he would have added all the measured data of before 1984, the theoretical trend would be largely within the cloud of measured data.
So, in this case, there is no “hiding the decline”, as the (theoretical) decline is much smaller than the error margin of the measurements. There is no pHraud whatever and Sabine rightfully ignored the older data as these can’t show the real trend, no matter if that is up or down…
Your ‘typing spasm’ is just an unsupported assertion.
False. I have the support elsewhere on this thread.
Best,
D
Your comment is still just an unsupported assertion. The fact that you have to allude to some other comment only affirms that fact. Plus your comment totally unresponsive to the comment you were replying to.
Your comment is still just an unsupported assertion.
True, except for the fact I supported my assertion.
So who knows what you are babbling about.
Best,
D
I just happened to run across this and I guess I’m 2 years late, but your response to Mr. Endlich’s comment is so typical of followers of the alarmist religion that I just felt compelled to comment. I notice that your sarcastic remark is just that. You had no argument with Mr. Endlich’s facts or references, but your alarmist religion tells you that the ocean is acidifying. As I said, this is typical alarmism, and it explains why alarmists will never agree to debate the subject, because they have few if any facts to back up their claims.
What IF Obama’s climate change policies are based on fraud……WHAT IF? Given his track record – in particular look at all the bald face lies he told us about Obamacare (and now we find out that he know there were no cost savings to be had…..and health plans would indeed be generally un-affordable)……….I think it is a guarantee that his climate change policies are a fraud as well.
If AGW wasn’t essentially controlled, fostered and paid for by the government it’s proponents would be in jail for running a RICO inspired organization.
It looks like Mike Wallace has simply averaged the data for each year in the WOD database. This need to be adjusted for latitude, since ocean pH varies quite strongly in a gradient from the equator polewards. The early measurements (1910-1914) are north Atlantic only.