How times have changed. When I was a freshman in high school, we had the first Earth Day. There was a 1-period assembly, and the drama club, with the aid of the Mainland Regional High School Cheerleaders, put on a play, I will never forget it. The Cheerleaders all dressed up as trees and sang Steppenwolf’s “Monster” Except they changed the lyrics :
America, where are you now
Don’t you care about your sons and daughters
Don’t you know we need you now
We can’t fight alone against the monster
to:
America, where are you now
Don’t you care about your Parks and Waters
Don’t you know we need you now
We can’t fight alone against the monster
After seeing the cheerleaders dressed as trees, I decided I would love to become a tree hugger myself. However, 5 foot 2 165 lb freshman nerds were not eligible to be tree huggers in those days.
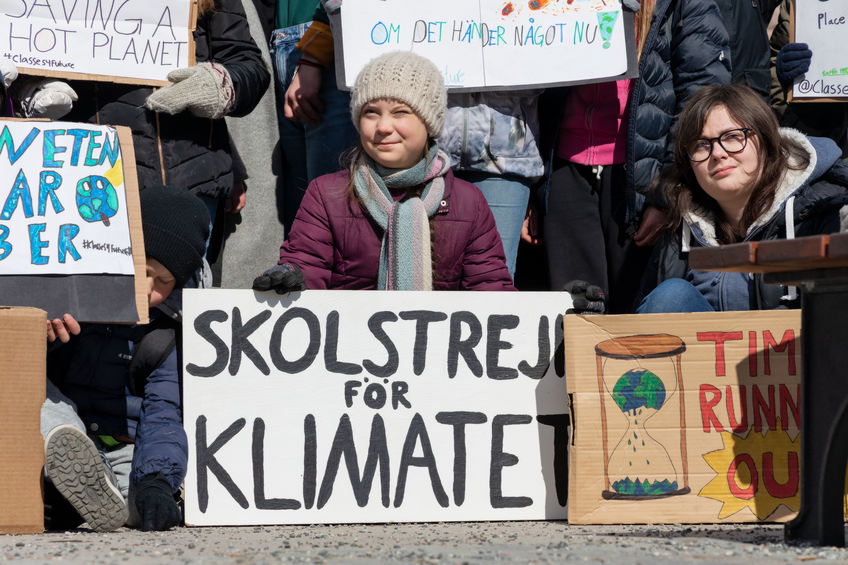
But times have changed and here we have the Youth of Today driven into a frenzy by the idea that we are faced with a climate crisis.
But what do the facts show? I assume facts still matter in education and freedom of speech.
So in an effort to help out, being the tree hugger I still am ( I love clean air, water, etc) I would like to inform the youth of the planet about what they are striking about, I thought I would share several of many metrics that question the authority of those telling them the world is spinning out of control into a co2 driven atmospheric apocalypse, Assuming they can read charts and have an open mind, perhaps some before trudging off and missing class, they will stop to ponder these charts
I will be brief, Attention spans aren’t what they used to be.
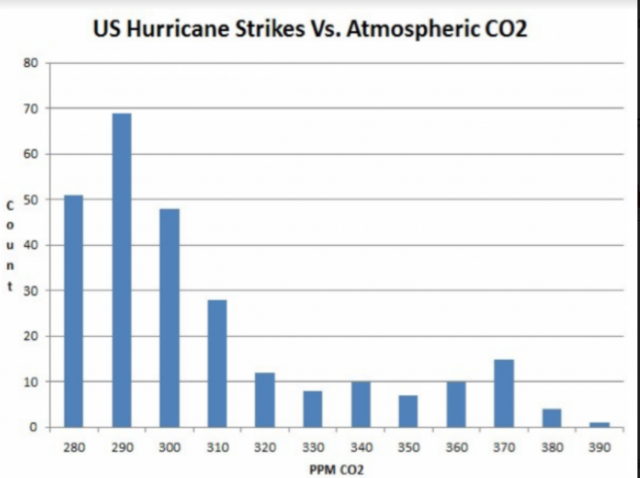
Let us go to major hurricane hits per decade:
.png)
Heres a chart that means absolutely nothing because co2 has nothing to do with hurricane intensity so its just fun to show people. Hits were greater when co2 was lower:
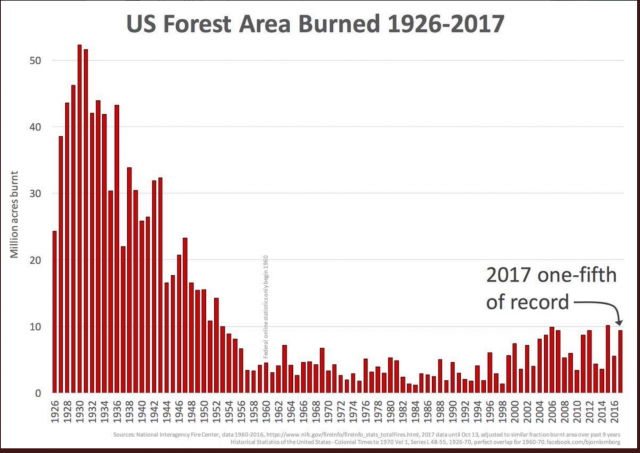
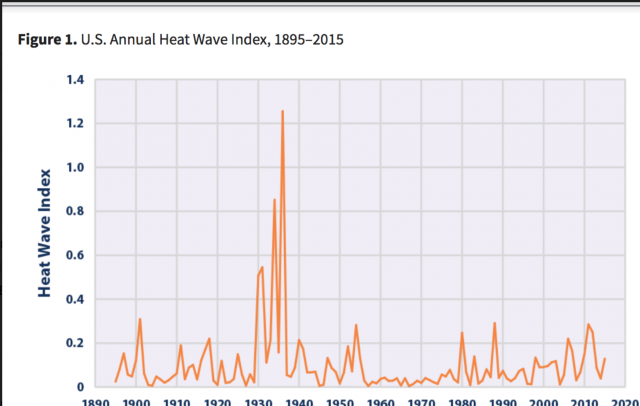
Wildfires were worse at the turn of the last century ( this year btw is well below the running 10-year average:
.jpg)