
This is not a comment on the COVID-19 situation, just an attempt to draw attention to the model mayhem that goes on in weather and climate. The March 26 comments by Dr. Birx on the modeling with this certainly raised some eyebrows. While the general public is now following this all the time and so is now understanding model variance, they are unaware for the most part of what has to be dealt with in weather and climate.
My real job is not to show up on TV or write blogs or books, etc.
A) I have a “face for radio” as one of my best friends have told me and
B) I am an editors nightmare.
But what I do is advise major companies, for energy (any energy, wind, and solar has to be forecasted also) to financial entities, de-icing companies in Europe, retailers, construction and trucking, basically anything and everything.
In the global economy the weather has its fingers in everything, and so many models are out there, (over a dozen daily ones alone from many countries) that very rarely agree with each other.
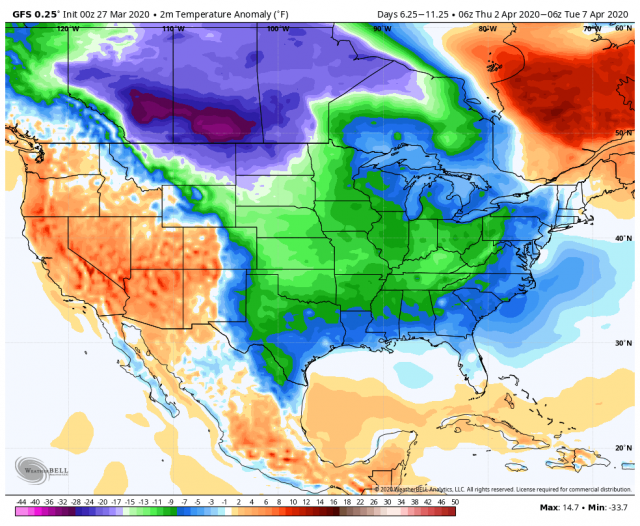
Take March 26. The 12z run of the US model looked EXACTLY OPPOSITE of what we had forecast with a massive warm spell the first few days of April.
.png)
.png)
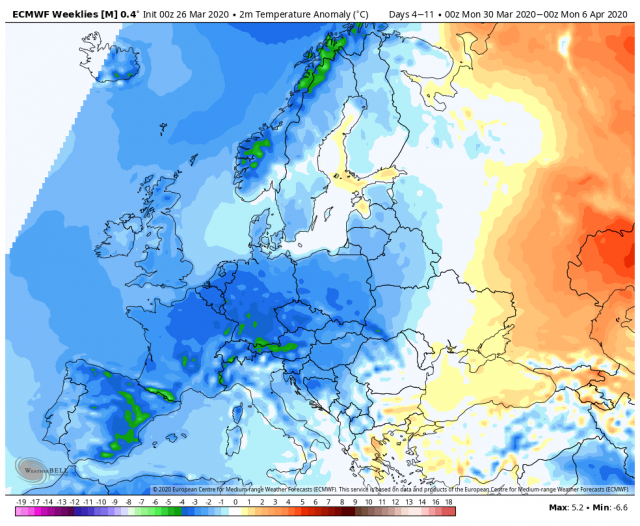
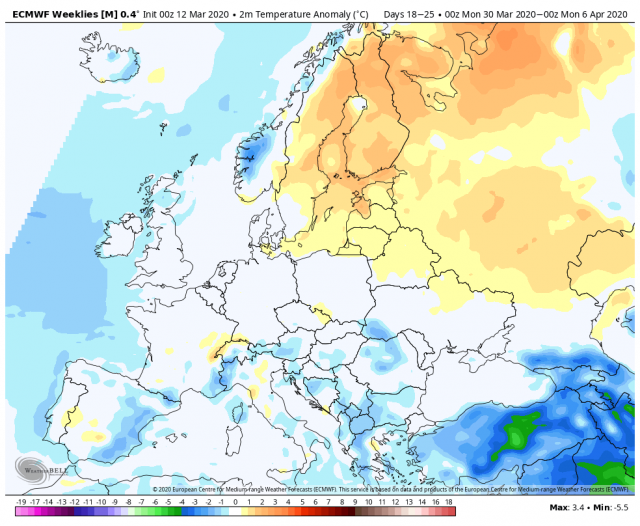
The current cold wave in Europe forecasted to open up April..
For we are always what our situations hand us. It’s either sadness or euphoria.
But we have to be handed the situation, and models are not reality, but virtual reality. If you treat them as reality, its when wild swings can occur. As a bonafide snow lover, I have never seen so many major storms forecasted 5 days out for where I live which turned out to be nothing. So if I bought the model, it was euphoria at the time, only to end up with sadness.
Now lets step to climate. Knowing how bad models are, why would you buy models that have been wrong so far? It is true it has warmed, but let us take a look at the model forecasts and reality.
From Dr John Christy:
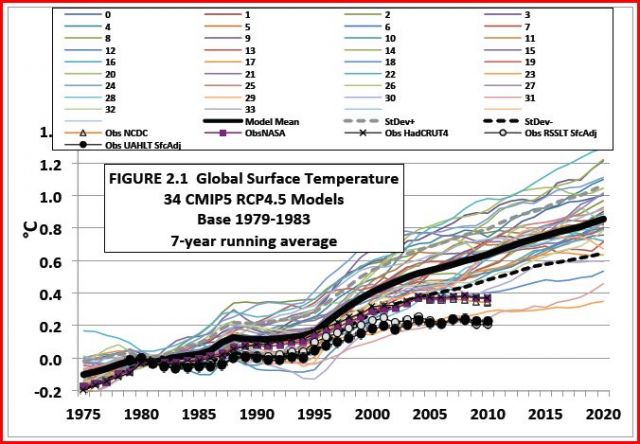
The bottom deep line is the Satellite temps of the earth, the gold standard of observation this era. This was through 2010, there has been an upturn in relation to the models you see (only 3 of them) that have been so close to that. The thick box line north of that is Nasa. The solid line is the consensus of all models.
Why would you base claims of catastrophic warming on faulty modeling that has factored in CO2, rather than reality? (Supposedly the best model was the Russian model, which had the least CO2 feedback factored in) Compressed timelines also exaggerate the problems.
Take the chart above, suppose the 5 year intervals were twice as long on the chart, so the chart covered more space and you can see individual increments better. The change would be even less imposing. What can not be argued is that close to 97% of the models (amazing how that number is given to the so-called 97% “consensus”) are much too warm. But there is no Dr. Birx on TV that can point this out, even though man-made climate change agenda people are trying to portray their issue as being as dire or more dire than what we are facing now. How in any real-world objective look, is that even a consideration, unless you are a zealot pushing an agenda for a different reason?
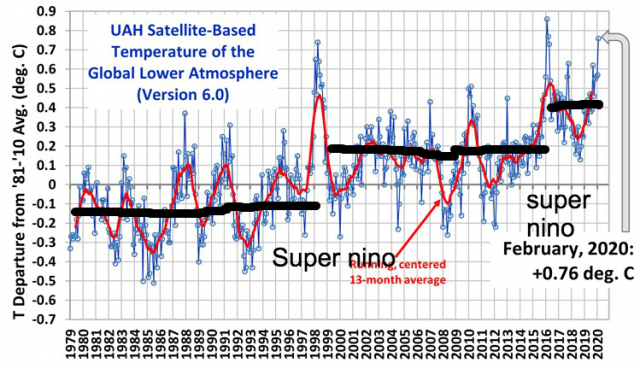
A close up from Dr Roy Spencers site reveals that Super El Niño’s are responsible for the warming that takes a long time to wash out. While one can draw a line from the start to finish with a steady slope rising, a tiny increase of WV has the greatest effect where it is coldest and driest. Which is just as reasonable, and this is due to the nature of water vapors effect on temperature when it becomes more evenly distributed over the years. (Simple correlation) Thus, when a Super El Niño comes along and pumps that into the air, there is a step up in the temperature to a new “pause” level higher than the one before..This is my hypothesis and it was first opined before the Super El Niño of 15-16.
Disclaimer: I do not know if Dr Spencer agrees with me or not on the hypothesis. But my point is you can draw the trend from coldest to warmest or looking into the details of how that happens. We had an increase of close to .3C after the 97-98 Super EL Niño. The increase after 15-16 is about .2c.
BTW here is Dr Spencer’s site.
The moral of the story: models can’t be trusted as we don’t know everything that goes into them and the WEIGHTING of the variables, co2 included, or the code used to create the model. . The overall trend is up to no doubt, In addition, it may be a step-up function and since it has occurred with super Ninos and co2 increase has been steady, it is much more likely that the super Ninos are responsible for these increases, not co2. The cause of such events are hard to pin down, but one thing I have pointed out many times is contrary to trapping hot spot ideas over the tropics, the atmosphere has been drying out leading to less cloud cover, more incoming radiation in the ENSO regions, which could act to retard cooling, But that is a solar-ocean connection not a co2 connection. Given man only is responsible for 25% of the co2 in the atmosphere and nature has the other 75%, much of that in the oceans, it seems like nature far outweighs man in this situation, So trusting models loaded with co2 feedback that catch a general trend that nature has but the models far overdo it, is something, in my opinion, to be skeptical of when forming policy for one, or making predictions, for another.
I see some of the models have a snowstorm for me around April fools day, To quote Ronald Reagan.. well there you go again,Maybe this time we will get it.