
 In the coming weeks I would like to pay attention in a triptych to a topic that is actually considered to be little controversial in climate skeptics circles and is therefore hardly questioned: the global carbon budget. In my opinion, this lack of attention is unjustified, because it is precisely this subject that the climate orthodoxy uses as an established starting point to then present human emissions as a central problem.
In this first part, I will put the importance of human CO2 emissions into perspective by arguing that natural factors play a predominant role. I am not directly concerned with the influence of CO2 on the climate, but only with the relationship between the natural factors and the human contribution to the CO2 budget.
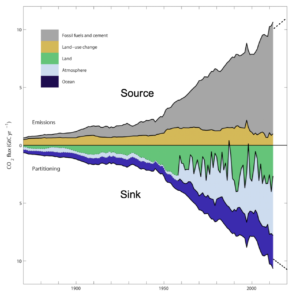
Climate science suffers from a form of demagogy and bias that is best illustrated with the famous CO2 flux graph in the figure above. This beautifully coloured picture was created to illustrate how much CO2 is emitted by humans (source) and how much, and where, that CO2 ends up annually (sink). Since this graph was introduced by Le Quéré et al. (Ref. 1), many variations of this picture have been published (by the IPCC and others) with the same alarming message. I will try to show why this graph should be classified as scientific deception.
The basic data used to compile this graph is, in my opinion, reasonably reliable, because it is based on accurate atmospheric CO2 measurements, calculations of fossil fuel consumption, cement production and observed deforestation. However, the reliability of the graph ends here. Human emissions/deforestation are shown above the horizontal axis, and below what happened to those emissions. The debit and credit side have been balanced. It is suggested, however, that nature (land, ocean and air), in an ever-varying ratio, has been able to offer human emissions a place of its own.
The question now immediately arises of how one could establish that one year the land is able to absorb, for example, 50% of human emissions, while in another year that absorption appears to be completely absent. The answer is that this difference has not been determined empirically, but is only the result of an exercise to balance the carbon budget, based on the assumption that the annual CO2 absorption by the ocean (purple) of human CO2 emissions is relatively stable and not subject to large variations from year to year (albeit gradually increasing over the years). What is completely (consciously?) Ignored in this graph is the gigantic natural flux (i.e. emissions and absorption) between land, sea and air, because this picture is limited to the human emission history since 1870.
By displaying the fluctuating atmospheric CO2 increase in a graph with only human emissions, without natural emissions, the false impression is created that the change in atmospheric CO2 concentration would only be related to human emissions, and has therefore no bearing on the 20 times greater annual natural flux of CO2. The natural emission (source) and absorption (sink) of CO2 depends on many particularly complex and difficult to measure factors, comparable to the many factors that make the climate/weather so difficult to predict.
I have reviewed the oceanographic literature on the CO2 flux from air to sea and vice versa as best as I could, and was baffled by the large number of factors and uncertainties associated with this phenomenon: ocean currents, temperature, biogenic activity (phytoplankton) to name just a few. The same uncertainty applies to the degree of terrestrial CO2 flux. The physical, chemical and biological processes that control the gigantic CO2 budget are so complex that it is highly pretentious to think that one could identify or quantify all causes of the CO2 fluctuations with any precision.
In Figure 2, I have combined the human emissions from Figure 1 (recently ≈10 GtC) with the annual natural emissions (≈ 210 GtC) to give an impression of the relationship between the two. The three main natural sources of atmospheric CO2 are (ref. 2): plant respiration, soil respiration and ocean respiration. The main natural uptake processes are: photosynthesis (≈ 120 GtC/year) and ocean absorption (≈ 90 GtC/year).
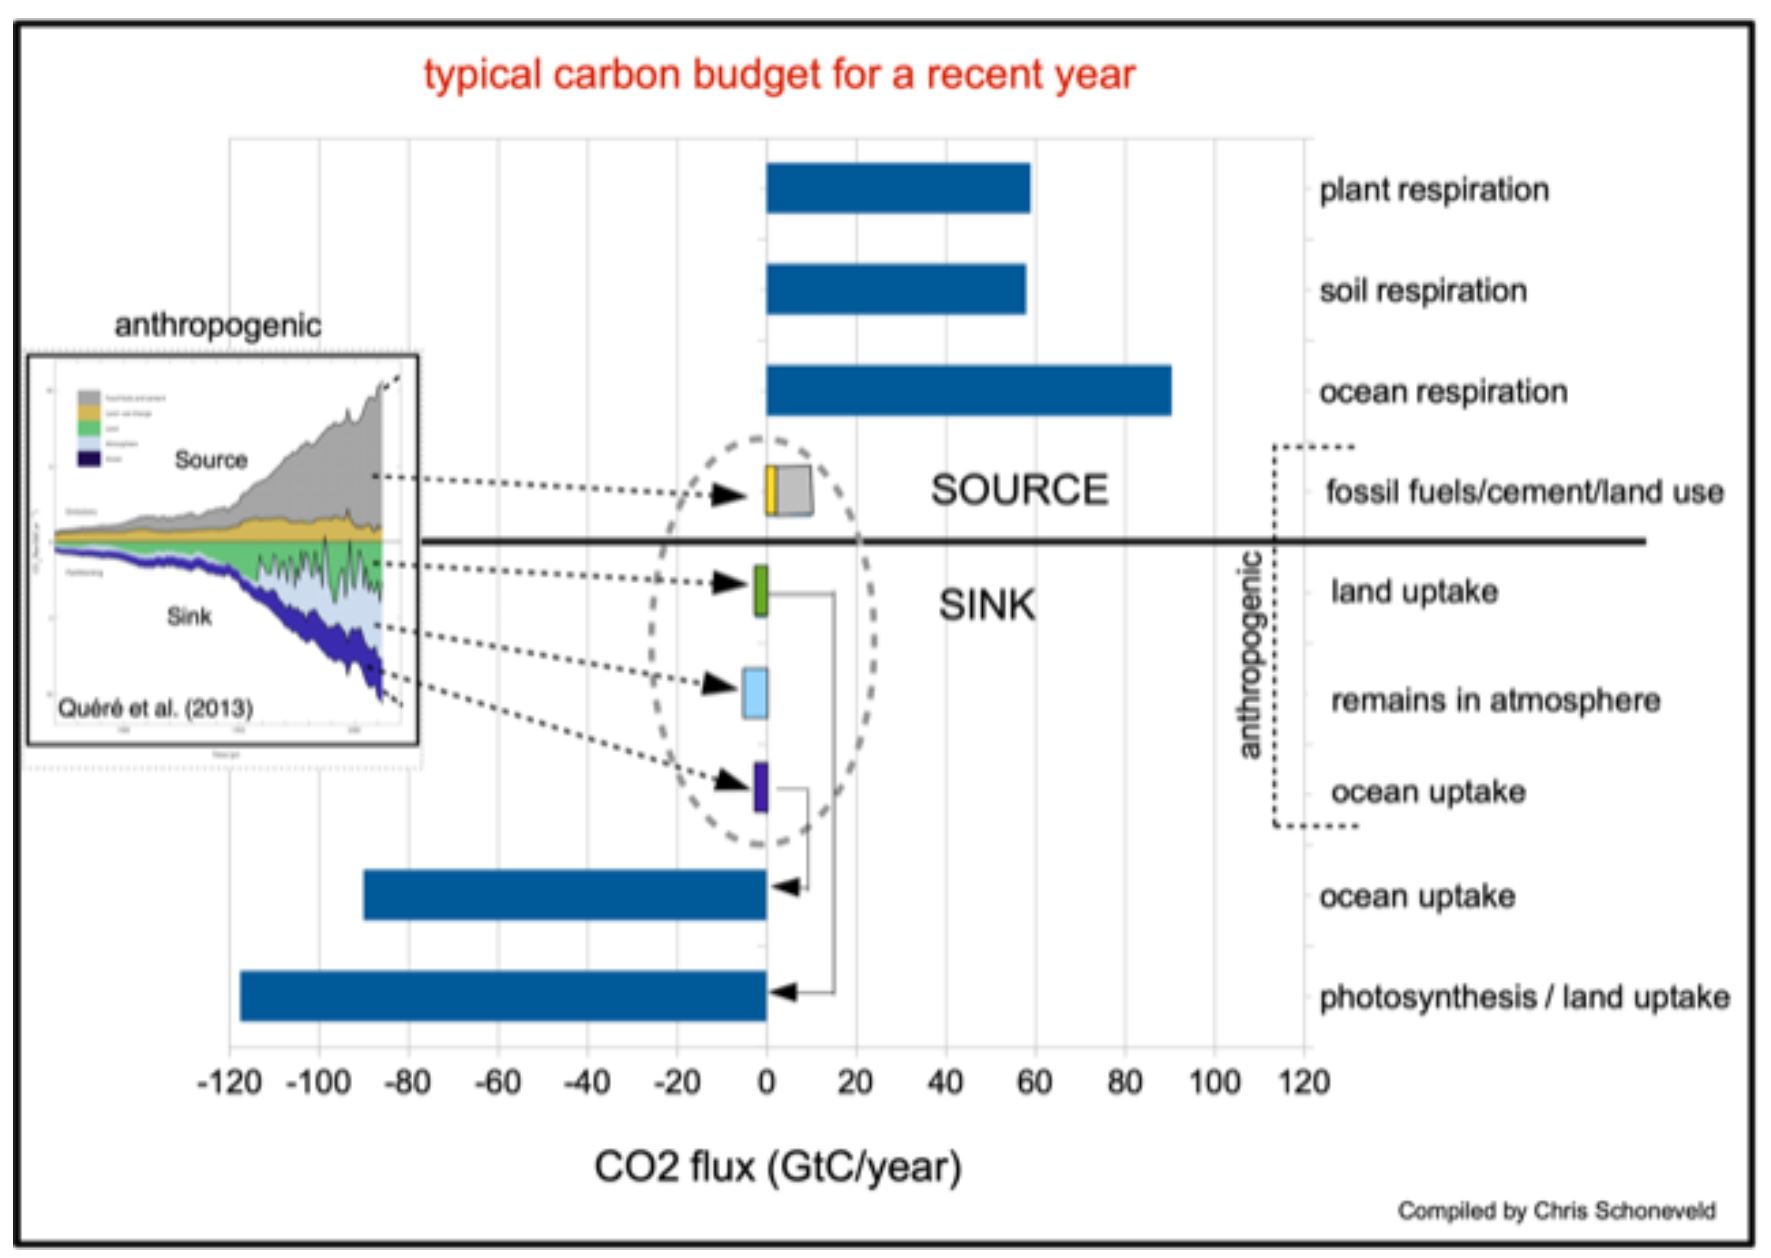
Nearly 50% of the natural CO2 land emissions are attributed to soil respiration (≈ 60 GtC/year). This is the result of the decomposition of organic material in the soil and the expiration of plant roots.
Decomposition depends on two important factors: soil temperature and soil moisture. The importance of soil temperature is shown in the following graph. It shows a linear relationship (determined empirically) between soil temperature and emissions: 1 ° C temperature rise gives a 16.5% increase in CO2 emissions (source Wikipedia).
Over the past 55 years, the surface air temperature on land (in the Northern Hemisphere) has increased by ≈1.5 ° C. That’s more than the world average, because the land in the Northern Hemisphere has warmed more than the Earth as a whole, including the sea. A Chinese study (360 locations) has shown that since 1962 the soil has heated up at a rate of 0.031 ° C /year (ref. 3). A study on American soil (292 locations) found an almost identical increase of 0.032 ° C / year at a depth of 10 cm (ref. 4). A 1.5 ° C rise in soil temperature since the 1960s is therefore a reasonable assumption. Using the graph, we can deduce that global warming now causes 25% more soil respiration of CO2 than it did 50 years ago. If it is now estimated at 60 GtC, it would have been 48 GtC 50 years ago. This means that now yearly an extra 12 GtC is emitted as a result of soil respiration than was 50 years ago, purely by temperature rise. That is more than the total anthropogenic annual CO2 emissions of ≈ 10 GtC.
I have not been able to trace the origin of the Wikipedia graph, but confirmation of the degree of extra soil respiration is provided by Zhang et al. (2016): Rising soil temperature in China and its potential ecological impact (ref. 5). They measured an increase in soil respiration of 28% over a period of 50 years. In view of the great uncertainties concerning the CO2 budget, I have to mention that large differences are also mentioned in the literature regarding the amount of soil respiration. In Bond-Lamberty et al. (Ref. 6), soil respiration is estimated to be 98 GtC (=+/- 12 GtC). If the 28% increase in Zhang et al. Is representative of the entire Earth and the 98 GtC is the actual emission, 50 years ago soil respiration would have been 76 GtC/year and the CO2 increase would therefore have been 22 GtC/year, more than double the annual human emissions.

A warming earth is also expected to become wetter due to an increase in water vapour (one of the main positive feedbacks in climate models). As soil respiration is also dependent on soil moisture, increased humidity will also cause an increase in atmospheric CO2. I have not yet been able to find out how much wetter the earth has become and how large the effect of soil moisture is, but it may be assumed that this factor also plays an important role in the measured atmospheric CO2 rise.
In summary, the knowledge about the processes that determine the terrestrial CO2 flux is insufficient to determine exactly what happens to the anthropogenic emissions. That is why I have serious doubts using the land uptake as a fiddle factor to balance the carbon budget. Indeed with an increase in temperature terrestrial flux will increase in both directions due to, on the one hand, more photosynthesis and, on the other hand, more soil respiration. However, I do not think that the terrestrial flux is the overriding factor in balancing the short term CO2 fluctuations without consideration for the role of the ocean..
Therefore, in the second part of this triptych I will discuss the ocean’s share in explaining the short term fluctuations in the carbon budget, as misleadingly displayed in figure 1. The third part will deal with the importance of the seasonal CO2 (saw tooth) variations in determining factors that control the long term atmospheric CO2 increase.
I hope that with these examples I have been able to give the reader a glimmer of doubt about the (misleading) certainty with which climate science presents the human share in the CO2 budget and strongly exaggerates its importance. We will therefore also see that the lockdown will not change the annual CO2 curve of Mauna Loa.
1) C. Le Quéré et al .: Global carbon budget 2013. https://www.earth-syst-sci-data.net/6/235/2014/essd-6-235-2014.pdf
2) Global Carbon Budget 2018.https: //www.earth-syst-sci-data.net/10/2141/2018/
3) Hui Zhang et al .: Asymmetric Soil Warming under Global Climate Change. https://www.ncbi.nlm.nih.gov/pmc/articles/PMC6539193/
4) Qi Hu et al .: A Daily Soil Temperature Dataset and Soil Temperature Climatology of the Contiguous United States. https://doi.org/10.1175/1520-0450(2003)042<1139:ADSTDA>2.0.CO;2
5) Zhang H. et al .: Rising soil temperature in China and its potential ecological impact. https://www.nature.com/articles/srep35530
6) Bond-Lamberty et al .: Temperature-associated increases in the global soil respiration record. https://www.ncbi.nlm.nih.gov/pubmed/20336143