Another high-impact tropical storm season is anticipated for the US coast:
- Long-tracked, large storms are less likely than in-close, smaller storms that form quickly.
- There will again be plenty of “throw-away” storms to the north of the Main Development Region which will pad the total numbers.
- An enigma concerning the Northeast is analyzed.
- The Western Pacific will again have lower than average activity.
First of all, there are no changes to the total numbers, but I will explain the impact numbers in more detail below.
Named Storms: 18-22
Hurricanes: 6-10
Major Hurricanes: 2-4
ACE (accumulated cyclone energy): 140-180
This comes out to an average of around 7 ACE points per storm.
Models and Analogs
The Euro’s precipitation forecast for August-October:

Once I saw that, I knew which analog year to pull:

The Euro at 500 mb:
.png)
The positives over the top are similar to the analog years of 2003, 2005, 2008, 2017, 2020, and 2021.

The SST forecast:
.png)
The analogs are similar:

In the Euro forecast, the Main Development Region is not as warm as in the analog years. Four of those years (2003, 2005, 2008, and 2017) had long-tracked storms, while 2020 and 2021 featured storms that would develop in close with the most rapid deepening occurring in MJO Phases 2 & 3. I think we will see a similar look this year, and these storms won’t be as massive (size-wise).
The Sea Level Pressure forecast is the most contradictory. This implies to me the smaller storms (size wise):

The analogs:

All of these years on the Power & Impact scale had at least two hurricane hits with one major hurricane.
Those hits in the six analog years were here:

In total, there were 12 major hurricane hits and 9 lesser hurricane hits for a total of 21 in those six analog years. That’s 2 major hurricanes per year and 1.5 lesser storms per year. None of them were to the north of Cape Hatteras.
Hurricane Impact Forecast
So, how do we forecast this in a way that you can understand the impacts the season will have? I feel strongly of the numbers game that the industry plays is almost laughable. Anyone can put out a slew of numbers before the season with a large range. Where are they going? What is the nature of the season? What special characteristics will it have? I have tried to advance that.
So this year is a different attempt. We have had great success at drawing areas of prime concern, but I felt empty that I did not quantify everything better. This is certainly better than a probability for 2000 miles of the coast. As you will see below I am going to put forth a metric and from that try to see what skill can be measured.
Years ago when in arguments over hurricanes and the hysteria they produced (now it’s worse than ever), I constructed a simple chart of the intensity of a tropical cyclone as it impacted an area according to a more precise, modified Saffir-Simpson Scale. In other words, if a storm is a Category 3.5 at landfall, it gets a 3.5 rating. If it’s a weak Tropical Storm as it brushes by an area, it might be 0.25 (even if it doesn’t make landfall).
The 2020 season was the strongest impact season on record. The total cumulative Saffir-Simpson rating that year was (storm total at maximum) 52.75. Its impact score was 24 (adding up the total category values when they actually impacted an area). All of these were between Cape Hatteras and Brownsville, with over 80% on the Gulf Coast. Of course, areas farther to the north were impacted (for example Faye and Isaias in the Northeast).
A complication to this method is what happens when a storm stays just offshore, in which case the strongest category wind seen would be used. Helene in 1958 was a Category 4 but only Category 3 winds reached the coast since it stayed 10 miles offshore. It gets a 3. In the end, what’s the difference between a Category 3 landfall and a Category 4 that causes Category 3 impacts? This is a very basic attempt to better quantify impacts rather than landfalls.
To reiterate (to score in a region) the storm does not have to make landfall in that region, it only has to cause impacts. For example, the queen of all storms, Donna, scored a 4 on the Gulf Coast, a 3 in the Southeast, and a 2 in the Northeast. Outrageous!
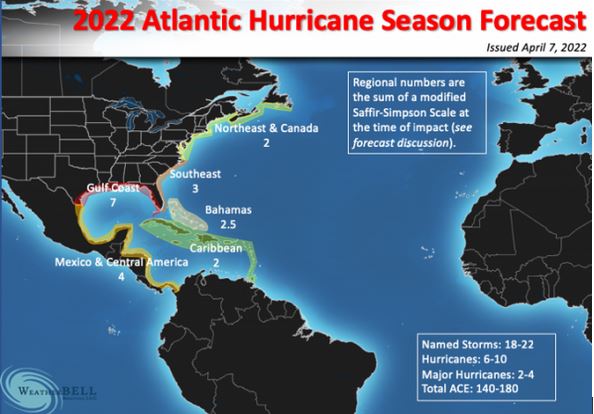
The way we score it is to total up the strongest category for a storm in a given impact area. Given the analog map above, the Gulf Coast looks to be most under the gun yet again. Here is the forecast:
| Region | Impact Score Forecast |
| Gulf of Mexico | 7 |
| Southeast | 3 |
| Northeast | 2 |
| Bahamas | 2.5 |
| Caribbean | 2 |
| Mexico & Central America | 4 |
So the season is expected to see a total of 12 impact categories for the US. That’s under the record year but still above average. Here it is in graphic form:
.png)
Gulf Coast and Southeast.
The map above speaks loudly for itself. I am simply taking the blend of the years and running with the analog.
Northeast
Let’s say there is no direct hit in the Northeast or Canada. Well, you can have some weaker storms come through that impact the area. You will score them based on a scale “prorated” to the wind between 40 mph and 70 mph. For instance, last year, Henri was a 0.8. and in 2020 the Northeast was about a 1.3.
Long Island and New England have not had a hurricane hit in 30 years after averaging one every seven years from 1938 through 1991. That is a remarkable statistic and runs counter to the idea that warmer water off the East Coast means more hurricanes. You saw with Sandy how it can happen. The storm has to be moving fast. Of course, there has to be enough of a positive over Canada and the northwestern Atlantic to hold the storm in. Even though more storms will likely spin up to the north of the Main Development Region, almost all will move out to sea. The danger of a northward displaced Isabel or 1933 is there. I was so focused on it last year from the preseason that it had me thinking Henri would pull it off. I think we still have the concern this year, enough that relative to the past two years it should be more active for the Northeast.
The Bahamas
Like the Northeast, this is a forecast headache. A storm like Dorian could blow away the numbers I have, but I think we will see a similar look to the past couple of years.
Caribbean
I expect less than average activity as Main Development Region activity will be less and storms should wait until the western part of the basin to intensify. For a time during the heart of the season, they will also likely move to the northeast of the islands.
Mexico & Central America
I am near the long-term average for these areas. Central America tends to see stronger storms at the tail end of the season, while Mexico is more susceptible early.
A word about the western Pacific
We have had two of the weakest back-to-back seasons on record in the western Pacific. This year looks to be below average, too. I can’t imagine less activity than last year, with only two typhoons hits. I don’t think it’s going to be as low as last year but it should still be below average and a counterweight to the coming hurricane hysteria in the Atlantic.
Notes and asides
The things I am putting out open up a whole new way of trying to evaluate storms so we do not get sucked into the numbers/climate change game. For instance, a nice study that someone might get a master’s degree with would be to take this idea (or a similar objective one) and go back and get the score for every season! We can say all we want about ham sandwiches named in the middle of nowhere, but the fact remains that we have much better records of landfalling US storms and a way to quantify them. I am partial to my Power & Impact scale because size matters. Ida was a beast, but she could not hold a candle to Betsy as far as size. Charley was a fist of fury, but he was a lightweight versus a heavyweight like Donna. Carla versus every other hurricane on the Texas coast, except 1900 (or perhaps Ike which was a monster size-wise) stands out. The hurricanes of 1944 and 1938 were both sizable along with their power and made them spectacular. It was the size of Sandy that made her the storm she was, not one-minute wind speed at the center.