The website, Weatherbell.com. has been pioneering methods to show in the preseason where these storms are going in our opinion. I have shown this on CFACT.org since they have been gracious enough to ask me to write for them. It means there is a date and time where we make public the ideas in a place where anyone can read them, and then we can measure our skill.
Hurricane Impact Update three days ago
June 7, 2022
- This update is honing in on a major impact season.
- The impact numbers were increased from New Orleans to Cape Hatteras.
- Well above average numbers are forecasted in the Northeast.
- The Caribbean numbers have been raised dramatically.
- The Euro Seasonal is the most bullish I have ever seen it in June.
- The total storm statistic forecast (names storms, hurricanes, etc—were not changed).
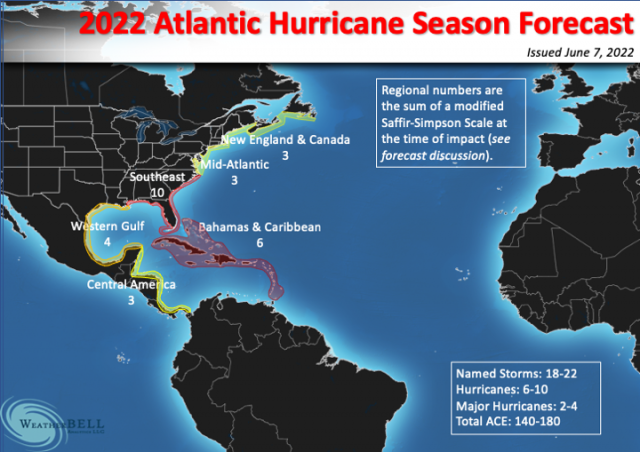
Named Storms: 18-22
Hurricanes: 6-10
Major Hurricanes: 2-4
ACE: 140-180
This comes out to an average of around 7 ACE (accumulated cyclone energy) points per storm.
The impact map:

Because of the nature of the season, zones are now honed to forecast the total of the Power & Impact Scale of the impactful storms. Each storm is graded on actual effects. If, for instance, a 50 mph tropical storm moves through an area it may get a 0.25. Once to hurricane status, based on the highest wind, each storm is graded in fractional increments from 1.0-5.9. For example, a 200 mph hurricane impact would get 5.9 for that zone.
What jumps out is the increase over the Caribbean and the “honing in” on the zone from New Orleans to Cape Hatteras, including Florida. The old map had the Gulf Coast with a very high 7, but I wanted to get more descriptive here. The western Gulf and that part of Mexico get a 4, the east-facing central American coast a 3, but it’s the Bahamas to the Caribbean that has been really increased. The 3 in the coastal areas of the Northeast and the zone from Cape Cod to Newfoundland are way above average. Quite frankly, the map, if correct, would mean we have a year that joins 2020, 2017, 2008, 2005, and 2004 as far as destructive potential. Florida is at the center of the cone that spreads out the most.
The Euro Seasonal 500 mb pattern for the heart of the hurricane season:

With the positives over the top back to the southwest, it is similar to those “who’s-who” years including years the Northeast got hit:

Notice the large-scale negatives over the Tropics, not unlike what the JMA is now seeing. The June Euro Sea Level Pressure forecast has low pressure all over the Atlantic, and that is like setting a time bomb:

The big hit years:

This causes the slowing of the normal easterlies and decreases sheer, allowing the moistening of the air through extra convergence and upward motion.
There is also high pressure forecasted through the eastern and central Pacific, along with higher pressures in the North Atlantic for the heart of the season. That means the other change is that we are now expecting more of an active African wave season. Certainly, the precipitation forecasts are now showing that:
.png)
They are now connecting the enhanced African wave train to the heavier in-close areas. This ups the ante for the Bahamas and the Caribbean, hence the change in the impact forecast there.
Again, note the similarities to the high-impact analog years:

The previous run:

The Verdict
It is always dangerous to forecast off of a forecast, but when the forecast matches known analogs, I have to take the attitude that If I see something, I saw something. While the in-close rapid deepener still remains a concern this year, the big change here is there should be longer-tracked storms for the Caribbean and Bahamas and a spray of threats will put Florida as the center point. It’s tempting to increase numbers, but I always consider that a moot point relative to the impact ideas, which is what we have been pioneering over the years. This looks to be ready to join the who’s-who of big hurricane years. The western Pacific is going the opposite way yet again, but the Atlantic will try to take up the global slack.