This was first issued Aug 29 to clients.
- The threat of a cold winter looms.
- Plenty of blocking is expected over the Arctic.
- A prominent Alaskan ridge should lead to plenty of cold air.
- Another Thanksgiving-to-Christmas cold period is on the table, but this time it may not break.
- The heart of the winter looks coldest relative to average, but there are questions as to how it starts and ends.
Analog:
.png)
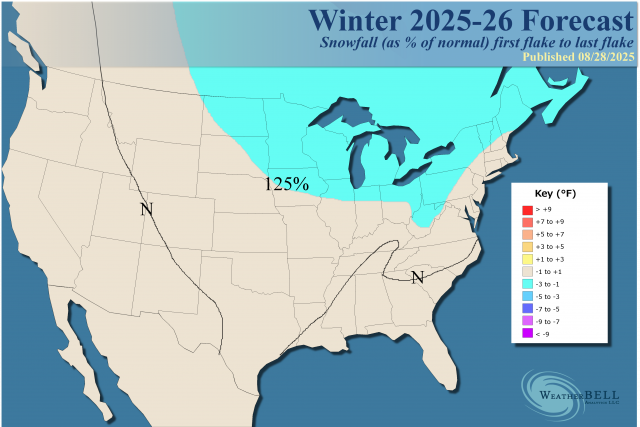
Snowfall:
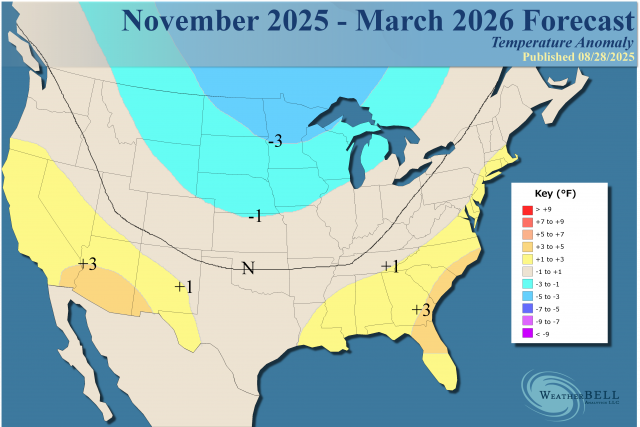
Temperatures for the heart of winter:
.png)
The Euro loves to forecast an Alaskan ridge from December into January. Given it can’t see cold, what it is seeing is impressive at 500 mb:
.png)
The Canadian Seasonal’s winter forecast last year did the best. It’s banging the drum for a cold one (as much as it can for now):
.png)
The last 10 days of runs from the CFSv2 Control echo the Canadian Seasonal to some extent:
.png)
What is standing out to me is the CFSv2 SST forecast off the East Coast:
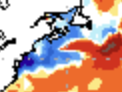
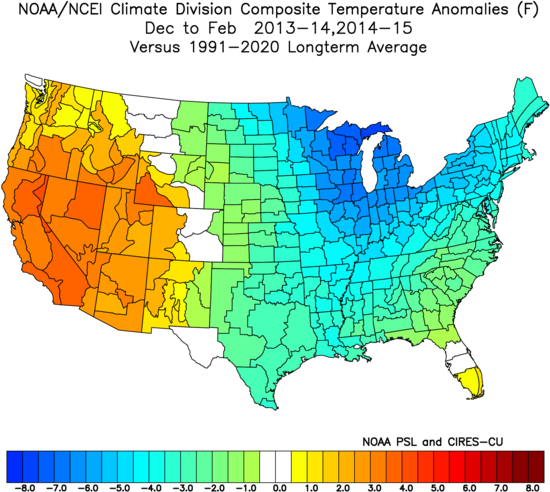
The warm ring is also getting closer to the West Coast than we have seen since the winters of 2013-14 and 2014-15:
.png)
That has a weak La Niña signature, but last year, the ONI did not even make the required period for an official La Niña event. It always seems to be too cold. I think a weak-to-nonexistent cool signal is on the way, and with more warm water close to the West Coast and cool water off the Northeast coast, it should allow for a lot of cold air to come into the country.
While I have no proof of this, the falling global temperatures might be something models are not handling well, as we have seen them too warm. This is the opposite of what the usual error has been over the last 10 years.
The question that is still in my mind is, what do we do with the start and end of the season (November and March)? Last year was a classic example of what can happen.
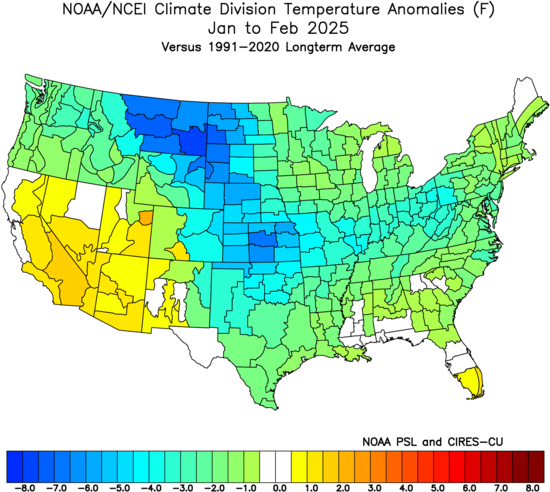
January and February looked like this:
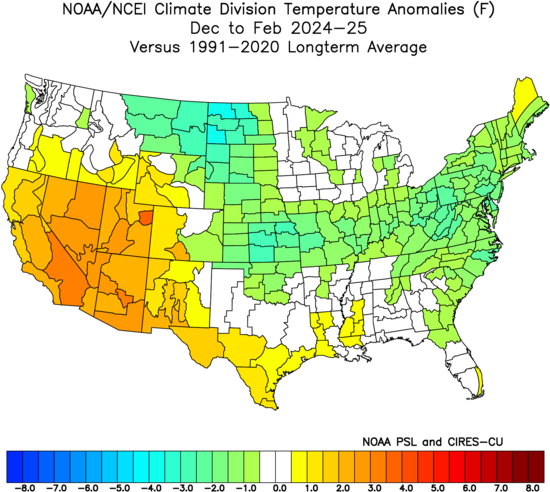
December – February was not as cold:
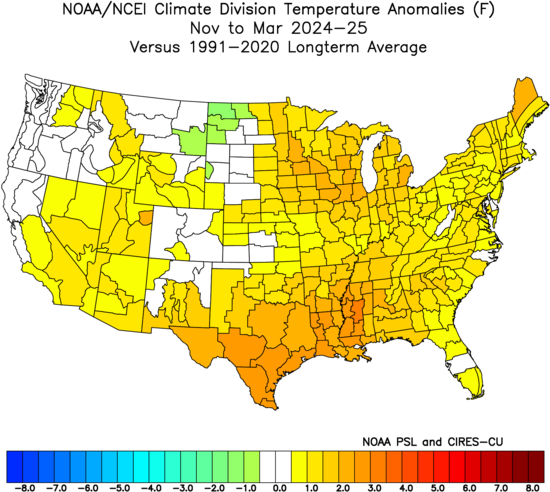
November to March, because of warming at the start and end, turned out warm:
Links to 13-14, 14-15
Interesting parallels to 2013 and 2014 are going on.
Both years had warmth in the Northeast Pacific.
.png)
.png)
Both years had well-below-normal ACE index (so did 2015, but there was a Super Nino.)
This year is similar, though on weather roids in part due to a high input of geothermal sources from southwest of Japan to east of Kamchatka.
.png)
One might wonder, if this tropical dog stays down as we are seeing, will there be a link to winter? I guess the ultimate endgame would be a surge for a time, but a below normal average ace, and then we can test Thanksgiving to Christmas, but the bigger linkage is the DJF period of winter
Southern Hemispheric Stratospheric warming in September
Please read this first of all:
On a personal note, I love things like this. I see the love of the weather in the writing. But when I read it, I decided to look at September 2013 and 2014 to see if there was a stratwarm event over the S Pole then.
Bingo Front row:
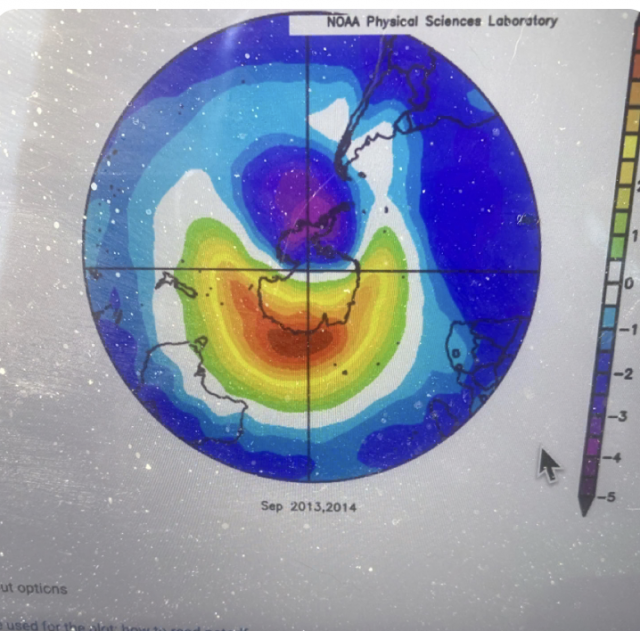
So, this is really interesting, as it’s going on again.
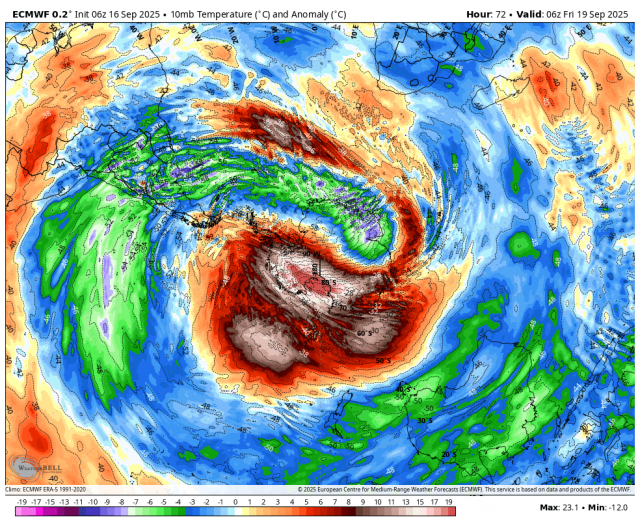
We have the NPAC link, the stratwarm link that they outline nicely, and the low ace for the hurricane season, along with the NE Pacific being so warm.
Globally, the ACE in 13,14 was below normal.
The Verdict
It appears another back-weighted hurricane season is shaping up, and I have used that to predict pre-Christmas cold shots in both 2022 and last year. The ante is upped this year because SSTs in the Pacific are suggestive of the kind of pattern that can pump an Alaskan and Western ridge. This means that once the cold comes, it may hang around, barring any MJO rotation into the “kiss of death” for cold phases (Phases 4, 5, and 6). My hand-drawn map is more ambitious than the analogs, but after getting burned on being too warm on several forecasts this year (most distinctly, summer), I think the trend of models not seeing enough cold air may continue.
The 5-month period could be colder, as we have seen models overwarmed overall since last winter.
Snowfall last year was weird, with streaks of heavy snow and a lack of snow in between. I would assume that a more normal distribution will show up this year relative to temperature, and the forecast map reflects that.
I would be surprised if it turns out warmer than what I have, but not surprised if it turns out colder.