
September 6, 2026
- The midpoint of the hurricane season (by total ACE index) is September 11.
- So far, we are at record lows, but that doesn’t mean it’s over yet.
- Very warm water outside the areas most impacted by El Niño suggests we still need to stay on our toes.
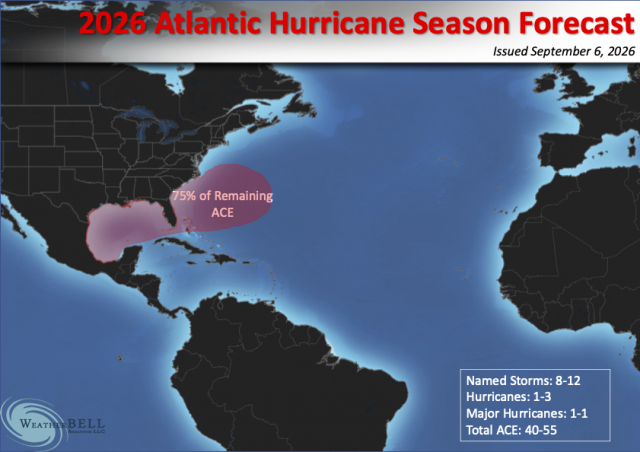
Total storms: 8-12 (5 through September 5)
Hurricanes. 1-3 (0 through September 5)
Majors: 1-1 (0 through September 5)
Total ACE: 40-55 (less than 5 through September 5)
There is still reason for concern after mid-September, as a frenzy to the north of the Main Development Region, and relatively close to the U.S., can occur. The map represents where I believe 75% of whatever ACE is left will occur:

The Euro has virtually nothing on it the next 4 weeks. I don’t believe that as the MJO is going into most favored phases.png)

and the very warm water north of the MDR where feedback features can spin up

and support an increase in activity, though not in the Main development region, because there is a window where the interaction of the seasonal jet would favor storminess in these areas
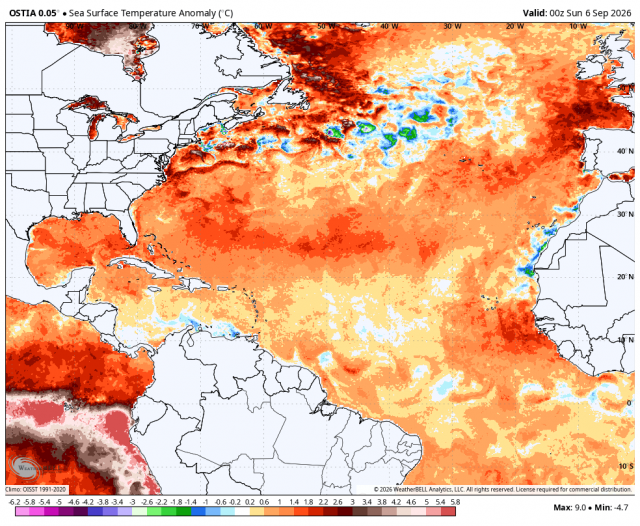
The SST above shows a very warm Atlantic, but the pattern is distorted, with it warmer than average north of the main development areas. This “spreads out” the heat distribution. For hurricanes to develop most strongly, heat needs to focus. So just because the water is warm does not mean there have to be storms. In fact, as you are seeing here, it’s a lesson all over: distorted warming will negate, not enhance, storminess
Now one may say, it’s all the El Nino. Certainly alot of it is. But look at the 23-24 El Nino, which reached strong levels in its Oceanic Nino Index rating, and the Atlantic was hyperactive, though almost all of it was out at sea.
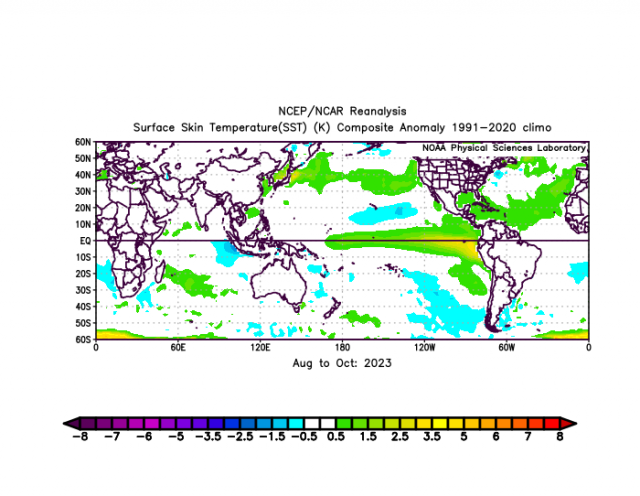

Notice the cooler western part of the basin further north than it is now, where it’s warm to the north and cooler to the south. However, there is a window of the cool over warm, and we are placing it above average relative to the seasonal total area there, from the Gulf out into the Atlantic east of the United States. Which means the US can get hit. A couple of African waves may try to develop, but they would likely stay far out. So we come down to the in-close development, like we have seen with the 3 impact storms already, as the problem, if there is one.
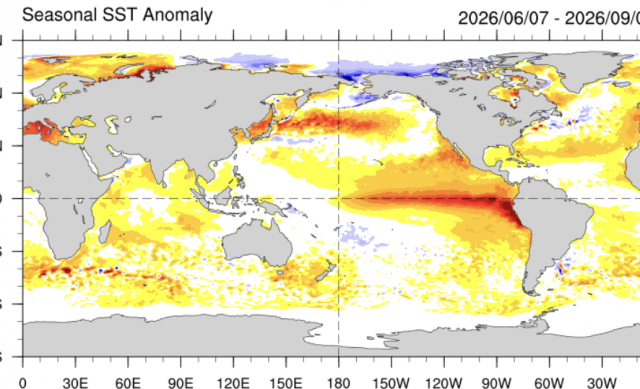

Notice also the cooler relative to averages to the north of the EPAC warming. It’s no secret the Pacific Basin is way up this year. The cooling in the WPAC has been from so many storms so far. A hint that we may have this burst is if we see the Pacific slow down. There are all sorts of old-school ideas about what we are seeing at play here. A late arrival of the Indian monsoon indicated a weaker African wave train. Another idea is that only so much energy can circle the Earth in the tropics, and if it’s distorted and taken up by one basin, the other will be much less active. The third is idea is that a hemispheric pulse favors one area of the world over the other. This was developed many years ago, and recent MJO studies certainly have shown it has merit. One can see it in the MJO. For much of the season, it has been in phase 6/7, which are not phases for US Impact. 2 of the 3 storms that hit developed in phase 8/1, the more favorable phases, and chances are we will journey into those phases for a while again before the season ends
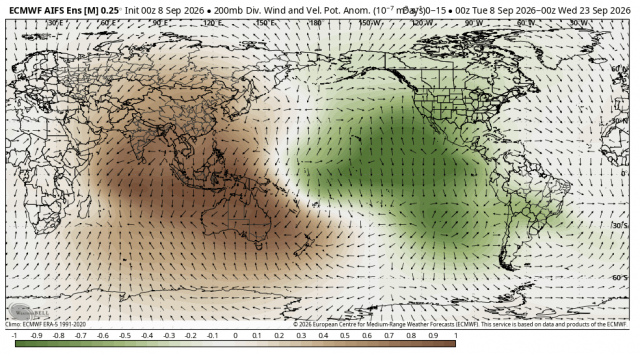

But the chart above implies the greatest spreading of air at the top of the troposphere over the eastern Pacific and the greatest sinking around Indonesia. Where it is spreading out at the top, it must rise in the lower levels. The sweet spot for development is from beneath the center of the green to the eastern part of the brown area, because it means the low-level easterlies are weaker than average due to the idea that air must go up in the lower levels, where it’s spreading apart at the upper levels, allowing low-level convergence and storm development. So the Atlantic is on the short end of the stick. In active seasons in the Atlantic, it’s the opposite, and the Pacific is less active. We have seen this to a large extent this century, as the Atlantic basin has had much higher ACES relative to the average than the western Pacific, with the Eastern Pacific more or less a wash. Storms develop on average further north, are smaller in size, and can become intense, but many more weaker storms are getting named, so the Global ACE index has been trending down and the ACE/Storm has decreased. Which, again, is a byproduct of the distorted warming and OPPOSITE the message that was pushed about more storms and more intense. The other factor, which our power and impact scale emphasizes, is size. When Donna hit SW Fla as a Cat 4 in 1960, winds gusted to near 100 mph around Miami. When Ian hit, the highest gusts were around 50. Even Melissa in Jamaica, which was catastrophic where it hit, had gusts only up to near 60 at Kingston, about 70 miles to the east.
But the bottom line is that it’s not over yet. The configuration of the warm water, the seasonal shift in the pattern, and the MJO moving toward more favorable phases give us a 2-3 week window where we can have a flurry of development, and odds are it would be in close to the US
But there is a bigger climate lesson here. Storms are not getting worse overall. There is a cap on that, and the WAY it is warming is actually arguing for fewer major large storms, not the more widespread doom and gloom that has been pushed
We did have a below-normal season forecasted from early April, but the first half was almost scoreless ACE-wise. That ACE index has been cut in half to a top-10 below-average season. As far as names, well thats probably good. The threat in the NW Atlantic was more an early-season idea, and so we are likely by that.
But the numbers and names are a classroom game; impact is what counts.
One more thing. If this is all El Nino, shouldn’t this be scored as a positive impact?