After six years of tedious litigation, a court in Vancouver, British Columbia appears set to hand down a ruling involving one of the most controversial claims ever made in support of human-induced global warming.
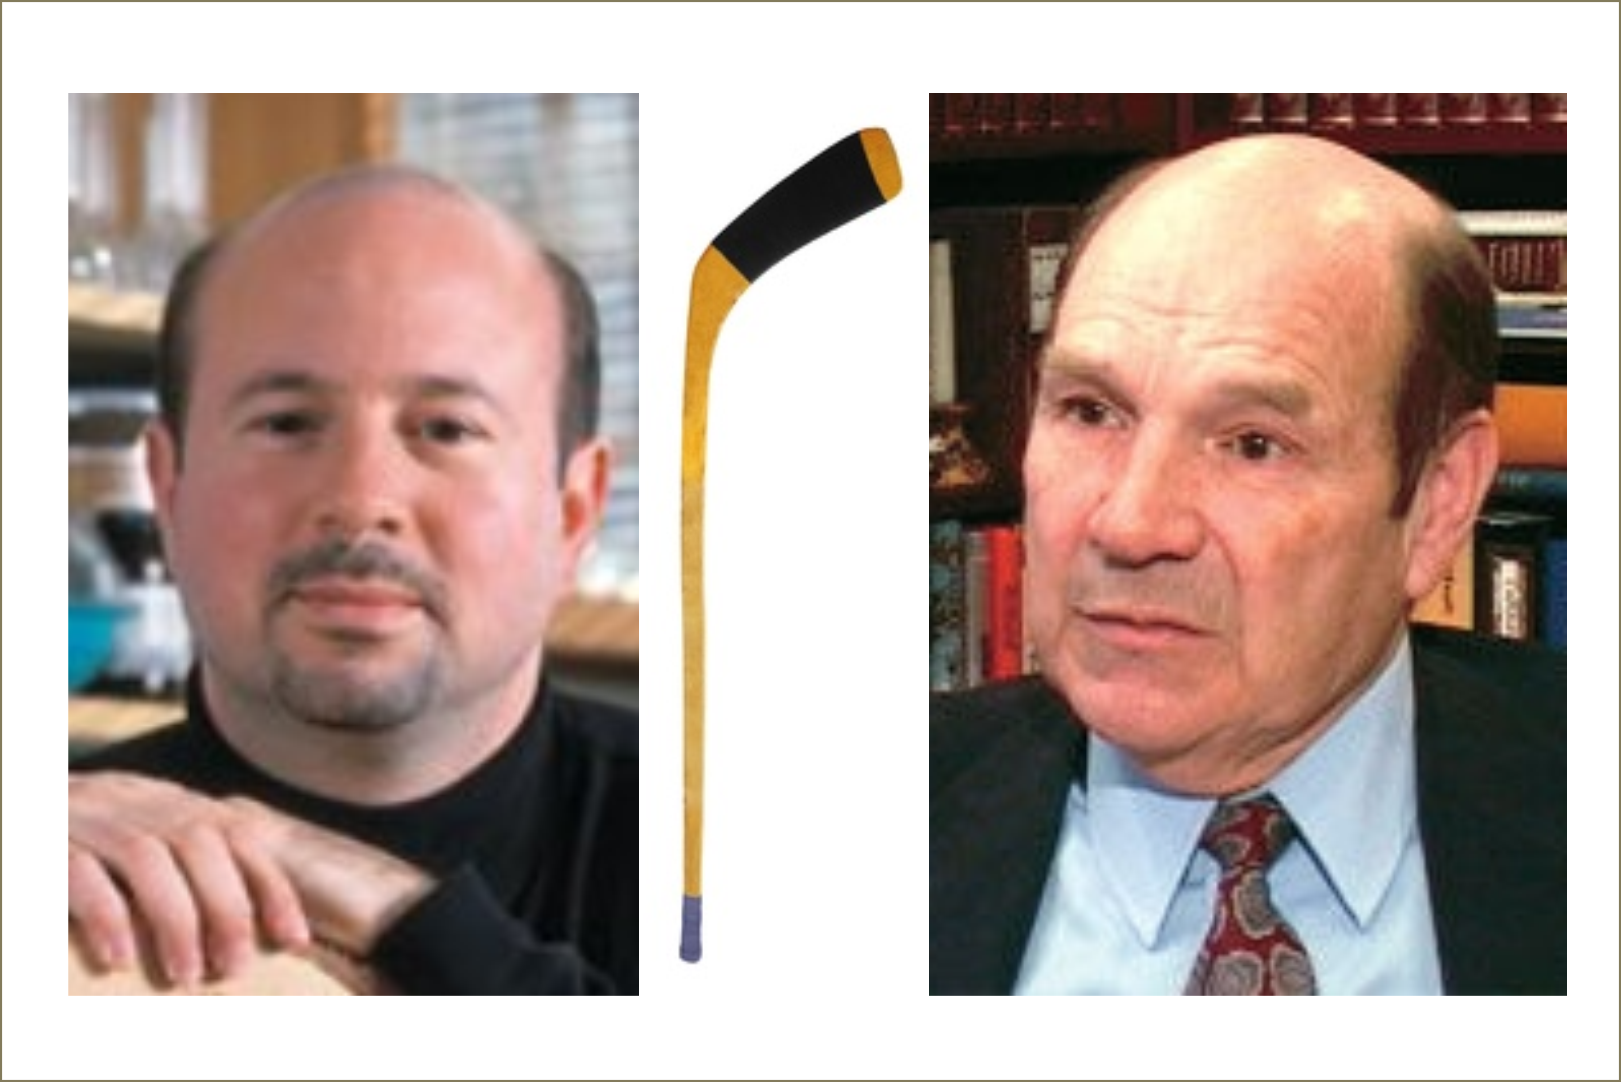
The case pits two climatologists – Michael Mann of Pennsylvania State University and Tim Ball, retired from the University of Winnipeg – in a dispute rooted in data Mann used in creating his famous, or infamous, “hockey stick” graph. In 1999, Mann was the lead author of a paper that used an assortment of statistical techniques to reconstruct variations in atmospheric temperatures over the past 1,000 years. The graph made the Medieval Warm Period all but disappear and showed a sharp spike in temperatures at the end of the 20th century that resembled the blade of a hockey stick.
Mann was one of eight lead authors of the “Observed Climate Variability and Change” chapter in the United Nations Intergovernmental Panel on Climate Change (IPCC) Third Scientific Assessment published in 2001. A graph based on Mann’s work was highlighted throughout the IPCC report. It received widespread publicity and was touted by climate alarmists as further evidence of manmade global warming. Indeed, Mann’s hockey stick took on a life of its own and was repeatedly cited by the IPCC and numerous governments as justifying collective action to combat climate change. The hockey stick has also been cited in innumerable peer-reviewed papers on climate change.
“Secret Science”
Astounded by the sudden disappearance of the Medieval Warm Period — a time generally considered to 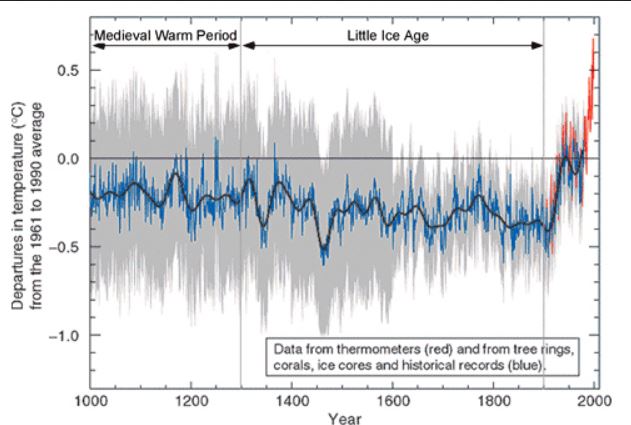 have been warmer than the present — a growing chorus of critics demanded to see the underlying data on which the hockey-stick graph was based. Mann and his co-authors refused to release the data, even though their paper had been funded by U.S. taxpayers. The episode raised allegations that climate alarmists were engaging in “secret science.”
One of those critics was Tim Ball. In a 2011 interview, he quipped that Mann “should be in the State Pen, not Penn State.” Mann sued Ball for defamation in British Columbia under a procedure known as a Strategic Lawsuit Against Public Participation (SLAPP). SLAPP lawsuits are intended to censor, intimidate, and silence critics by threatening them with the cost of a legal defense until they abandon their criticism.
As the case unfolded, the BC Supreme Court directed Mann to turn over all data relating to his graph by Feb. 20, 2017. The deadline came and went without the data being handed over by Mann.
Ball believes that Mann’s refusal to disgorge the data by the court-ordered deadline has put the Penn State researcher in a precarious legal position. As Ball explains (principia-scientific.org):
“We believe that he [Mann] withheld on the basis of a US court ruling that it was all his intellectual property. This ruling was made despite the fact the US taxpayer paid for the research and the research results were used as the basis of literally earth-shattering policies on energy and environment. The problem for him is that the Canadian court holds that you cannot withhold documents that are central to your charge of defamation regardless of the US ruling.”
Mann’s Suit Against Mark Steyn
Once the BC Supreme Court has ruled in his suit against Ball, Mann will have another legal battle on his hands. Mann filed a SLAPP lawsuit in Washington, D.C. against writer and commentator Mark Steyn after the latter wrote in a 2011 National Review Online article that Mann “has perverted the norms of science on an industrial scale.” Judith Curry, a recently retired climatologist at Georgia Tech, has submitted to the court an Amicus Curiae brief critical of Mann’s scientific methods.
For his part, Ball has produced his own graph showing temperature variability over the past 1,000 years. Both the Medieval Warm Period and the following Little Ice Age can be seen on the graph. The graph also shows the gradual warming since the Little Ice Age, albeit to levels below what was experienced during the Medieval Warm Period. Unlike Mann, Ball has published the data on which his graph is based.
I really hope Mann loses both cases, his funding, his teaching position, his reputation, and all his friends …. and his dog. His perversion of the scientific is method requires nothing less than total intolerance.
Mann’s nauseating smirk irritates the hell out of me. He’s a third rate mind hiding behind a fourth rate mentality.
How do you know?
Did the fossil fuel industry tell you so?
Do you think there might be a small conflict of interest in a company writing about a scientist who studies the effects of their product?
http://www.desmogblog.com/committee-constructive-tomorrow
CB – What we know for sure is that in an effort to force people to believe in AGW Dr. Mann declared both the Medieval Warming Period and the Maunder Minimum (the little ice age) as local events. These were not. Both have been plainly shown to have been world-wide events and caused not by some chaotic weather events but by output energy from the Sun.
If you claim that they were only local weather events then you can erase them from the data stream as he did. Without these events which were more extreme than our present warming the chart takes on a ominous look of the hockey stick instead of http://www.worldclimatereport.com/index.php/2008/02/11/a-2000-year-global-temperature-record/
This article was published after the time of Mann’s infamous claims.
You must understand that these are NOT actual events under discussion but computer models. These models are so bad that not only have they not predicted ONE correct even in the future since they were published but using them backwards they do not even predict what happened in the past. This is the sign of bad science – when your model doesn’t even match what occurred before the model was written.
AGW is a fact that has been known for over a century:
climate.nasa.gov/evidence
Why should anyone need to be “forced” to understand it?
What besides mental illness might explain people who “don’t” understand it?
I would like to ask you – what are your professional credentials to speak on this topic? I am not attempting to insult you. I have no educational credentials but I have 40 years of working directly in sciences that are all pertinent to the subject. I was chief engineer on a project that won the project leader a Nobel Prize in Chemistry. I was the digital designer and programmer on another project that won our project leader two Emmy Awards and the company another. I have designed and programmed boards presently in use on the International Space Station. I designed and programmed both liquid and gas Chromatographs. This means I understand spectometry.
One of the deepest problems is that the people most actively in the forefront of speaking of AGW are those who do not have any scientific credentials at all and “know” about it from a Popular Science article. As for your NASA “bible” – ALL of the science behind NASA has been due to manufactured temperature data. When you look into it they should be arrested and tried for misuse of governmental power.
https://thsresearch.files.wordpress.com/2017/05/ef-gast-data-research-report-062717.pdf
As for your claims about “The heat-trapping nature of carbon dioxide and other gases was demonstrated in the mid-19th century” – that is a complete and total lie. It is based on a paper written by Svante August Arrhenius around 1896. Exactly what would you know about it since it was written in German? He simple PROPOSED a connection between the levels of CO2 in the atmosphere and Ice Ages. That has been shown to be totally incorrect since we have had and Ice Age with levels of CO2 of 10%. At the start of the last Ice Age which we are still in the levels were 1%. Arrhenius performed NO experiments. As he said, he had no money nor equipment to do so and instead used data from a paper about the color of moonlight to propose this theory. While he was a competent scientist he was wrong about CO2. And most experiments since his time showed that.
There IS a connection between temperature and levels of CO2 but CO2 is washed out of the oceans as the water temperature rises and CO2 increases follows the temperature rises by 800 years.
Almost NO scientists believe AGW to be true or that there is insufficient data to make such a claim. Who does NASA use as part of their 97%? The American Medical Association and the Boy Scouts of America! Now there is real scientific agreement there.
The Intergovernmental Panel on Climate Change (IPCC) reports are based on the “science” from 2500 “scientists”. However – most of that 2500 are not scientists but are politicians grasping for money and power. And the real scientists are relying heavily on the manufactured temperature information distributed by NASA. So even the most honest scientists in the world cannot produce good work using false data.
As you say – What besides mental illness might explain people who “don’t” understand it?
My credentials are that I can read and I can point you to the people who study the subject… as well as point out propaganda outlets like CFACT which are paid to lie about the subject.
Are you lacking those credentials, Wake?
Do you believe NASA made up the scientists who discovered the greenhouse effect in the 19th century?
Is that the sort of thing a mentally healthy person would believe?
http://www.aip.org/history/climate/co2.htm
By the way – I might add about Arrhenius – the title of his paper is: “On the Influence of Carbonic Acid on the Temperature of the Ground” – do you understand that? “OF THE GROUND”. This was not about atmospheric heating at all. And in case you are unaware if it “carbonic acid” is an old scientific name for carbon dioxide.
Yes! The ground! Where you live!
You do live on the ground, do you not, Wake?
climate.nasa.gov/system/internal_resources/details/original/87_Q10-temp-anomaly-740px.jpg
CB – I was trying to make the point that Arrhenius was attempting to explain ice ages and not the temperature of the atmosphere. The method he used could not correct for humidity and so his numbers are questionable. I would have to run them and that’s too much work since what people claim he said and what he actually said are sometimes completely opposite.
NASA’s temperature charts are extremely unreliable. They have changed their raw data on three occasions and the reasons they did it were not an acceptable means:
https://thsresearch.files.wordpress.com/2017/05/ef-gast-data-research-report-062717.pdf
Note that this is a mathematical study of the changes and it shows that no corrections could have occurred in this manner. The peer reviewers are far more than technically competent including past managers from the EPA and a Fulbright Scholar who is more than familiar with statistical analysis.
Dr. Roy Spencer was the leader of the NASA weather satellite program and he has published the actual temperature data from those satellites:
http://www.drroyspencer.com/wp-content/uploads/UAH_LT_1979_thru_March_2017_v6.jpg
To the uninformed this looks like there is a little warming over the last 38 years but there are only two points that are higher than normal variations and that is 3/4ths of 1998 and a hot summer in 2015. This can easily be assigned to chaotic weather patterns. The AVERAGE temperature since 1979 is zero change.
“His perversion of the scientific is method…”
>> How has Dr. Mann perverted the scientific method? What credible evidence do you have?
His efforts to to silence his critics using courts rather than have a discourse. Are you following along or just playing dumb?
My, my. Do we not read? Mann was asked multiple times to share his data and analysis code to validate his research. He declined to share. This is the antithesis of the scientific method.
M&M demolished Mann’s statistical analysis anyway via reverse engineering. That he did not acknowledge their valid conclusions is the antithesis of the scientific method.
Mann’s tree-ring data showed a temp decline after 1960. Not the result he wanted. So he truncated the declining data and concatenated temp sensor data, which showed the rising temp he desired. He published this WITHOUT noting what he had done. THIS is the antithesis of the scientific method.
To top it off, the IPCC no longer includes the hockey stick graph in its documents.
Are you honestly going to attempt to defend such a person?
We got another moron here.
“…We got another moron here…”
There’s another explanation:
I’ve just realised, after much wondering about the attitude, stance and argumentative approach, that Ian5 is probably none other than Michael Mann himself…!
Calling people names is a strategy of propagandists and the weak-minded.
“…Calling people names is a strategy of propagandists and the weak-minded..”
Hi Michael… You go on believing this, if it makes you feel better. It does nothing for your cause, though, since you’ve been the name-caller in chief; and debate-preventer; and peer-review corrupter.
“..debate-preventer; and peer-review corrupter.”
You are entitled to your own opinion but not your own facts. Instead of citing extreme conspiracy rubbish from Heller and other disinformation websites, why not inform yourself on the science, evidence and implications of climate change: https://climate.nasa.gov/evidence/
Extreme conspiracy? That is a load of rubbish you’re trying to pass around:
https://thsresearch.files.wordpress.com/2017/05/ef-gast-data-research-report-062717.pdf
This paper mathematically demonstrates that NASA doctored their data. It is peer reviewed and agreed upon by members and past members of the EPA.
You can haul your lying butt down the street and sell it on some other street corner.
No it is not peer-reviewed, published research, and no it does not demonstrate that NASA doctored their data. All you’ve provided is a single link to an unpublished paper written by well known contrarians, posted to the silly, amateurish ‘tropical hot spot research’ website. You are misinformed.
As usual, you don’t know what you are talking about.
But you never let that stand in your way of VENTING BILE AND HATE.
.
He has already WON 2 MAJOR COURT VICTORIES against the Attorney General of Virginia…
SORRY YOU MISSED IT….married, as you are, to BREITBART and DAILY LIAR.
As Twain said, “better to keep quiet and be thought a fool than to open one’s mouth and remove all doubt.”
UV won the right to prevent releasing alarmist Mann’s data and emails. Aparently, UV had no problem giving up the same info of skeptic Patrick Michaels. The hypocrisy could not be more telling.
Then there’s alarmist Mann’s libel trial against skeptic Dr. Tim Ball. Mann has now been declared in contempt of court for not turning over requested info. And we all know why. Mann’s work is flawed. And turning over his data and emails would make that all too clear.
Best move to the shallow end of the intellectual pool. You’re in way over your head.
Nice imaginary Tall Tale.
(( FICTION ))
NO MICHAELS RESEARCH….NO VIRGINIA ADDRESS..
what the hell are you talking about???
.
Mann’s court suit has had NO CONCLUSIONS,
THERE has been NO contempt citation
…once you realize that in Canada
…the Government is championing Mann’s case
…to gain that status, all disclosures were made BEFORE the case could ever get to court.
.
“….No judge has made any order or given any direction, however minor or inconsequential,
that Michael Mann surrender any data or any documents to Tim Ball for any purpose.
“Accordingly it should be plain and obvious to anyone with a
modicum of common sense that Mann could not possibly be in contempt of court.
“Just to be clear:
Mann is not defying any judge.
He is not in breach of any judgment.
He is not, repeat not, in contempt of court.
He is not in breach of any discovery obligations to Ball….”
2 separate suits filed by the Republican Attorney General of Virginia was laughed out of court
.
BECAUSE he had NO foundation to challenge the validity of Mann’s MASSIVE RESEARCH at several institutes.
.
.let alone attempt to gain ALL of his computers and his e-mails and written letters to ANYONE in the science field
…and
BECAUSE ALL of his research was already published, in PEER REVIEW and REPLICATED 36 separate times.
…
I cannot find ANY record of Patrick Michaels doing any research ! ? !
AND WHAT COURT SUIT…..?
…”….But Michaels’ credibility on climate is called into question by a trove of documents from a 2007 court case that attracted almost no scrutiny at the time. Those documents show that Michaels has Major financial ties to big energy interests
—ties that he’s worked hard to keep secret.
Here’s the back story:
Several years ago, the auto industry launched a salvo of lawsuits challenging the tougher vehicle emissions standards that had been introduced in many states.
In 2007, Michaels was scheduled to appear as an expert witness on behalf of a challenge by Green Mountain Chrysler-Plymouth-Dodge and the Association of International Automobile Manufacturers to emissions standards in Vermont.
The auto industry’s lawyers planned to put Michaels on the stand as an expert witness who would question the scientific finding that greenhouse gas emissions are warming the planet.
But it soon became clear that lawyers defending Vermont’s law were going to ask Michaels about the clients of his “advocacy science consulting firm,” New Hope Environmental Services.
Michaels had never made a list of his clients public, and he refused to do so now, arguing that it was a confidential matter.
The judge disagreed,
and ruled that Michaels’ clients were a “viable area of cross examination.” “I understand that maybe it’s a little embarrassing,” said Judge William K. Sessions III. “[But] it’s not highly confidential information.”
In a rare move, the auto dealers pulled Michaels off their witness list.
**********
Pat Michaels was a “member scientist” and “individual supporter” at The Advancement of Sound Science Coalition (TASCC), an organisation
CREATED & FUNDED
by the tobacco industry to fight anti-tobacco legislation. [10]
Michaels was also an “Academic Member” of the European Science and Environment Forum (ESEF),
another group CREATED by the tobacco industry to frame legitimate science as “junk science” on matters pertaining to health and environment, particularly secondhand smoke health impacts.
Michaels was listed as an academic member on the ESEF’s March 1998 working paper titled “Environmental Tobacco Smoke Revisited: The reliability of the evidence for risk of lung cancer and cardiovascular disease.” [11]
Fossil Fuel Funding
Patrick Michaels once estimated that “40 percent” of his funding comes from the oil industry. [12]
If you are ignorant of Greenpeace’s FOIA request to UV regarding info on Dr. Michaels (which was granted) and Chris Horner’s similar FOIA request regarding info on Dr. Mann (which was denied), you cannot be helped. The issue here is UV’s double-standard in executing FOIA requests.
And if you’re attempting to argue that Michaels is corrupt for being partially funded by the fossil fuel industry while ignoring that Mann is pure even though he is totally funded by sources that expect research results with a alarmist conclusion, then you are a special kind of fool.
That Suit … Green Peace V. Michaels … was a brewing political suit….Michaels made MANY derogatory statements about Green Peace…..
IT HAD NOTHING TO DO WITH ANY RESEARCH Michaels was involved with.
.
.
“https://wattsupwiththat.com/…/dr-patrick-moore-was-right-greenpeace-is-full-of-shit/
Mar 3, 2017 – Dr. Patrick Moore, one of the co-founders of Greenpeace, whom they have tried to erase from their website, resigned from… … Greenpeace claims it cannot be sued because its misleading claims were not meant to be factual
Obfuscation … again. But thanks for noting that Greenpeace’s claims weren’t meant to be factual.
NO OBFUSCATION….just you wanting to debate anything but science…..
Next you will be challenging by qualifications to read and study Scientific studies or their abstracts as I have done for 50 years.
….simply because you do not like the fact that in ANY given week….there are hundreds of peer reviewed studies, published and replicated in support of the ENHANCED GREENHOUSE EFFECT leading to THREATENING CLIMATE CHANGES.
…and VERY, VERY FEW with credible science in opposition.
TRUMP
“Steele used his contacts in Russia to put together a dossier that describes efforts by Russian President Vladimir Putin to cultivate a relationship with Trump and his entourage and to gather material that could be used to blackmail the candidate if necessary. Steele did not pay sources for information.
The dossier contains salacious allegations that NPR has not detailed because they remain unverified, but an unexpurgated copy of the document was posted by BuzzFeed last January and circulated widely. One important aspect of the story is that the material in the file, if accurate, might have exposed Trump to potential blackmail.
Months before, during the presidential campaign, information gathered by Fusion GPS was passed to Democratic candidate Hillary Clinton’s campaign.
Trump and GOP lawmakers have sought to portray the 35-page dossier as outrageous and false. They’ve drawn attention to the fact that much of it is unproven. By impeaching the dossier, they have tried to impeach the basic case that people in the Trump orbit may have coordinated with the Russians who attacked the election.
Trump allies also have used the dossier to go on offense against the FBI and the Justice Department, charging that “biased” federal investigators used what Republicans call partisan, Democratic-funded propaganda as the basis for the whole Russia investigation.
The case for collusion, however, goes beyond the dossier and includes outreach by Russian agents to the Trump campaign and meetings between Trump associates and Russians.
In fact, in their op-ed, Simpson and Fritsch wrote that congressional committees have “known for months” of credible allegations of collusion but have chosen instead to “chase rabbits.”
“We suggested investigators look into the bank records of Deutsche Bank and others that were funding Mr. Trump’s businesses. Congress appears uninterested in that tip: Reportedly, ours are the only bank records the House Intelligence Committee has subpoenaed.”
“[We] found widespread evidence that Mr. Trump and his organization had worked with a wide array of dubious Russians in arrangements that often raised questions about money laundering,” the two wrote.
This is why I stopped replying to trolls in the past … they either do not understand or have contempt for the scientific method. Either way, I’m done.
The FOIA suit against man was not ‘regarding info on Dr. Mann’….it was a demanded for all of his research, much of which was conducted privately at HIS lab not at the UV,
and that Suit was BASED ON ABSOLUTELY NO EVIDENCE OF WRONG DOING OR FRAUDULENT RESEARCH….but it was based upon the Political / Ideological beliefs of the plaintiffs !
For Example….I believe you rape and beat your wife, therefor
I want to install cameras at you home and every restaurant you visit to prove it.
Obfuscation. The alarmist’s escape path. It doesn’t matter why an FOIA request is generated. Mann’s UV research was paid for, in part or in full, by taxpayer dollars. That means ANY public request for the work generated by those dollars should be reviewable by the public. There need not be evidence of wrong doing. THAT is a no brainer. If you don’t belueve that, then you must also believe routine audits are worthless exercises. Please, try to argue that.
And your analogy should have been more like, I paid you to inspect and repair my car. I want you to show me any/all parts you replaced and any printouts of tests performed. There, fixed it for ya.
NO obfuscation what so ever.
ALL of the Research, as mandated, by the UV.
..was PEER Reviewed
(true red team / blue team critical review)
..was PUBLISHED in Respected world Scientific Journals for wide spread critical review…and was REPEATEDLY
REPLICATED….
.
THE REPUBLICAN ATTORNEY GENERAL tried twice, to the tune of millions of tax payers dollars, to attack MANN’s
Research and Methods….and was SOUNDLY DEFEATED
TWICE..
primarily because HE HAD NO BASIS IN FACT to challenge.
The decision was quickly determined once the PUBLISHED WORKS WERE SHOWN TO THE JUDGE !
IN paper form and on the web.
DEAR
PITIFUL
ADAM….
YOU would have no right to ask for the BILL, the PARTS, or any explanation OF REPAIRS TO ” MY ” CAR.
And if you would take YOUR asinine claim to see my bill, my parts, and get an explanation of my repairs…..any judge and every judge would throw your ass out of court…and probably charge for costs.
Michael Mann’s lawyer Roger McConchie
(who is an expert in defamation/libel/slander law in Canada)
Contrary to the nonsensical allegations made by John O’Sullivan
in his July 4 posted on climatechangedispatch.com and elsewhere,
plaintiff Michael Mann has fully complied with all of his
disclosure obligations to the defendant Tim Ball relating to data and other documents.
No judge has made any order or given any direction, however minor or inconsequential,
that Michael Mann surrender any data or any documents to Tim Ball for any purpose.
Accordingly it should be plain and obvious to anyone with a
modicum of common sense that Mann could not possibly be in contempt of court.
Just to be clear:
Mann is not defying any judge.
He is not in breach of any judgment.
He is not, repeat not, in contempt of court.
He is not in breach of any discovery obligations to Ball.
In this context, O’Sullivan’s suggestion that Ball
“is expected to instruct his British Columbia attorneys to trigger
mandatory punitive court sanctions” against Mann is simply divorced from reality.
Finally, a word about the actual issues in the British Columbia lawsuit.
If O’Sullivan had read Ball’s statement of defence,
he would immediately see that Ball does not intend to ask the BC Court
to rule that Mann committed climate data fraud,
or that Mann in fact did anything with criminal intent.
O’Sullivan would have noticed that one of Ball’s defences
is that the words he spoke about Mann
(which are the subject of Mann’s lawsuit) were said in “jest.”
The BC Court will not be asked to decide whether
or not climate change is real.
So there is no chance whatsoever that any BC Court verdict about Mann’s libel claims
against Ball will vindicate Donald Trump’s perspective on climate change.
Roger D. McConchie
Lawyer
https://www.facebook.com/Mi…
https://www.irwinlaw.com/ti…
Ball does not need to prove that Mann’s work is flawed. That has already been done. The hockey stick graph has been removed from all IPCC releases. That should have been proof to anyone with a modicum of common sense.
Mann asked for an adjournment last Feb. Canadian courts almost always grant these as they are normally preludes to out of court settlements. But such adjournments need to be approved by both sides. Ball’s team agreed to the adjournment with the stipulation that Mann made his research docs available to the court by a certain date. Mann did not live up to the terms of the adjournment. If Mann has not been cited, it is because (as you noted) that the court is biased in his favor. No surprise there. And there is only one reason for Mann to deny releasing his research. It would prove what other analyses have already concluded, that Mann’s research is indeed flawed.
Normally, when one is in a losing position, one stops digging. As with most zealous alarmists, though, you simply grab a bigger shovel. Typical.
YOU SAY:
“Ball does not need to prove that Mann’s work is flawed. That has already been done. The hockey stick graph has been removed from all IPCC releases.”
FACTS:
Your comment is a work of FICTION. IPCC NEVER removed Dr. Mann’s hockey stick graph, nor has it been DEBUNKED.
There is NEW and MORE COMPLETE studies to reference and they have enhanced the Hockey Stick Graph…rather than ‘debunk’.
Look:
http://www.realclimate.org/images//Marcott.png
YOU SAY:
“…Mann did not live up to the terms of the adjournment. If Mann has not been cited, it is because (as you noted) that the court is biased in his favor. No surprise there.”
FACTS:
I never said the court was biased in MANN’S favor…In Canada these cases are presented to the court initially…the Court concluded that there was sufficient evidence for a claim of defamation against BALL
… and the COURT TOOK the case against BALL
……and prosecutes the case against BALL.
SILLY PERSON….Dr. Mann’s research was critically peer reviewed, then Published in a respected Scientific Journal,
it has been replicated and ENHANCED.
36 SEPERATE STUDIES, peer reviewed & published in respected international scientific journals.
Pitiful how deluded and OUT OF DATE you are.
***
***
Michael Mann’s lawyer Roger McConchie
(who is an expert in defamation/libel/slander law in Canada)
Contrary to the nonsensical allegations made by John O’Sullivan in his July 4 posted on climatechangedispatch.com
and elsewhere,
plaintiff Michael Mann has fully complied with all of his
disclosure obligations to the defendant Tim Ball relating to data and other documents.
No judge has made any order or given any direction, however minor or inconsequential, that Michael Mann surrender any data or any documents to Tim Ball for any purpose.
Accordingly it should be plain and obvious to anyone with a
modicum of common sense that Mann could not possibly be in contempt of court.
Just to be clear:
(1.)
Mann is not defying any judge.
(2.)
He is not in breach of any judgment.
(3.)
He is not, repeat not, in contempt of court.
(4.)
He is not in breach of any discovery obligations to Ball.
In this context,
O’Sullivan’s suggestion that Ball “is expected to instruct his British Columbia attorneys to trigger mandatory punitive court sanctions” against Mann is simply divorced from reality.
**
*
(( VANCOUVER News Papers have confirmed that NO ‘PUNITIVE COURT SANCTIONS’ have been sought ))
**
*
Finally,
a word about the actual issues in the British Columbia lawsuit.
If O’Sullivan had read Ball’s statement of defence,
he would immediately see that Ball does not intend to ask the BC Court to rule that Mann committed climate data fraud, or that Mann in fact did anything with criminal intent.
O’Sullivan would have noticed that one of Ball’s defences
is that the words he spoke about Mann
(which are the subject of Mann’s lawsuit)
were said in “jest.”
The BC Court will not be asked to decide whether or not climate change is real.
So there is no chance whatsoever that any BC Court verdict about Mann’s libel claims against Ball will vindicate Donald Trump’s perspective on climate change.
Roger D. McConchie
Lawyer
https://www.facebook.com/Mi…
https://www.irwinlaw.com/ti…
***
CO2 & Temperature Marriage:
https://www.bing.com/images/search?view=detailV2&ccid=%2f%2bt8mfVF&id=8999BA373F3B7B4F391B144E98514B474B7894CF&thid=OIP._-t8mfVFvINxHRaKkITjvAHaFT&mediaurl=http%3a%2f%2fzfacts.com%2fmetaPage%2flib%2fzFacts-CO2-Temp.gif&exph=377&expw=526&q=graph+co2+and+world+temperature+rise&simid=608046613771259242&selectedIndex=0&ajaxhist=0
https://en.wikipedia.org/wiki/Effects_of_global_warming#/media/File:2000_Year_Temperature_Comparison.png
The Greenland GISP2 ice core data (Quaternary Science Reviews) tells a completely different story. But I guess you would prefer to believe the output of a political org versus a scientific one. Sad.
THEY are defining GLACIAL EVENTS
….they do not redefine or undermine the above Holocene INTER GLACIAL WARM PERIOD, Its PEAK TEMPERATURES 8000-9000 years ago,
its STEADY DECLINE in temperatures toward the NEXTGLACIATION
and its ALARMINGLY SUDDEN termination in the mid to late 1700’s,
Despite the CONTUATION of the CAUSES of Glaciations on Earth….
Earth’s orbit pulling the planet away from the sun _Which continues !
Earth’s axial Tilt away from the sun____________ Which continues !
Earth’s wobble away from the sun _____________ Which continues !
The Stunning Termination of Earth’s most POWERFUL NATURAL CYCLE … GLACIATIONS…. in the mid 1700’s
We as US taxpayers should SLAPP Michael Mann for withholding OUR intellectual property. We paid for it, it is our data, not his.
Mann filed his SLAPP lawsuit against Mark Steyn? Steyn is one of the smartest people on the planet.
I would also like to see Tim Balls data that includes the Medieval Warming and the Little Ice Age data (Mann ignored both in developing taxpayer’s ‘hockey stick’).
“Steyn is one of the smartest people on the planet.”
>> Maybe, maybe not. What is a fact is that Mark Steyn has absolutely no climate science credentials whatsoever. None.
“I would also like to see Tim Balls data that includes the Medieval Warming and the Little Ice Age data”
>> I’d like to see them too. Dr. Ball hasn’t published any peer-reviewed climate science in over 25 years.
George Marshall told Dwight Eisenhower that he would not let Ike see action because Ike had never even commanded a platoon.
Does that mean Ike should not have been Supreme Commander of Allied Forces in Europe?
Your remark about Tim Ball is just as much a non-sequitur.
Think about it a little…comparing Ball to Eisenhower is an empty comparison…comical really. Dr. Ball regularly presents “findings” that contradict the scientific literature. He hasn’t published anything in years. Why should he be considered an authority on the current state of climate science?
Retirement doesn’t prevent one from understanding and commenting on the subject they spent their working career studying. As a matter of fact, it frees them from the pressures put on them by managers, peers, and grant orgs.
“Retirement doesn’t prevent one from understanding and commenting on the subject they spent their working career studying“.
>> Of course it doesn`t. Neither does it negate the conclusions of the the scientific literature on climate change that have accumulated over the past 25 years, the vast majority of which continues to reinforce that GHGs from human activity are warming the planet`s climate system; the evidence is unequivocal. Why not inform yourself: https://climate.nasa.gov/evidence/
Next to none of it deals with causation, because it can’t be established.
Misleading statement. There are multiple, independent lines of evidence studied by thousands of scientists from many jurisdictions and agencies around the world that indicate that global warming is unequivocal.
‘Dr. Ball regularly presents “findings” that contradict the scientific literature’… YOU’VE lost the plot here. Ball presents data and evidence that accords with the scientific method… EVERYTHING he writes can be checked, all his data is there for everyone to see. He makes NO predictions using modelling techniques he keeps secret. You ABSOLUTELY cannot make those claims for Mann.. If Clausius stepped out of his grave today, knowing nothing of the invented ‘science’ called ‘climate science’, he could destroy Mann’s house of cards in 5 minutes. The Laws of Physics completely refute the bedrock claims that underpin the entire shambolic structure called ‘climate science’.
“Ball presents data and evidence that accords with the scientific method… EVERYTHING he writes can be checked, all his data is there for everyone to see.“
A little rich don`t you think? Moreover Dr. Ball`s positions on climate science and those of the silly “Friends of Science“ are diametrically opposed with the positions of NASA, NOAA, British Atmospheric Data Centre, Environment Canada, IPCC, National Academy of Sciences, American Meteorological Society, American Geophysical Union and virtually every US and international scientific academy.
Keep in mind that the positions taken by the above societies don’t necessarily reflect the opinions of their members.
Yet these they reflect the findings of scientists from a range of different disciplines, from multiple countries and jurisdictions, and government and non-government sectors. Conspiracies are the stuff of Alex Jones and other extremists.
This is not a ‘conspiracy theory’. This is a scientific discourse. There are deep, fundamental flaws in the global warming agenda. The conspiracy is in fact the other way round, there is a conspiracy to deny any opposition to the agenda – see Climategate emails where this is spelled out clearly – see UN statements that ‘unless we show disasters, nobody will listen to us’.
“…see UN statements that ‘unless we show disasters, nobody will listen to us’.”
>> Untrue statement, a manufactured talking point of the climate denial industry designed to intentionally mislead. Attributed to former IPCC Co-Chair Sir John Houghton, yet he never stated such a thing. You have been duped:
http://www.independent.co.uk/environment/climate-change/fabricated-quote-used-to-discredit-climate-scientist-1894552.html
More name-calling.
You need to look at the facts, not the purveyors you mention. Don’t forget, Galileo was opposed by every single institution yet he was right. The Earth DOES go round the Sun: his DATA proved it. All the bodies you mention take it as fact that the data they obtain from Goddard and Hadley/CRU (the only 2 sources they all use as source data) is correct and they put that into their models. But.. the data has been fiddled to remove past warming events, thus making any current warming – however small – appear disproportionately large. This fundamental problem is then exacerbated by hopelessly biased model which are designed to produce apocalyptic warming 100 years hence, even though they are universally unable to reproduce reality… run ANY model using the start data of, say, 10 years ago and compare the output month by month to what we know ACTUALLY happened and you will see they all fail spectacularly. The reason they do this: they are ALL feeding at the grants/subsidies trough and need to show future disasters or all their funding will disappear. Ball and others simply point out all the discrepancies in the data, the fallacy that the models are reliable, and the problems with the basic laws of physics arising from the theory that man-made CO2 has led to significant temperature rises which will only get worse: there is no scientific basis for this claim, it is just a politically expedient claim that generates huge funding for any body willing to take the shilling. Read sepp.org and wattsupwiththat.com for detailed analysis of all this. We’re not making this up!
References to Galileo in the context of climate science are nearly as frequent as they are absurd: https://qz.com/1069298/the-3-of-scientific-papers-that-deny-climate-change-are-all-flawed/
Your response displays profound ignorance on a world class gold medal level. Are you totally unaware that the initial claim of a ‘97% consensus in favour of man-made global warming’ is itself an utterly discredited claim? This has been so thoroughly debunked so many times that it is remarkable it keeps getting trotted out. Given that the 97% figure is complete bunk, why would anyone bother to comment on the remaining 3%? It’s like arguing how many angels can dance on the head of a pin. The answer doesn’t matter because there are no angels.
You don’t seem to get the basic point about Galileo, which is as relevant today as it was when he was first condemned for his data. It is this: consensus is not a valid concept in proper science for deciding the validity of any particular proposition. What counts – the only thing that counts in this case – is the raw unmassaged data and its employment using standard statistical techniques in a logical theory that obeys the known laws of physics and chemistry. If you follow that dictum your conclusion will be the same as mine: man-made global warming as a result of CO2 is on an extremely small, statistically insignificant scale indistinguishable from noise and not requiring any action by us. There are far more important issues on which to spend our money.
“What counts – the only thing that counts in this case – is the raw
unmassaged data and its employment using standard statistical techniques in a logical theory that obeys the known laws of physics and chemistry. If you follow that dictum your conclusion will be the same as mine: man-made global warming as a result of CO2 is on an extremely small, statistically insignificant scale indistinguishable from noise and not requiring any action by us.”
Please do explain your logical theory and provide the data that supports it. I’m all ears.
Now you’re just being silly.
You want me to provide a theory for something that isn’t happening? This is not how it works.
As an example, there’s also no theory for why you can’t observe angels dancing on the head of a pin. (hint: There is definitely a pin, but there are no angels.)
If you do want to study the science seriously, a good place to start would be Professor Fred Singer’s book ‘Unstoppable Global Warming: Every 1500 Years’. It’s a rattling good read.
The central point is there is no reliable data to show temperature excursions are abnormal, therefore there is no issue. You don’t need a theory for this. It’s how things are.
The only abnormal excursions are either the result of fiddled data (for example the farcical Mann hockey stick), OR cherry picked data from locations that will inevitably show temperature rises (such as those close to towns) OR the projections from innumerable climate models, all of which fail the most basic credibility test: start each model one year in the past and run them against the actual data which was measured over the year. They all fail to track reality reliably. You shouldn’t be surprised at this: climate is an enormously complex system which we hardly understand at all.
‘Climate alarmism’ isn’t a science-based phenomenon, it is driven by political and social agendas, by people who want to create a new economic system and redistribute wealth to the second and third worlds. There’s nothing wrong with having such ambitions. Maybe capitalism is indeed crap and has failed the poor. Just don’t cloak the argument with fake science. If the agenda makes sense it will stand on its own feet.
Of course all those currently feeding at the deep troughs of money that is funding ‘climate research’ will lose their golden eggs, but there are plenty of far more useful things for society to spend its money on. I could do with a new car, as one example.
I’m being silly?
All you’ve got is conspiracy theories and the bizarre notion that a reduction in climate research funding will buy you a new car.
Your profound ignorance disbars you from further consideration. You are even unable to distinguish a joke when you see one.
Unfortunately, your own ignorance is far from profound. It is as common as muck, and as dimwitted as your “jokes”.
You are thicker than a tar-flavored Frosty.
How you can be literate enough to type your drivel and yet stupid enough to believe it is one of life’s eternal mysteries.
I can’t help but notice your avatar is a bloodsucking mosquito. It seems somehow appropriate.
The sad thing from society’s viewpoint is that it is zealots such as yourself who have so far allowed to be wasted hundreds of billions of our precious taxpayer money on a madcap theory of man-made global warming which is devoid of rationality. Bloodsucking indeed.
Your certainty makes one think of religious zealotry, and in this case it is equally unfounded in logic, scientific rigour and an appreciation of irony.
The simple, inescapable fact is the ONLY significant increase in global temperatures outside the bounds of natural variability is the result of models which are preposterously inadequate, or of cherry picked data, or of faulty statistical forecasting. Satellite data from Huntsville, Alabama shows no such increases, and since this data can be read in its raw state by anybody before agenda-driven busybodies get hold of it to perform their fiddles, we are entitled to regard this data as the best available.
No temperature excursions = no global warming = no problem
Let’s spend our money on useful endeavours, like cures for dreadful diseases, better schooling, proper medical care for everybody, reduction in poverty.
“Satellite data from Huntsville, Alabama shows no such increases, and since this data can be read in its raw state by anybody before agenda-driven busybodies get hold of it to perform their fiddles, we are entitled to regard this data as the best available.”
Not if you care about scientific accuracy. As the wiki on this very dataset points out:
“Satellites do not measure temperature directly. They measure radiances in various wavelength bands, from which temperature may be inferred.[1][2] The resulting temperature profiles depend on details of the methods that are used to obtain temperatures from radiances. As a result, different groups that have analyzed the satellite data have obtained different temperature data. Among these groups are Remote Sensing Systems (RSS) and the University of Alabama in Huntsville (UAH). The satellite series is not fully homogeneous – it is constructed from a series of satellites with similar but not identical instrumentation. The sensors deteriorate over time, and corrections are necessary for satellite drift and orbital decay. Particularly large differences between reconstructed temperature series occur at the few times when there is little temporal overlap between successive satellites, making intercalibration difficult.”
Arguments from authority are worthless. If you have the necessary facts and data to prove a hypothesis, you win. If not, you lose. Mann has neither of those things on his side and he has demonstrated his contempt for the scientific process (and his legitimate critics) by refusing to release his data.
NOAA. NASA. HADCRUT. A recent peer reviewed paper proves that they have repeatedly manipulated the data. Their credibility is on a par with Mann and Hansen.
What “recent peer reviewed paper” would that be? Surely you don’t mean the PDF of D’Aleo’s WordPress blog post that Breitbart’s Delingpole and other misinformers have been promoting as peer-reviewed science? Not peer-reviewed, nor does it “prove” anything.
What’s been proven about man made CO2 and global warming/ climate change/ whatever it gets labelled next when the data fails to conform to the theory?
Hard to say-it’s a race to the bottom!
“NASA, NOAA, British Atmospheric Data Centre, Environment Canada, IPCC, National Academy of Sciences, American Meteorological Society, American Geophysical Union”. Each and every one a politically driven organization whose “data” has been soundly refuted time and again by real scientists.
Untrue statement intentionally designed to mislead and misinform. That every reputable scientific organization is somehow conspiring to manipulate climate data and scientific findings isn’t plausible.
Not conspiracy, just pure politics.
Starting to sound like “Blah blah blah blah blah blah”. TROLL
Your own self assessment perhaps. Repetition of talking points and childish name-calling.
Wow. You really are drunk with blindness and you just don’t care about losing the wealth that you’ve established in your life or your family’s wealth because you will lose it if you continue to go along with this hoax. These government agencies have come out in the last 10 to 15 years with Data that was misrepresented in underminded the actual study of global warming because there was zero global warming and it was global cooling. If you use half of the temperature gage is around the world and warmer climate you can make anything look like it’s heating up around the world. But if you use the average of all the temperature gauges around the world we have been cooling not warming.
Hey, Rip Van Winkle – wake up!
https://www.nytimes.com/2017/01/18/science/earth-highest-temperature-record.html?mcubz=3
You will just believe anything won’t you? The New York Times ha ha they are the biggest piece of crap lying newspaper. Have you ever heard of the New World Order or the Bilderberg Group? Have you read Agenda 21? I feel sorry for people like you that actually believe in Al Gore’s global warming theory. It is a theory and that is all it is just like the big bang theory. I have a question for you how long have we been taking temperature readings around the planet?
Hey, if you have any alternative sources that contradict the data, pull ’em out.
I’m sure we’d all like a laugh.
Apparently you can’t answer any of my questions that I asked you.
And apparently you’ve got nothing but absurd conspiracy theories yet again.
You still can’t answer my questions because your knowledgebase is limited.
Apparently you’ve never been in the library before or open up a search engine and look for these topics because they do exist. It has nothing to do with conspiracy theories because it is all facts not fiction. Your ignorance is bliss.
So let me get this straight – you’re trying to tell ME how to use a search engine after you’ve posted three useless irrelevant links?
Ignorance is bliss.
…as much as I hate to disrupt your euphoria: https://www.scientificamerican.com/article/the-window-is-closing-to-avoid-dangerous-global-warming/
BS.
Climate Depot: Special Report: A-Z Climate Reality Check
Sub-prime Science Expose’: “The claims of the promoters of the man-made climate fears is failing.”
The three research papers that debunk your false narrative were true because you had them removed from this site. Apparently your to young and your wheel house has zero knowledge of the New World Order, George Soros, the Bilderberg Group. Agenda 21 and so on.
LMAO
I have no power to remove anything from this site. If anything was removed, it is because the moderators do not tolerate deranged conspiracy theories about the New World Order, etc.
hallofrecord.blogspot.com/2007/02/extreme-temperatures-wheres-global.html
http://www.climatedepot.com/?=temperatures+for+past+10+years
newsweekly.com.au/article.php?id=57680&s=LURQEd
Neither of your links go to anything pertinent.
All heavily infiltrated by #BigGreen.
TROLL
Still blinded by all those government agencies I wonder why because you think government agencies have the end-all and be-all of everything and they are just the fact finding people of the world and they are gods because when they say something it’s the God honest truth. BS they are bought and paid for by governments around the world to continue the hoax of global warming, carbon emissions and climate change. This government tax is to steal wealth from every nation so that the billionaire elites can line there pockets such as George Soros the face end up at master of the New World order.
Such arrogance. Einstein also went for years without publishing any papers. Should that fact be used to impugn or discount his understanding of physics? My God, you really are hopeless.
I’ve had a couple of conversations with Ball. He has seen enough climate change and studied enough history to know that climate change, sometimes catastrophic, has always been a feature of life on this planet. He has absolutely nothing to gain by questioning the alarmism.
He kicked Mann’s ass from here to Christmas in BC Supreme Court. Go home troll, the game’s over. http://principia-scientific.org/breaking-fatal-courtroom-act-ruins-michael-hockey-stick-mann/.
Hilarious that you would cite the disinformation site principia-scientific. Oops there’s Tony Heller aka Steve Goddard again. No climate science credentials whatsoever.
You’re not a scientist and we have to listen to you and you’re spewing your nonsense.
“What is a fact is that Mark Steyn has absolutely no climate science credentials whatsoever. None”
So, what you’re saying is we should blindly trust people with credentials who lie to us versus a layman who researches the subject and tells us the truth. Got it.
Nope. On the contrary, what I am suggesting is that you should think twice before blindly trusting people – particularly political pundits – on scientific matters when they have no scientific credentials whatsoever.
But what if I AM a scientist, and agree with everything he said? And trusting people, just because they have certain credentials, is a recipe for disaster. The DATA, not a reputation, not credentials, are what matters. This observation somehow slipped by you.
“But what if I AM a scientist, and agree with everything [Mark Steyn] said?“
>> Then you`d be in the company of a small handful of well-known contrarions with extreme views and be supporting a position that is diametrically opposed to the positions of NASA, NOAA, British Atmospheric Data Centre, Environment Canada, IPCC, National Academy of Sciences, American Meteorological Society, American Geophysical Union and virtually every US and international scientific academy.
That Hockey stick was discredited long ago, 2002 or 03, by Canadian scientists Stephen McIntyre and Ross McKitrick DR, Richard Muller, a professor of physics at University of California at Berkeley, He is also a faculty senior scientist at the Lawrence Berkeley National Laboratory. wrote an article about it, and he is a believer in human induced climate change. below are parts of it
But now a shock: Canadian scientists Stephen McIntyre and Ross McKitrick have uncovered a fundamental mathematical flaw in the computer program that was used to produce the hockey stick. In his original publications of the stick, Mann purported to use a standard method known as principal component analysis, or PCA, to find the dominant features in a set of more than 70 different climate records.
But it wasn’t so. McIntyre and McKitrick obtained part of the program that Mann used, and they found serious problems. Not only does the program not do conventional PCA, but it handles data normalization in a way that can only be described as mistaken.
Now comes the real shocker. This improper normalization procedure tends to emphasize any data that do have the hockey stick shape, and to suppress all data that do not. To demonstrate this effect, McIntyre and McKitrick created some meaningless test data that had, on average, no trends. This method of generating random data is called Monte Carlo analysis, after the famous casino, and it is widely used in statistical analysis to test procedures. When McIntyre and McKitrick fed these random data into the Mann procedure, out popped a hockey stick shape!
If you are concerned about global warming (as I am) and think that human-created carbon dioxide may contribute (as I do), then you still should agree that we are much better off having broken the hockey stick. Misinformation can do real harm, because it distorts predictions. Suppose, for example, that future measurements in the years 2005-2015 show a clear and distinct global cooling trend. (It could happen.) If we mistakenly took the hockey stick seriously–that is, if we believed that natural fluctuations in climate are small–then we might conclude (mistakenly) that the cooling could not be just a random fluctuation on top of a long-term warming trend, since according to the hockey stick, such fluctuations are negligible. And that might lead in turn to the mistaken conclusion that global warming predictions are a lot of hooey. If, on the other hand, we reject the hockey stick, and recognize that natural fluctuations can be large, then we will not be misled by a few years of random cooling.
A phony hockey stick is more dangerous than a broken one–if we know it is broken. It is our responsibility as scientists to look at the data in an unbiased way, and draw whatever conclusions follow. When we discover a mistake, we admit it, learn from it, and perhaps discover once again the value of caution.
A small handful? Are you frigging retarded? How about 31,247 American scientists who are quite open about their disbelief and signed onto the NPCC report? How about the 65 % off members of the American Academy of scientists who DON”T support that idiot mann? How about all of the scientists who have testified before congress clearly stating , and backing up with data, that ACC is a scam? You are clearly an uneducated liberal MORON
Name-calling…the preferred strategy of propagandists and the poorly educated.
And “well-known contrarians with extreme views” is not name-calling? How about the grotesque Holocaust smear (“deniers”) so many of your climate change pals are so fond of hurling at scientists who disagree with your dogma? Have a look in the mirror, pal.
Sorry you are offended, I didn’t use the term “denier” in the above comment so go complain to someone else.
No, referring to a 3rd party as a “contrarian with extreme views is not the same as responding childishly to a commenter with words like moron,
Scott you are correct he is a moron.
Why not explain why you disagree with my view and the position of virtually every reputable US and international scientific organization and academy instead of resorting to childish name-calling?
Being called a moron is not name-calling it is a fact. If I wanted to name call you I would say something totally different but being called a moron is factual.
As I stated up-thread, name calling is a strategy typically used by propagandists, the poorly educated and those harbouring feelings of inadequacy.
Your ignorance is bliss.
Says the frequenter of the silly Infowars conspiracy site and other rubbish sources customized for the gullible.
This website has nothing to do with the infowars this website is called CFACT. Ian I feel sorry for people like you so gullible. Ask Al gore how much he’s making on the hoax of global warming, carbon omissions and climate change? Have you notice how big his house is and how big his jet is that he flies around the world? Follow the money Ian. I am not suggesting that we do not become good stewards of our environment, of our relationships between human beings and our stewardships of life. But what I am suggesting is that this money making system for the billionaire elites that run the world such as George Soros a.k.a. puppetmaster and leader of the New World Order.
Where do you obtain your information?
By the way I wasn’t name-calling I asked Tecca question and he couldn’t answer my questions. Because he’s not honest about his knowledge base. And you’re the propagandist my friend not me. You’re the one it’s poorly educated not me and I don’t feel inadequate it all I feel just fine thank you very much. I feel sorry for people that actually believe in gores BS hooks on global warming him, climate change and or carbon emissions.
“How about 31,247 American scientists”
>> A reference to Art Robinson’s silly long-debunked Oregon Petition Project. Go look it up.
“…the NPCC report?
>> Do you mean the Heartland Institute’s ridiculous NIPCC report? Heartland Institute…not a scientific organization. Lobbyist for the tobacco industry…. Its report does not even purport to summarize the scientific literature. Why would you believe such rubbish.
“65 % off members of the American Academy of scientists who DON”T support [Mann]”
>> Hopeless rubbish, you just made that up.
“You are clearly an uneducated liberal MORON”
>> Name-calling is a strategy typical of propagandists, bullies and the poorly educated.
Nasa believed that there were canals on Mars, until 1998. The canals were first proposed in 1789. before 1950 there was a cosensus that Martians were trying to signal earth. Experts, what does tht even mean.
(93) Scientific Consensus And Mass Delusion – 150 Years Of Scientific Insanity – YouTube
Provides link to silly video posted by well-known misinformer Tony Heller (aka Steven Goddard). He has no climate science credentials whatsoever. Why do you think he is credible? Would you trust your heart condition to a plumber?
And alGore has climate credentials…?
Yet you’re happy to accept his disgustingly dishonest narrative
Deflection…the article isn’t about Al Gore. You pointed to Heller’s silly rubbish and I’m calling you on it. Heller’s views are extreme and diametrically opposed to the positions of NASA, NOAA, National Academy of Sciences, American Meteorological Society, Geological Society of America, American Geophysical Union, American Association for the Advancement of Science, British Atmospheric Data Centre, Environment Canada, IPCC and virtually every US and international scientific academy.
All those government organizations are given taxpayer money to continue the hoax of Al gores global warming. You can’t even think for a second outside the box that these organizations actually could be taking money and promoting an absolute hoax? Of course not because you’re so ignorant, uneducated and uninformed .
“…promoting an absolute hoax”.
>> Why not start by educating yourself about the science , evidence and implications of climate change instead of intentionally trying to mislead readers.
https://climate.nasa.gov/evidence/
You can’t refute any of it.
NASA is bought and paid for by government a.k.a. taxpayers money. Can refute all of it because it’s all lies and you want to talk about misleading that you. I will bet you could not be fair minded and actually look and research and study and find out that this whole thing that Gore has started is one big HOAX. Why don’t you follow the money that is made and ask yourself how? Why? Who?
The organizations you cited have been proven to have manipulated the data. Repeatedly.
Untrue, unsubstantiated statement intentionally designed to mislead and misinform. If your ridiculous statement were true, then cite some organizations that you feel are trustworthy and tell us why.
Absolutely true.
NASA, NOAA, British astronomy data center, Environmental Canada, IPCC and other government agencies are bought and paid for with taxpayers money to do exactly what the New World Order tells them to do. George Soros the puppetmaster and leader of the New World Order tells them exactly how to tax everybody around the world to steal the wealth of the world because they don’t have enough money already.
Ridiculous conspiracy fluff that is promoted by multiple disinformation sites. No evidence whatsoever. Remarkable how many people fall for this rubbish.
Your ridiculous and you need to stop your ignorance and being so uneducated that you believe everything that you hear from the IPCC and every other government organization that’s full of crap. You’re so ignorant and you’re so blinded that you’d rather be taxed of all your wealth then realize that they’re playing an absolute hoax and lies with regards to global warming, climate change and carbon emissions.
“Appeal to Authority” is a logical fallacy. Like Michael Crichton said “The claim of consensus is the first refuge of scoundrels”.
Incorrect talking point. Argumentum ad Verecundiam is an argument from an inappropriate authority — an appeal to an authority outside the authority’s special field of expertise. Appeals to legitimate bodies and experts is a perfectly admissible form of inductive argument.
Just because Ian says so that’s what we’re supposed to believe try again Ian. Your ignorance is so bliss that most people on this website don’t even listen to what you’re saying because you’re a fool and your arrogant and ignorant.
It is well known that the leadership within these orgs is dominated by progressives. That missives from these orgs (generated ONLY by those leaders) is pro-alarmist is not surprising. The AMS was the only org that actually took a vote of its members regarding AGW. The result? About 50:50. I imagine every other org shuddered and prevented such votes from being taken. So much for your appeal to authority. A tactic of losers.
“The AMS was the only org that actually took a vote of its members regarding AGW. The result? About 50:50.”
>> No, your ridiculous statement is a complete myth. The last survey of the American Meteorological Society was conducted in 2016. The survey concluded that “Nearly all AMS members (96%) think climate change – as defined by AMS – is happening, with almost 9 out of 10 (89%) stating that they are either ‘extremely’ or ‘very’ sure it is happening. Only 1% think climate change is not happening, and 3% say they don’t know.”
https://gmuchss.az1.qualtrics.com/CP/File.php?F=F_cRR9lW0HjZaiVV3
The AMS has a very strong position statement on Climate Change that readers can access here:
https://www.ametsoc.org/ams/index.cfm/about-ams/ams-statements/statements-of-the-ams-in-force/climate-change/
Wow. So we’re supposed to put a lot of faith in a poll where less than a third of the members responded, was performed by an institution well known for its alarmist leanings, and did not guarantee the anonymity of responders. Right, like that’s going to produce believable results.
I suggest you look beyond data. Data are not the same as information, knowledge, understanding and wisdom.
Right. So fundamental physical facts (i.e., data) don’t matter in a scientific debate about matters that involve atmospheric physics??
I suppose you think that the “wisdom” and “information” of people like Al Gore supersede all that nonsense about data.
But as Adams once said, “Facts are stubborn things.” (Especially facts like the unexplained 20-year warming pause we’re currently experiencing.)
Fundamental physical fact: Humans have increased atmospheric CO2 concentration by more than a third since the Industrial Revolution. Increasing atmospheric CO2 is responsible for a stronger greenhouse effect that is warming the planet.
Why not inform yourself: https://climate.nasa.gov/evidence/
“Fundamental physical fact: Humans have increased atmospheric CO2
concentration by more than a third since the Industrial Revolution”
You can’t show that is true. All you can do is link to sites that hype the scare tactics of increased CO2. THEY can’t substantiate your statement either.
Why do you bother to troll here? You aren’t a scientist and are convincing no one with your garbage (or is it rubbish). Do you think you are saving the world?
Humans have indeed increased atmospheric CO2 concentration by more than a third since the Industrial Revolution. Over 25% in the past 60 years. Unequivocal; why not inform yourself: https://scripps.ucsd.edu/programs/keelingcurve/wp-content/plugins/sio-bluemoon/graphs/mlo_full_record.png
You can make that claim all day long, yet you can’t substantiate it. Your graph is meaningless. Why not take your head out of the sand and realize that you don’t have a clue? I have offered a link to an atmospheric physicist that shows what you believe is bogus. What’s the matter, can’t you absorb his explanation?
“You can make that claim all day long, yet you can’t substantiate it. ”
>> Your statement is false. The Keeling curve presents direct evidence of rising atmospheric CO2; measurements have been taken continuously since 1958. You cannot refute it.
Ed Berry’s views on climate change are extreme…it is not his research area and besides he hasn’t published any peer-reviewed science since the 1980s as he freely admits: http://edberry.com/dr-ed-berry/publications/ . There is ideology not science all over his website.
Please educate yourself: https://climate.nasa.gov/evidence/
You haven’t refuted Ed berry’s views. All you have done is regurgitated garbage from Patrick Moore. What kind of expert is he? Ed Berry addresses every one of his criticisms and Moore can’t refute it. You’ve been to his site and YOU can’t refute Dr. Berry. He simply doesn’t align with your naive understanding of climate science. He uses the scientific method. You and your ilk don’t. It IS that simple!
“…What’s the matter, can’t you absorb his explanation?…”
This is the problem of trying to persuade a scientific ignoramus, using logic and facts – his brain is so full of indoctrinated rubbish that there’s no space for facts. Or even for doubt.
Like you, I’ve offered easily-understood evidence, but he keeps bouncing back with comments about absent credentials… Weirdly (or perhaps not) he sees no irony in accepting AlGore’s nonsense, despite his clear “lack of credentials”.
I know he can’t be persuaded to reason honestly; and I’m not trying to convince him… The only reason I bother to respond is for the others who might be reading these comments. I hope that some percentage of readers take the trouble to do a bit of research of their own, rather than accept the current narrative that we’re all ‘climate sinners’ and deserve to die because we’re “polluting” our atmosphere with carbon dioxide.
They will ignore the hugely beneficial effects of higher CO2 levels… the widespread rebound in plant growth everywhere, as we emerge from the CO2 famine of the last thousand years.
The loony Warmists haven’t the capacity to understand that CO2 can only be considered a pollutant when water vapour is considered the same way.
1.The climate was not better at lower levels of CO2
2.The climate would not get better if we reduced CO2 levels
3.The NASA temperature record is complete garbage
https://stevengoddard.files.wordpress.com/2015/01/nasasurfacetemp1981-1999-20141.gif
Another link to disinformation professional Steve Goddard (his real name is Tony Heller), Steve and Tony have no climate science credentials whatsoever. He hasn’t published a single journal article, not one.
how can you explain the satellite data?
Fill your boots:
https://data.giss.nasa.gov/gistemp/
that’s not satellite
Here you go… RSS dataset prepared by Remote Sensing Systems: http://www.remss.com/research/climate.html
And some helpful context and summary: http://www.remss.com/research/climate.html
Figures 4 and 7 show no indications of runaway warming with 3x amplification from water vapor. Global warming is a hoax.
“Global warming is a hoax”
>> Instead of spreading disinformation and other shallow rubbish why not educate yourself:
https://climate.nasa.gov/evidence/
i think it’s you that needs to. it’s a scam.
The climate change, global warming and or carbon emissions that Gore is spewing is a hoax. This is why Gore is a multimillionaire and would like to continue stealing your wealth.
NASA never takes information and dilutes it or gives us disinformation!
NASA never tells a lie!
Let us ask you again – what credentials do you have?
More bullshit.Why do you only show the chart going back to 1960?
Because if you go further back the CO2 levels were higher and it makes your chart look stupid and insignificant,that’s why.
https://en.wikipedia.org/wiki/Ice_core#/media/File:Vostok_Petit_data.svg
Why is it bullshit? It is the well-known Keeling curve — direct measurements of atmospheric CO2 that have been taken uninterrupted since the late 50s. The graph you provided reflect CO2 levels derived from ice-core data — the graph does not include increases from the past century. The two are entirely consistent. Have a look a these graphs that put the two series together over a range of timescales:
https://scripps.ucsd.edu/programs/keelingcurve/
As you can see, current CO2 levels of 406 ppm have not been a feature of the planet for over 800,000 years, perhaps much longer:
https://scripps.ucsd.edu/programs/keelingcurve/wp-content/plugins/sio-bluemoon/graphs/co2_800k.png
Again,CO2 levels have been far higher than that.
https://stevengoddard.files.wordpress.com/2012/05/image277.gif
And your point is what? That there is no cause for concern or need for action?
The planet does what it does and we are not the cause and there is nothing we can do about it anyway.
What is your solution?
Kill off all humans?
You are a dumbass if you think there is anything we can do about it.
Yes
He’s thinks that if it was good enough for the dinosaurs, it’s good enough for us. In fact, he’s willing to bet on it – I cash in when these clowns play poker on-line.
And the dinosaurs enjoyed it – are you certain we will?
Doesn’t matter, the Earth is going to do what it’s going to do regardless of how we feel about it.
True, but irrelevant to the fact that we continue to annually take millions of tons of carbon sequestered deep in the earth and inject it into the active biological carbon cycle. The Earth will survive our arrogant and ignorant tampering.
Our grandchildren may not.
What a load of crap.You are just regurgitated and repeating nonsense you heard through the propaganda machine.
You sound like all the other climate alarmists.You all sound like brainwashed parrots.
We can’t predict the future so there is no way we can stop the countless amounts of NATURAL disasters that can happen.All we can do is deal with them when they happen.Like we are doing with hurricane Harvey now.
If you think we should put all our resources into stopping CO2 which is NOT A POLLUTANT and then all will be fine for our grandchildren,then you are truly an idiot.
There are always dangers in our world and CO2 certainly isn’t one of them.
Superstorms like Harvey depend upon a warming world.
In case you care to understand what I’m talking about: https://paulbeckwith.net/2017/09/01/science-of-superstorms-after-harvey-whats-next/
More complete bull.
Tropical storms,droughts and hurricanes have all been decreasing.
http://www.climatedepot.com/2017/07/31/extreme-weather-expert-world-is-presently-in-an-era-of-unusually-low-weather-disasters/
And people dying from extreme weather events has also declined massively.
https://wattsupwiththat.files.wordpress.com/2011/09/extreme_wx_deaths.png
Your chart has little to nothing to do with weather patterns, and much to do with advances in medicine , transportation, and rescue technologies and methods.
This U.S.-centric map might be what you meant to post: https://www.ncdc.noaa.gov/extremes/cei/graph
I posted two charts.One of extreme weather reduction and one of deaths from extreme weather.The death reduction is because of less disasters AND improvements in technology and the use of fossil fuels.
You linked to one dubious chart and posted another. The timelines of each are generally unrelated, and the datasets used to compile them are not provided and the claimed sources are at best vaguely referenced.
It’s far from science: https://qz.com/1069298/the-3-of-scientific-papers-that-deny-climate-change-are-all-flawed/
Every chart you don’t like is ‘far from science”.
Then you send me an article from Reuters.LOL Leftist garbage.
Those charts that I posted are right from NOAA.
You don’t even understand how real science works.
Here is how.
https://pbs.twimg.com/media/C8MWqemXoAEwrpq.jpg
Those charts you posted were directly from ClimateDepot. There was no source directly attributed.
CLIMATE DEPOT got them from NOAA if you actually read it and looked at the references.
I made my statement because I read it and could find no such reference. You repeat your unsubstantiated claim because you cannot provide it.
The charts have the sources right on them.
You are about as perceptive as you are intellectual.
Still playing the fool?
There is no cited dataset from NOAA, only the claim. The chart is the author’s, not linked to NOAA.
The same is true of the 2nd chart. He claims the data is from Munich/RE, but does not specify any study or publicly-accessible record. The link provided under references is to a press release that does not contain the chart nor any reference to the data attributed, an article entitled: Natural catastrophe review for the first half of 2017
During my time in university, such sloppiness earned students a failing grade. How does Professor Pielke keep his job?
Came across this today.
Thought you might be interested in learning of the danger posed by CO2 apart from the warming effect: https://phys.org/news/2017-09-mathematics-sixth-mass-extinction.html
And even more studies have come out saying that all the models were and are wrong.
http://www.telegraph.co.uk/science/2017/09/18/immediacy-threat-climate-change-exaggerated-faulty-models/
You clearly didn’t read the link I posted. It had little to do with climate change, it was about acidification of the oceans. Knee-jerk reactions have no place in rational debate.
And BTW, your article is unavailable without subscription – but even in the accessible first paragraph it does not dispute climate change, only the rate at which it is progressing.
I skimmed it because it’s garbage.
https://www.youtube.com/watch?v=HhMRpIRby8A&t=768s
ROTFLMAO
healthrangerstore.com vs. Scientific American?
BTW, ocean levels and acidification are unrelated. I’m suspecting you’ve only ‘skimmed’ the article because you didn’t understand a word.
For your information Mike Adams is a scientist.
Scientific American just writes whatever bullshit they are told and do no research of their own just like you.
Scientist? Never.
His primary success has been as a spam artist – and taking advantage of the suckers born every minute: https://healthwyze.org/reports/616-special-report-the-legend-of-mike-adams-and-the-reality
It’s definitely good for the plants.
And so?
Your sleazery is ALMOST on par with Michael Mann’s.
https://wattsupwiththat.com/2012/03/07/a-detailed-review-of-manns-book-the-hockey-stick-and-the-climate-wars-as-it-relates-to-the-wegman-report-to-congress/
Yet another link to another disinformation site…and the author is commenting on a topic in which he has no credentials.
Bullshit.
https://en.wikipedia.org/wiki/Ice_core#/media/File:Vostok_Petit_data.svg
What are you referring to? The graphics are based on Petit et al. Excellent work, published in Nature. What don’t you understand about it?
http://www.jerome-chappellaz.com/files/publications/climate-and-atmospheric-history-of-the-past-420-000-years-from-the-vostok-ice-core-antarctica-38.pdf
“…the author is commenting on a topic in which he has no credentials…”
This is a repetitious mantra of yours.
One doesn’t need “qualifications” in climate science to recognise fraud when it’s there… and it’s there “in spades”.
But calling Anthony Watts ‘unqualified in climate science’ exposes you as someone who’s not done the same level of research which you so demand of others on this list…
By your “strict” standards, Al Gore’s two docudramas and many, many public scarefests should be irrelevant (as indeed they are) because, as a person with “no credentials in the topic”, he’s not qualified to have- or voice an opinion.
We don’t see your condemnation of this well-known fraudster and public-funds thief. Why are you so openly selective, if you expect anyone to take you seriously?
AlGore’s multiple weather-specific (i.e. scientific) errors in the first glossy book were at least a source of much eye-watering mirth to all who understand the science, although concerned readers have a more serious reason to cry over his book’s wide, uncritical acceptance by scientifically-ignorant school boards. Luckily, in the UK (where some level of reason and honesty still exists), his book was strongly denounced by a court, due to it’s serious errors, mis-statements and fraudulent scare-tactics.
But those who believe the AGW nonsense are unfazed by this criticism, because, like AlGore himself, they are unhindered by the strict principles of the scientific method; and the concept of conscience and ethics is as foreign as scientific the understanding which they not only lack – but about which they (and you, seemingly) are totally incurious…
Rather than denounce (as you predictably do) people like Anthony Watts and Tony Heller (and Will Happer) as ‘disinformation brokers’, you should first try to understand what they are saying.
I know this is difficult for you, but if you start from scratch and learn some physics, biology, chemistry and maths (and statistics), you’ll become entranced at the amount of wondrous information and knowledge there is in even a rudimentary understanding of how the universe works.
And, armed with this new knowledge and understanding, you might well be a bit embarrassed at your (past) naïvety and acceptance of nonsense, dished up as fact.
The past is nothing to be ashamed-of, if the sense of shame comes from new knowledge, which exposes the naïvety.
It means you’re finally growing up…
“…naïvety and acceptance of nonsense”….”One doesn’t need “qualifications” in climate science to recognise fraud when it’s there… and it’s there “in spades”.
>> Yet you haven’t provided any evidence, just links to a few silly and well-known disinformation sites. The scientific evidence for human-caused climate change is unequivocal. It’s a position shard by virtually every American and international scientific institution and academy. Who have you got? heartland institute?
There is scientific data that disputes your claim. Getting the whole picture is better than half. Water vapor contributes to the green house effect. CO2 is not the only cause. Facts are stubborn, I agree.
I saw no one anywhere claiming that CO2 is the only greenhouse gas, nor that water vapour is not a factor in the equation.
I also haven’t seen this contraindicating data that you claim exists. I’m doubting you’ve seen it either – and if you have, I’m betting you’ve let someone marginally smarter misunderstand it for you.
There you go, attack the person but never offer support for your position. Tsk tsk
I shredded each and every one of your unsubstantiated straw-man claims, and all you’ve got is “Tsk tsk”?
Inasmuch as you don’t have any real knowledge in the science of climatology I suggest you simply don’t try to say that you haven’t seen any contraindications of anything other than your own intelligence.
CO2 is a trace gas that has virtually no effect. There is 100 times the H2O in the atmosphere ON THE AVERAGE. Around cities where most of the CO2 is generated we discover that it is ten times that because cities HAVE to have water and hence are built on major waterways, large lakes or oceans.
Sorry Ian that’s garbage. Nasa has been caught fudging the numbers so their credibility is zero. You didn’t know that because you only get your info from “approved” religious sources.
Plants thrive in 1000 PPM conditions and they could not have got there if the world did not have those conditions in the past.
Nay sayers to this concept are not scientists but shills. The evidence of greening the world is overwhelming while the evidence of a rise of 2 degrees C is sketchy at best.
I’ll go with the plants, not the political scientists who shill this garbage for grants and gov. salaries.
You think the oil companies are bad for funding scientists? How about the “pure as the driven snow” gov. scientists, greens, globalists, wind power executives, Musk etc. No conflict of interest with those sods is there?
“Sorry Ian that’s garbage.”
>> Nope, Humans have indeed increased atmospheric CO2 concentration by more than a third since the Industrial Revolution. Inform yourself:
https://scripps.ucsd.edu/programs/keelingcurve/wp-content/plugins/sio-bluemoon/graphs/co2_800k_zoom.png
“Nasa has been caught fudging the numbers so their credibility is zero.”
>> According to who? This is a silly talking point promoted by disinformation professionals. You can’t provide a single scrap of evidence that NASA is ‘fudging the numbers’.
” Plants thrive in 1000 PPM conditions and they could not have got there if the world did not have those conditions in the past.”
>> The climate, ecology and biology of the planet was much different then. The current level of atmospheric CO2 (over 400 ppm) hasn’t been a feature of our planet for at least 800,000 years long before human civilization began to develop.
Yes, 400 PPM so what? And how do you know what it was in the past? When did accurate measurements of atmospheric CO2 begin, indeed, they are not that accurate now. We’re talking sterile lab quality work. Remember this is Parts per million, and it is measure on in a couple of places on earth.
Further, you have no idea what the “normal” atmospheric CO2 is supposed to be any more than you know what the average world temperature is supposed to be. The earth is not and never has been in stasis.
Nasa and other groups have consistently juggled previous temperature down and current temperatures up. Again, 1/10 of one degree C is not even measurable outside a lab. This is average and rounding numbers from various sources. The land based temp. do not coincide with the satellite temps.
You last points are garbage. You have no idea what a million years of climate has been. Dendrology and Ice Cores, and other proxies are not that accurate, which is what the Mann argument is all about.
Your entire premise is contradicted by history. There is the medieval warm period, the Roman warm period, the Egyptian warm period etc. There were also mini ice ages.
We have mega proof of that with painting of the Thames river frozen over etc.
Mann’s science is garbage and global warming, which isn’t happening, is a construct of the left in an attempt to tax the first world nations for wealth redistribution to third world nations. Actually, tax wealthy nations so the cronies, cadres and elites can sponge off everyone else
This scam is a religion and you sir, are an acolyte, a disciple.
Me, I believe in plants, not lab coats on a mission to find more grants or promote an ideology.
BS. NASA is a fraud. You need to educate yourself. That article so misleading it’s sickening. I’ve got some land in Florida for you did you want to buy it to? Ignorance is bliss.
Yet my statement and the position of NASA that “Humans have increased atmospheric CO2 concentration by more than a third since the Industrial Revolution” is based on actual evidence:
https://scripps.ucsd.edu/programs/keelingcurve/wp-content/plugins/sio-bluemoon/graphs/co2_800k_zoom.png
By contrast you have provided nothing to substantiate your outrageous and emotional revelations.
So what! CO2 is not and will not be the only cause or effect of your so called climate change, carbon emissions and global warming. If this planet, earth, does not have enough CO2 plant, plankton and alge along with animals, mammals and humanity will die.
“If this planet, earth, does not have enough CO2 plant, plankton and alge along with animals, mammals and humanity will die.”
>> Irrelevant comment. The planet’s plankton, plant and alge [sic] are in not at risk of not having “enough CO2”. CO2 is rising at unprecedented rates and current levels have not been a feature of the planet for at least 800,000 years. Please educate yourself:
https://scripps.ucsd.edu/programs/keelingcurve/wp-content/plugins/sio-bluemoon/graphs/co2_800k.png
CO2 does not and is not the single most effects on your so called climate change. Also if the earth doesn’t have enough CO2 plants on land and plankton and alge in the ocean along with animals, mammals and humans will die.
The increase in CO2 is a measured fact. The supposed results of that increase are pure unadulterated BS. Nothing but good has come from the increases in CO2. And NO negatives are attached to it. The one line of absorption not totally covered by atmospheric water was saturated at about 300 ppm. No additional CO2 would find any energy to absorb.
Let’s say that you have knowledge, understanding and wisdom in spades. How do you quantify that, as science requires?
In other words, Al Gore’s to be precise, sometimes the facts are not enough?
And sometimes they are. Not one of the alarmist predictions has come to pass. That’s fact enough, even for a layman.
Try a little harder; this quote might help:
“Data is not information, information is not knowledge, knowledge is not understanding, understanding is not wisdom.” Clifford Stoll
I’m assuming Clifford Stoll has twenty-two Phds in everything from philosophy to climate science? No? Then why quote him?
According to you credentialed scientists are as infallible as god.
“According to you credentialed scientists are as infallible as god.”
Definitely not; you just made that uo. The point that was being made up-thread is that the extreme positions of commentators like Tony Heller and Mark Steyn should be given little to no weight in discussions about climate science. Neither has any climate science credentials whatsoever.
So, you’re reaffirming my suggestion that you accept the tenets of the priests in the lab coats that spew your dogma and discredit anyone else.
Thanks for restating the point that you live in a world of group speak where differing ideas and opinions are not welcome.
The construct where your lab coated priests are the only ones that are allowed to interpret your bible and your revelations come from people like Michael Mann who was caught outright lying and cheating on facts. Perhaps the climategate emails are no never mind.
No. Scientists are people and not infallible. It would be foolish to blindly accept the stat3ments or advice of a single scientist. What I am asking is why would one accept the position or advice on a scientific matter of a non-scientist on a matter in which they have no background or credentials whatsoever? Faced with a serious medical condition, would you rely on the advice of a public relations professional over a surgeon or oncologist?
“Faced with a serious medical condition, would you rely on the advice of a
public relations professional over a surgeon or oncologist?”
Depends if they were offering leeches, big pharma or real careful medicines and procedures.
I would listen to someone who has gone through the problem before or had a relative with the problem and did research and weight their advice only slightly less than the professional.
I know of many procedures that are pure quackery including prescribing “Ritalin” to young boys.
As for Mark Steyn, he has done a lot of compilation of research and has been advised by many legitimate scientists, so yes, I would listen to what he says and then check it out for myself.
By the way, my field is biology, particularly dendrology and until I retired, I practiced that art for about 30 years. As a result I have a great interest in Mann’s reconstruction of Briffa’s work. It is garbage. Mann switch from tree rings to thermometers for the entire 20th century and that is a no no in science. He will eventually pay.
One would think that the emails flailing back and forth among the three involved in Mann’s research project would have been enough to condemn every word he ever published.
Not infallible? There is a huge gulf between infallibility and intentionally deleting or altering the data to fit your “gut” world view! Comparing conclusions reached with grossly false data to conclusions reached by an oncologist is so ridiculous that I wish I had the wit of Mark Steyn to lambaste you with. Mann’s hockey stick left out the medieval warm period and the “Little Ice Age” between ~1600 and 1850, not to mention the total falsification of the 20th century data.
Mark Steyn, unlike the other defendants being sued for defamation of character, is not a scientist and is being sued because of his comments calling Mann’s work fraudulent after his exposure as a liar and data manipulator through leaked emails. I’m guessing that Mr. Steyn was incensed that a good portion of the world’s governments had been duped into spending billions by this falsified and alarmist drivel that was produced at US taxpayer expense.
If Michael Mann is so sure of his hockey stick, why hasn’t he released the data upon which it was built? President Trump called global warming a hoax, took anything related to it off the White House website and muzzled the EPA; why hasn’t Mann sued him for defamation? Could it be the RICO lawsuit the feds could file against him and his co-conspirators?
Mann was cleared of any malfeasance by a Penn St. administrative panel earlier this year, but those lily-livered snakes cleared Jerry Sandusky too. Mann should be stripped of his PhD, charged with his fellow climate change liars with RICO and jailed. Then the Kyoto agreements and the Paris Accord can be revisited by the rest of the world, this time viewed as the huge boondoggles they are. Of course, the United States of America will let the world do what it wants as we rejected both “Treaties”.
Such fluff…and no evidence whatsoever to substantiate your silly claims. Why not start by educating yourself about the science , evidence and implications of climate change instead of intentionally trying to mislead readers.
https://climate.nasa.gov/evidence/
Misleading information because NASA is bought and paid for by taxpayers money to write a false narrative.
“NASA is bought and paid for by taxpayers money to write a false narrative.”
>> Intentionally misleading talking point. You have absolutely nothing to substantiate this ridiculous statement.
You’re irrelevant and so is every statement that you make regarding climate change, carbon emissions and global warming. You are an absolute joke this whole thing is ridiculous.
Making silly, ignorant and unsubstantiated statements doesn’t make them true. Please educate yourself and then come back and tell us what you’ve learned:
https://climate.nasa.gov/evidence/
You’re ignorant, uneducated and uninformed in NASA is a lying piece of crap.
More conspiracy rubbish. NASA’s position has been consistent over decades through multiple republican and democratic administrations. Its position is also consistent with the positions of the National Academy of Sciences, American Meteorological Society, NOAA, British Atmospheric Data Centre, Environment Canada, IPCC, American Geophysical Union and virtually every US and international scientific academy. Who have you got substantiating your ridiculous position?
…because Soros now controls NASA? There is no American government?
Please do tell us more about this vast worldwide conspiracy of yours. This thread was getting far too serious, and I could use a little light entertainment.
George Soros leader and puppet master of the New World Order is not a conspiracy. I’ll make it easy for you go to Amazon and put in the search engine, of Amazon, the words New World Order and see how many books pop up about it. Ignorance is bliss.
Yours certainly seems to be.
Allow me to help you here: https://www.google.ca/search?q=soros+conspiracy+theories&ie=utf-8&oe=utf-8&client=firefox-b&gfe_rd=cr&dcr=0&ei=MjIzWq3mG5KB_AGGspCYCw
Instead of watching TV or listening to your favorite liberal socialist show open up a book and read. Ignorance is bliss
Why did you delete your previous reply? It was far more entertaining, and no more stupid than what you’ve replaced it with:
Beirish65
12 hours ago
George Soros leader and puppet master of the New World Order is not a conspiracy. I’ll make it easy for you go to Amazon and put in the
search engine, of Amazon, the words New World Order and see how many books pop up about it. Ignorance is bliss.
Snowflake ❄️ You could not have made my point any clear because your ignorance is bliss.
Ridiculous and it’s not worth talking to you because you’re so blinded by what you think is the truth. The New World Order It’s not a conspiracy it is a fact. George Soros is not a conspiracy he is a fact of evil. Follow the money if you can handle it because I don’t think you can handle the truth because it would disturb your entire educational background. If we want roc it’s not a conspiracy it is a fact. George Soros is not a conspiracy he’s a fact of evil. Follow the money if you can handle it because I don’t think you can handle the truth because it would disturb your entire educational background. It Rock your entire being to find out the truth about this country and the And how our political system is rigged to steal wealth from uneducated people like you through global warming, carbon emissions and climate change. How come our Gore has a multimillion dollar house and a multi million dollar bank account and has a plane and gas guzzling automobiles and he talks about global warming him like it’s a major problem? If it was such a major problem then why does he have all the things that he has? Follow the money. Follow the money.
Yes, YES!!! More, please.
Ignorance is bliss
…nor much of a track record for honest and unbiased journalism.
There is NO SUCH THING as “climate science”. This is a self identified science. Tell us what university offers higher education in climate science and who has obtained such a degree.
Again let me repeat – there IS no such thing as a “climate scientist”. This is entirely self identified and hence ANYONE can claim those non-existent credentials.
You go right ahead and repeat whatever you like. It doesn’t make your ridiculous statements true.
Cliff Stoll wrote one very good book which I enjoyed immensely.
But it was not about climate.
We have Nostradamus here guys
“…We have Nostradamus here guys…”
No – it’s Michael Mann himself. Just wasting our time…
Data is the information from which knowledge, understanding, and wisdom arise. If you have contempt for data, then you have contempt for science. But we already knew that.
You misunderstand the point. I have no contempt for data. Only that without knowledge, understanding and wisdom, data is often used and abused.
You can say that again. The adjustments made by NASA GISS are attrocious!
‘Data are not the same as information, knowledge, understanding and wisdom.’
Maybe not.
But they are the underpinning of all true science. And it is that realisation that distnguishes the scientist from the theologian.
Your appeal to ‘look beyond data’ is an appeal to a faith or religious belief, not to science. I hope you recognise it as such.
https://thsresearch.files.wordpress.com/2017/05/ef-gast-data-research-report-062717.pdf
Pay particular attention to the peer reviewers.
…and by ‘peer reviewers’, he means cheerleaders.
Exactly right. In my mind “climate science credentials” are a big negative. It requires (excuse me) political whoring to make a living at it
And what if I’m I’m a magical rainbow-colored unicorn who’s calling you on your claim?
Please, Mr. Unicorn, do point us to a single experiment that proves the correlation between CO2 and warming of the biosphere. Hint: you cannot … because it does not exist. What you have is circumstantial evidence that could be caused by AGW or natural causes. You do not have definitive proof of how much is AGW and how much is natural. All you have is a political agenda that looks at science through magical, rainbow-colored glasses and cries, “Wolf!!”
Best to leave the deep end of the intellectual pool. You’re in WAY over your head.
The high school science that you failed is merely “circumstantial evidence”?
Many, many studies have been undertaken; the issue here is finding an explanation simple enough for even you to follow.
Will this do? http://hyperphysics.phy-astr.gsu.edu/hbase/thermo/grnhse.html
BTW, kudos on the subtly admitting that your claim of being a scientist was a brilliantly ridiculous ruse.
Not even close. Attempting to trot out a theoretical explanation for an as yet unproven theory and assuming it’s undeniable is just what we would expect from those pushing a political agenda. There has been NO experiment conducted on the effect of CO2 on the Earth’s biosphere. All of the variables cannot even be said to be known, the signs of certain variables are still being debated, and the atmosphere’s sensitivity to CO2 has a ridiculous error margin. The models do not agree with observation. And there is no credible explanation for the noticeable rise in temp 191x-194x (when CO2 was flat), the pause in temp 194x-197x (when CO2 began to rise), and the current pause in temp (200x-present, with noticeable rise in CO2, and acknowledged by many recognized alarmists). No, you’re the type that has Feynman rolling in his grave. We’re done here.
You’re done because you know you’ve answered with more unsubstantiated drivel. There is no lack of theoretical explanations for the few real issues you’ve mentioned – many of which have acheived concensus.
But not all your issues are real: your “current pause” claim is a blatant and dangerous lie. Each of the last three years surpassed the previous annual high temperature records – the last two, year-over-year by a wide margin.
You’ve been schooled, fool. Too dumb to realize it, too !!
Thanks for that insightful contribution. Clearly, I must ponder your well-structured argument for a millisecond or two.
Sorry if the truth hurts. LOL
Mann’s paper has been discounted and battered by many within the profession. Suggest you get Steyn’s book which deals with this; also talk to Steve McIntyre over at Climate Audit, who, whilst not a climate scientist is a tip top statistician – he’s pulled his paper to pieces on numerous grounds.
Why would you suggest Steyn’s book? Mr. Steyn has no scientific credentials whatsoever. Likewise former mining executive Steve McIntyre – no climate science background whatsoever.
Neither does Algore, and you probably have multiple copies of both of his books.
Silly deflection. The article is about Mann’s suit against Mark Steyn; it’s not about Al Gore.
I don’t blindly trust anyone, scientist or otherwise. But Mann is a proven liar (see his now-retracted claim to have been a “Nobel Laureate,” among other things) and a well-known prevaricator (see “Mike’s Nature trick”). It’s difficult to understand how or why anyone in the climate science community places any confidence in Mann at this point.
Mann has been debunked by top scientists. That’s enough for this layman.
Untrue statement. His conclusions are consistent with the current scientific literature. Why not inform yourself of the science, evidence and implications of climate change: https://climate.nasa.gov/evidence/
If you’re saying his work is sound, why did he refuse to release his data?
Yet another silly myth manufactured by disinformation professionals.
I’m sorry, are you claiming he DID release his information?
SWEET! Please point me at it.
Hi Steven, here you go: http://www.meteo.psu.edu/holocene/public_html/Mann/tools/tools.php
Scroll down to bottom…the page also includea links to data that inform his research on “Proxy-Based Reconstructions of Hemispheric and Global Surface Temperature Variations over the Past Two Millennia”
I asked for NEW information, not regurgitated old information using the same discredited temperature “adjustments”.
If that’s what he’s relying on,he should probably just admit guilt now.
Discredited? By who? And why is it that his findings are consistent with the positions of virtually every US and international scientific academy?
Discredited by any real scientist showing how his data has been manipulated. I know true believers won’t be swayed of course, which is more the pity.
Argument from authority is just argument from ignorance. That’s taking the side of the Catholic Church against Galileo.
“Argument from authority is just argument from ignorance.”
Incorrect comparison. Argumentum ad Verecundiam is an argument from an inappropriate authority — an appeal to an “authority” outside the authority’s special field of expertise. Appeals to legitimate bodies and experts is a perfectly admissible form of inductive argument.
Dr. Ball`s positions on climate change and those of the silly “Friends of Science” are diametrically opposed with the positions of NASA, NOAA, British Atmospheric Data Centre, Environment Canada, IPCC, National Academy of Sciences, American Meteorological Society, American Geophysical Union and virtually every US and international scientific academy. On what basis do you reject this position?
No,that’s exactly spot on. You just don’t like the facts that the “supposed 97%” (it’s really more like 5%) are falling back to that as a defense.
What do you think about this little gem? Just this week as it happens:
https://phys.org/news/2017-08-pair-global-natural.html
I assume you’re in the process of slamming those those researchers as evil oil-funded stooges?
(Wait…didn’t Algore make most of his money of late from the oil barons over in the Middle East?
“it’s really more like 5%”
>> A made up number based on no evidence whatsoever. Unsubstantiated rubbish. You are good at that.
“What do you think about this little gem? ”
>> A single article in an obscure and shortly-to-be-discontinued journal doesn’t undermine decades and decades of climate science and mountains of evidence generated by multiple, independent lines of science. And Marohasy is a well-known contrarian. Doesn’t change a thing.
Wow…phys.org is a “shortly to be discontinued” journal?
Fascinating. I guess your bible is HuffPo and NPR then, if phys.org isn’t to your liking.
Okay. Go in peace, namaste, etc.
“…His [Mann’s] conclusions are consistent with the current scientific literature…”
That’s because the “current scientific literature” is riddled with Mann’s fraudulent papers; and with those of his equally-dishonest peers.
“Both Mann and Nature are deserving of the strongest condemnation for this”
According to what authority and on what basis? You and Tony Heller? Please stop intentionally misleading readers with your silly, misinformed conspiracy theories that have no factual basis whatsoever.
“…According to what authority and on what basis?…”
Hi Michael…
The fact that you ask such an obviously ignorant question shows your true trollish intentions – to force a dialogue with those who see through you; and who’ve witnessed your effective bullying of peers like Briffa into complying not with the scientific method – but with what YOU want the data to show.
Well, I won’t waste any more time with you. We know who you are; and I won’t take your disgusting bait…
You made an outrageous statement that you are unwilling to substantiate. I am calling you on it.
Exactly right. He should Mann up and confess that his hockey stick is more political schtick than science. We’ll forgive him if he does. Otherwise he’ll probably be denounced as a witch and burnt at the stake if he doesn’t.
How about adding a little science to the discussion.
https://www.youtube.com/watch?v=mtHreJbr2WM
1) Every year the temperature swings about 60 degrees F. We are supposedly in a crisis because the temp rose 1.4F (.8C) over 100 years.
2) Greenland ice core data shows stable temperature for 10,000 years varying between 14-16C. The alarmist scare is based upon the thermometer temperature record that covers only 150 years or part of the current warm period that is unremarkable relative to the last 10,000 years.
3) Water vapor accounts for 75% of the greenhouse effect, CO2 for 19%. Man made CO2 emissions account for 1-2% of CO2 emissions.
4) The greenhouse effect of CO2 is exponentially reducing. From 0 to 20 ppm it is 1.5C. From 380 to 400 ppm, it is less than .05C.
5) From 1960 to today, CO2 ppm has increased steadily. From 1960 to 1980 temp decreased, from 1980 – 2000 temp increased, from 2000 – today temp has been stable.
6) Temperature predictions made by the global climate models are wrong and getting worse with every passing year.
7) Sea level increased 8 inches in the 19th and 20th century. It is likely to do the same in the 21st. Even if the Arctic melts, it is only 2% of the ice and it wont increase sea level because it is floating. Antarctica with 90% of the global ice is adding 8 inches of ice per year. During WW2 some airplanes crash landed in Greenland, recently they were found under 268 feet of ice.
8) 150 years ago at 280 ppm CO2, we were dangerously close to a mass extinction (plants start to die at 180 ppm). The increase in CO2 to 400 ppm has led to increased food production and the greening of the planet.
Thank you for the science exercise. But the political forces pushing climate change are not interested in what you have to say. They’re simply using cooked up scientific data to hoodwink governments tino going along. Cutting CO2 emissions will not lower temperatures but that is not the intention. Oh sure, the Union of Concerned Scientist and other climate changers are spewing out the best models EPA money can buy. But, if the scandal at East Anglia U. taught us anything, it taught us that the political forces behind climate change and global warming don’t give a damn about truth or falsehood. They have one obsession. That is to massively reduce global population by 6 billion people. This is the objective of the current household that rules the British Empire. To drive my point home, I refer to the Copenhagen Conference on CO2. After it failed to get other nations to go along with cutting fossil fuel production, British Queen Elizabeth and her representatives began to intensify their efforts to broaden the message on the need to cut carbon emissions. This explains how and why Hans Schellnhuber, Knights Commander of the British Empire, became the advisor to Pope Francis on Climate Change. Schellnhuber wrote the draft on Climate Change that ended up in the Pope’s Encyclical, Laudato Si. Until very recently, Schellnhuber’s website represented his crazy views on the need to drastically reduce global population levels. Among his statements he said ” the carrying capacity of the planet is 1 billion people.” When he was confronted with this statement, he denied he said it. But it was posted on his website until he took it down. This guy has been a mouthpiece for action on cutting population for a long time. Cutting CO2 emissions by shutting down fossil fuels is just another way to reach the intended objective.. Before you tell me there is no such thing any longer as the British Empire, reflect for a moment on Obama’s alternative energy agenda. And then Clinton’s announcement of ending all US coal production if elected. Who influenced their decisions?
Is it coincidence that Obama’s and Clinton’s policies on energy were the same? And they matched the objectives of the British Empire? She and Obama may not know why they were doing it, but they were adopting the energy policies that met the objectives of the British Imperial system.
Confronted with this fraud, you, me, and millions of others, some of whom practice real science, are in full rejection mode. Right? Reams of Scientific data that prove Climate Change is not man made, have been recorded and reported on. But because the British are absolutely determined to achieve their objectives, regardless of the reams of realistic scientific data, it means nothing to them. What they intend to do in the next 20 to 100 years, is to massively reduce population to the often stated 1 billion people That’s what they intend and they will not stop until they are stopped! This is the real issue, not who has the correct data. It is a fight for civilization and it has to be fought and won by destroying the British Empire. And also by increasing the energy flux density of the Biosphere through producing higher forms of energy with 4th generation nuclear fission plants while creating a crash program to build commercial fusion.
There is a lot that you write that I could agree with.
Especially the anti human Green movement’s desire to reduce the population by about 6 billion people.
However, the source of the anti human ideology is the Green/Left rather than the British Empire which may have been a force to be reckoned with before WW2, but not now.
The hat salesman who walked into the oval office after FDR died was in the grips of Wall Street bankers. The likes of which were responsible for funding Hitler’s rise to power. Wall is and has always been an outpost of the British Empire. After WWII the Empire identified itself as the Commonwealth of nations. While no longer a landed aristocracy, the British Imperial financial system functions much like the Roman Empire that came before it. The Anglo-Dutch imperial system was folded into what became the British Empire after the defeat of France in the seven years war. It is the same financial system of usury that rules international financial markets and cartels today. It has an American side to it that functions from Wall Street bankng. Individuals such as George Soros function as operatives for the British Foreign Office. Soros’s Open Society for instance is used to destabilize governments that have been targeted by the British for regime change. Soros pumped billions in the coup in Ukraine to destabilize Russia. The British have prized Russia as the crown jewel from which to dominate the world. Yes there is a long history to it and mastering it helps one to understand the nature of our chief enemy, the British Empire.
“Soros pumped billions in the coup in Ukraine to destabilize Russia.”
How’s that working for him?
Legit source please?
Socialists like you certainly are funny. No matter what happens in the world you can find a “corporation” to blame it on. YOU drive a car. You buy gasoline. The government makes 10 times as much per gallon of gasoline than the oil companies do but you somehow believe that the oil companies are working against “a green earth”. When it is drawn out in front of you that electric cars actually generate MORE CO2 than gasoline cars do you STILL don’t believe it and tell us that Tesla is the wave of the future. But the fact that Tesla is a corporation doesn’t register on your extremely slow thinking process. You are so incredibly stupid you don’t even know what Wall St. is or how it works but since people are making money off of it it MUST be evil right? All you need is the floppy shoes and the red nose to complete your costume.
ODD, REALLY ODD…how you jump from science to NAME CALLING ….”SOCIALISTS”
WEREN’T you the one claiming to be a scientist????
HMMMMMM!
Something is rotten in Denmark !
Watermellons: Green on the outside, red on the inside.
cont’d….the green movement began with the export of Prince Philip’s WWF to America in 1962. The boomer generation was deliberately drugged up by CIA MK-ULTRA. LSD proliferation on the college campuses was accomplished in part by Ken Kesey and his Merry Pranksters bus tour from college campus to college campus handing out free LSD laced cool-aid. Timothy Leary and other counter-culture Gurus were also instrumental in brain-washing an entire generation to tune in, drop acid and drop out of society. The British and their collaborators in the US who were associated with CIA funded Congress for Cultural Freedom, lit a match that set a generation on fire.
On the music side, Frankfurt School mind-bender and Tavistock collaborator, Theodore Adorno, was chiefly responsible for the Radio Music Project that originated “Rock Music.” To produce the sound he was looking for, Adorno studied African tribal music. He came up with a drum beat sound that would produce in the listener, the infantile emotion of a child “bed rocker.” Hence the name, “Rock Music.” This is all documented. In fact Adorno brags about it.
Look, the reason the post WWII boomer generation was targeted for paradigm culture change, was to break the bond between the boomers and the generations that preceded them. Because the generations that lived during WWII were committed to and identified with scientific and technological progress. They were production oriented. They had just won a world war by outproducing Germany 4 to 1 in logistics. Under Truman the British were able to chip away at the WWII production based system. For that, British monetarist Maynard Keynes was brought in to advise Truman. Monetary emission substituted capital intensive production. Within 10 years after WWII it blew up in their faces! The British knew they had to rip the boomers from their parents. They realized that if they were going to transform the US they would have to capture a generation to do it.
A new belief was manufacture. One that was anti-science and oriented around protecting the environment. You could say that the brain washing of the boomers into adopting the Rock-Drugs-Sex anti-science counter culture as their own was introduced on the Ed Sullivan Show by the British bank known as The Beatles. Do you find this preposterous? Then you don’t know about the history of the British Tavistock Institute. Look there and also at the beginnings of the WWF. Look into Adorno and the Frankfurt School. MK-ULTRA and Margaret Mead’s husband, Gregory Bateson who was part of that operation. Look into the Congress for Cultural Freedom. I’ll stop here. You have work to do
You lost me there.
What utter nonsense.
…
1948 Donora smog – Wikipedia
https://en.wikipedia.org/wiki/1948_Donora_smog
1948 Donora smog. The 1948 Donora smog was a historic air inversion that resulted in a wall of smog that killed 20 people and sickened 7,000 in Donora, Pennsylvania, a mill town on the Monongahela River, 24 miles (39 km) southeast of Pittsburgh. The event is commemorated by the Donora Smog Museum.
****
For most of the century from 1850 to 1950, however, the primary environmental cause was the mitigation of air pollution.
The Coal Smoke Abatement Society was formed in 1898 making it one of the oldest environmental NGOs. It was founded by artist Sir William Blake Richmond, frustrated with the pall cast by coal smoke. Although there were earlier pieces of legislation, the Public Health Act 1875 required all furnaces and fireplaces to consume their own smoke.
John Ruskin an influential thinker who articulated the Romantic ideal of environmental protection and conservation
Systematic and general efforts on behalf of the environment only began in the late 19th century; it grew out of the amenity movement in Britain in the 1870s, which was a reaction to industrialization, the growth of cities, and worsening air and water pollution. Starting with the formation of the Commons Preservation Society in 1865, the movement championed rural preservation against the encroachments of industrialisation. Robert Hunter, solicitor for the society, worked with Hardwicke Rawnsley, Octavia Hill, and John Ruskin to lead a successful campaign to prevent the construction of railways to carry slate from the quarries, which would have ruined the unspoilt valleys of Newlands and Ennerdale. This success led to the formation of the Lake District Defence Society (later to become The Friends of the Lake District).[15]
In 1893 Hill, Hunter and Rawnsley agreed to set up a national body to coordinate environmental conservation efforts across the country; the “National Trust for Places of Historic Interest or Natural Beauty” was formally inaugurated in 1894.[16] The organisation obtained secure footing through the 1907 National Trust Bill, which gave the trust the status of a statutory corporation.[17] and the bill was passed in August 1907.[18]
An early “Back-to-Nature” movement, which anticipated the romantic ideal of modern environmentalism, was advocated by intellectuals such as John Ruskin, William Morris, and Edward Carpenter, who were all against consumerism, pollution and other activities that were harmful to the natural world.[19] The movement was a reaction to the urban conditions of the industrial towns, where sanitation was awful, pollution levels intolerable and housing terribly cramped. Idealists championed the rural life as a mythical Utopia and advocated a return to it. John Ruskin argued that people should return to a small piece of English ground, beautiful, peaceful, and fruitful. We will have no steam engines upon it . . . we will have plenty of flowers and vegetables . . . we will have some music and poetry; the children will learn to dance to it and sing it.[20]
Practical ventures in the establishment of small cooperative farms were even attempted and old rural traditions, without the “taint of manufacture or the canker of artificiality”, were enthusiastically revived, including the Morris dance and the maypole.[21]
Original title page of Walden by Henry David Thoreau
The movement in the United States began in the late 19th century, out of concerns for protecting the natural resources of the West, with individuals such as John Muir and Henry David Thoreau making key philosophical contributions. Thoreau was interested in peoples’ relationship with nature and studied this by living close to nature in a simple life. He published his experiences in the book Walden, which argues that people should become intimately close with nature. Muir came to believe in nature’s inherent right, especially after spending time hiking in Yosemite Valley and studying both the ecology and geology. He successfully lobbied congress to form Yosemite National Park and went on to set up the Sierra Club in 1892.
Look backward to the turn of the century. Progress has been in every field of science. The air is cleaner. The waters are purer. And the national parks are protected. The problem is, no new cites are being built along rivers and tributaries West of the Mississippi, where new cities would flourish. I have been to Central and North Africa and I can tell you, the first thing that comes to mind is, Africa isn’t over populated, it’s underdeveloped. But with modern technology and great projects, such as the Transaqua Lake Chad project and the Nigerian Oasis Plan, Africa can leap frog to the 21st century.
You say:
“The air is cleaner.”
but that is
THANKS to legislation at the federal level, regulating emissions that cross state lines, which 1 state cannot enforce.
***
You say:
“The waters are purer.”
but that is
THANKS to legislation at the federal level, regulating dumping like emissions that cross state lines, which 1 state cannot enforce.
1 state cannot afford the Hundreds of millions required to sue to correct
dumping and pollution from international conglomerates.
Most sane people want all three. Therefore the majority of Americans support Government regulations that put a check on the excesses of corporations that may try to circumvent the law to save money. One such company was Dow chemical. Dow became so powerful during the 60’s that they got away with murder, literally! Agent Orange and napalm were two of Dow’s killer creations. And the US government was complicit in it.
Flint, Michigan’s is another example. The polluting of it’s water supply is another example of saving money at the expense of human life. But in this case it was city, state and federal governments that were responsible. And it happened on the greenest of green president’s watch. Because it was Obama’s EPA that signed off on allowing lead contaminated Detroit river water to flow into Flint’s main water supply system. But unfortunately, only lower level managers were punished. The Michigan governor and Obama’s EPA secretary should have been held accountable for the human suffering it caused.
My point is this. There is a role for government to play in the affairs of our nation. And in order for progress to continue In the interests of our people, we need Good government. One that protects and obeys the principal of promoting the General Welfare of our citizens, and all that that implies. I believe this president, President Trump, is dedicated to that principle.
The EPA didn’t sign off on the FLINT ISSUE at all.
OBAMA didn’t sign off on the FLINT ISSUE at all.
THAT decision was made in 2014.
The EPA was not consulted until 2015 when IT’S Laboratory
proved the STATE Republican Administration was lying.
****
“….
FLINT, MI — A U.S. Environmental Protection Agency official who sounded a dire warning about toxic lead in Flint’s drinking water seven months ago says he couldn’t believe the water wasn’t being treated to make it less corrosive to lead service lines and indoor plumbing.
“I was stunned when I found out they did not have corrosion control in place,” Miguel A. Del Toral, regulations manager in the EPA’s ground water and drinking water branch, said in an interview with The Flint Journal-MLive today, Jan. 21, 2016.
“In my head, I didn’t believe that. I thought: That can’t be true…that’s so basic. That’s not possible.”
Del Toral wrote an interim report on high levels of lead in Flint water on June 24, 2015, months after other EPA officials had warned the state Department of Environmental Quality that the chemistry of Flint River water was appeared to be causing transmission pipes to leach contaminants such as lead into the water supply….”
THE EPA cannot force a state, except in certain SPECIFIC circumstances.
“FLINT MICHIGAN’S WATER/LEAD catastrophe had next to nothing to do with the FEDERAL GOVERNMENT…..”
Excuse me??? The EPA rather than treating poisonous and corrosive water in mines put off this treatment so long that the dams holding this water in finally broke and dumped all of this junk into the Flint river. For awhile the corruption in this river was so strong that the river ran yellow.
In the meantime as had been expected Flint had to shut off their water supply from Lake Huron in order to complete a new and more reliable water supply pipeline.
Flint was FORCED to use Flint River water which was still brimming full with corrosive acids from the untreated mine water that was not still pouring into the river upstream from Flint.
These corrosives burned the insides of the very old city water system. Old water pipes were typically lead and the lead oxide would seal the inside surfaces so that lead wasn’t released into the water running through the system. Most of the old cities on the east coast are exactly the same.
The corrosives that the EPA (in case you are unaware of it that is a Federal Government Agency) allowed to drain into the river burned the inside of the city water system and released heavy lead contamination into the city water supply.
People who are unaware of what conditions in this country were before WW II think that everything is new and beautiful and that local governments should somehow tear billions of dollars in piping out and replace it with plastic whose long term effects are unknown.
My belief is that these people saying this should be taxed for every city service replacement charges. Or as Ceasar said, “Give the masses what they want” and charge them for every single thing.
THAT does not even remotely resemble the truth…..UNLESS INVITED into a mine issue…the EPA cannot take action.
SUPPLY a source for that TALL TALE about the mines the EPA was supposedly involved with????
SINCE the EPA has been under attack for petty REPUBLICAN PARTY REASONS….has had its budgets routinely restricted… I am not surprised if they couldn’t do every thing at the same time to stop
industrial & mining abuses…….
BUT I WANT TO SEE YOUR SOURCE !
YOUR chronology of events is PURE FICTION….pulled right out of your ars.
Most old cities…like flint used to do…add chemical to prevent leaching of lead into the water.
THAT TOO is not an EPA issue until invited into it……that invite came in 2015…thought the kids were being poisoned since 2014.
You are a clown. I don’t supply a “source” to morons unable to do a simple google search. What you have shown is that you do not know what happened and why. But you are spending an extraordinary amount of time talking about it from a position of absolute ignorance.
You skipped over Hitler. He was a big environmentalist.
NOT RELEVANT….meant simply to incite. F. YOU !
The CIA or any other government agency had nothing to do with LSD. It wasn’t even illegal at the time. There were LSD labs springing up on every campus just like today they are making false opiates that can kill you with a single dose. These college people had a sharp drop in IQ and a complete lapse of direction. I had people telling me that it was completely harmless as they, a year later, committed suicide. A large part of the “green movement” today act exactly like those drugged out people so I suspect that it causes DNA damage that in inheritable. Look at the reactions of R. Kooi and LTJ. From a position of complete ignorance they are trying to convince people of something that doesn’t exist. Even though this article is about Dr. Michael Mann about to be shown as a scammer they still have full faith in his attempt to gain more research grant money.
CIA MK-ULTRA Project. http://www.history.com/topics/history-of-mk-ultra
https://en.wikipedia.org/wiki/Project_MKUltra
The Macy Conferences and the minds behind mind control. http://www.fornits.com/phpbb/index.php?topic=32643.0
Cultural engineering http://espionagecentral.50megs.com/whats_new_3.html
Richard Bandler and John Grinder developed NLP. CIA attended NLP workshops:
/r/Gangstalking/comments/3c41zp/cia_and_military_hired_cofounder_of_nlp_to_teach/
Gregory Bateson was a guest teacher at Esalen Institute. “Bandler and Grinder also drew upon theories of Gregory Bateson, Alfred Korzybski and Noam Chomsky, particularly transformational grammar,[20][23][24] as well as ideas and techniques from Carlos Castaneda.[25]”
https://en.wikipedia.org/wiki/Neuro-linguistic_programming
“Background and origination of NLP The ideas and approach found in NLP draw from two main areas of thought. The first is cybernetics, a cross-disciplinary view of how systems are organised based on feedback that was developed in the 1940’s and 1950’s, and in which another major influence on NLP, Gregory Bateson, was a core figure. The founders of NLP, Bandler and Grinder, echo central principles of cybernetics when they say that `the basic unit of analysis in face-to-face communication is the feedback loop’ (Bandler & Grinder 1979:2).
The second area of thought is the work of the Palo Alto Mental Research Institute in the 1960s, in which Bateson again was involved. Significantly, the Palo Alto researchers emphasised the pragmatics of human communication, which also characterises NLP, and constructivism, which is the idea that people cannot know `reality’ as such, so inevitably they act according to constructions that they create.”
http://www.anlp.org/background-and-origination-of-nlp
“The NLP Logical Levels of Change Model, inspired by Gregory Bateson and developed by the pioneers of Neuro-Linguistic Programming is very helpful in designing an action plan for change. The Stages of Change give us a general road map of the process of change — a process that has a beginning, a middle, and an outcome……..
Gregory Bateson, a well known cultural anthropologist, pointed out that in the processes of learning, change, and communication there were natural hierarchies.”
http://www.internet-of-the-mind.com/nlp_logical_levels.html
/r/Gangstalking/comments/3c4jsv/gregory_bateson_and_the_countercu
http://conspiracyinsider.blogspot.com/2012/06/nlp-conspiracy
http://www.tranceworks.com/roots.htm
Gregory Bateson
“Although initially reluctant to join the intelligence services, Bateson served in OSS during World War II along with dozens of other anthropologists.[19] He spent much of the war designing ‘black propaganda’ radio broadcasts. He was deployed on covert operations in Burma and Thailand, and worked in China, India, and Ceylon as well. Bateson used his theory of schismogenesis to help foster discord among enemy fighters.”
https://en.wikipedia.org/wiki/Gregory_Bateson
stephen – that is the largest danger of the global warming True Believers. They would have power generation cut off for the entire world. They believe man to be a cancer on the Earth and that murdering tens of millions of Chinese and Indians nothing more than a better life for themselves. This was PRECISELY the language that Margaret Sanger used to found Planned Parenthood and this is the same drive behind the “environmentalists” that are trying to press for the USA to remain in the Paris Accord – which said that ONLY the USA had to do anything until after 2020. Of course the rest of the world was for shutting down the US economy so that they could accelerate their own.
Noting that Stephen’s silly, misinformed position on climate change is diametrically opposed to the positions of virtually every US and international scientific academy including NASA, National Academy of Sciences, American Meteorological Society, NOAA, British Atmospheric Data Centre, Environment Canada, IPCC and the American Geophysical Union.
Explain Gina McCarthy Senate hearing in Jan 16 17 2014. After lengthy obfuscation she admitted there has been no temp increase over the past decade. After her embarrassment the SPA, MISS and NASA fabricated the Temperature Anomaly. The Temp Anomaly has not been defined. Those agencies refuse to explain why they went from Global Mean Tempetature to the Temp Anomaly. Cleary there is no science to support the Temp Anomaly.
VERIFY from a reliable source !!!!
Because I just completed reading her testimony
and
YOUR COMMENT APPEARS to be a TOTAL FICTION.
.
If you Read the Daily Caller, you will remember the HEADLINE, a few days ago…
.
THERE HAS BEEN NO ACCELERATION !
in this ONGOING GLOBAL WARMING EVENT !
THERE has been NO “PAUSE”
.
THERE has been NO “HIATUS”
.
THERE sure as hell been NO “COOLING” !
Former Obama administration EPA Secretary Gina McCarthy is not a reliable source during her Senate Testimony?
So just above you say she said there was NO temperature increase
and she was worthy of quoting.
BUT
NOW
YOU KNOW that even DAILY CALLER isn’t covering up the Temperature Increases…..
NOW, McCarthy is no longer reliable and quote worthy..
DESPERATE MUCH?
PROVE YOU DEPICTION of your testimony is TRUE ! ! ! !
Google Gina McCarthy Senate Testimony with Senator Sessions. You’ll see lots of hearings where Gina can’t answer or when she does it contradicts global warming.
YOU LIED !
YOU CLAIMED SHE SAID there was NO change in temperatures world wide….that is a damnable lie !
NOW
YOU
ARE TRYING
TO CHANGE
THE SUBJECT
from
your
lie !!!
I can see you never looked it up. Typical of a Brown SHIRT
WHERE IS YOUR PROOF!
She N EVER “admitted there has been no temp increase”
in fact quite the opposite is true.
I read the damn testimony….YOUR COMMENT IS A LIE !
“after her embarrassment the SPA, MISS and NASA fabricated the Temperature Anomaly”
is similarly a lie !
SEVERAL NATIONS have Satellites, Digital Weather Balloon launches etc…that have constantly challenged and then verified the Temperature Increases.
YOU LIE !
Dr. John Christy … on the story in DAILY CALLER… actually admitted TEMPERATURE INCREASES AROUND THE GLOBE …. saying there has been NO ACCELLERATION…
in the ongoing warming of the earth.
https://www.c-span.org/video/?317244-1/administration-defends-climate-change-plan
There is your proof enjoy.
Sen Jeff Sessions made the claim. As his time ran out.
McCarthy basically did an eye roll.
https://www.c-span.org/video/?317244-1/administration-defends-climate-change-plan&start=8475 about 2:21 in from start of hearing, but this should be the comment.
Clearly you didn’t view my link Gina was threatened with contempt of Congress after that she did in fact state there has been no increase in Global Temperature over the past decade.
Your link seems to have disappeared. The video proceedings are a 5 hr video. There is a closed caption search available on site. Avail youself of it and send the results.
Just as I did to show the lawerly trick pulled by the then Sen. Sessions
Nope it’s still there you’re just too obtuse to see it.
Oh, I see. Instead of just redoing it, or linking to your comment which has the link, you’ve found it better to insult.
However, I did find your link ( ) and as I stated, it is a 5 hr viv. Actually, 5:42.
You didn’t quote McCarthy, you didn’t cite when in the proceedings it was said
Which, if you’d tried that in a 6th grade or higher research report, would have brought an ‘F’.
“0 points
Created citations which were incomplete or inaccurate, and provided no way to check the validity of the information gathered.
Failed to use information ethically.”
https://www2.uwstout.edu/content/profdev/rubrics/middlelschresearchrubric.html
And climate science denialists want to be taken seriously…..
PROVIDE A SPECIFIC SITE for this damnable lie
First, you haven’t adequately supported your assertion of what was said.
Second, your wording implies Issa did the threatening after making this statement you claim.
Here’s a rather fuller account, with quotes, of the that part of the proceedings
https://www.eenews.net/stories/1060001953
And note that McCarthy is not quoted there about saying anything like that.
Third, I haven’t found a source quoting McCarthy saying anything similar to your assertion. It flies in the face of logic that McCarthy would.
So. From here, all I’m seeing is someone who can’t support their claims and jumps to insulting rather than doing so.
“…agencies refuse to explain…”
First question
https://data.giss.nasa.gov/gistemp/faq/
“..not been defined”
First question
https://data.giss.nasa.gov/gistemp/faq/
Need more help?
Penultimate question
https://data.giss.nasa.gov/gistemp/faq/
The NASA temperature records have been kept and the changes in them have been recorded. Now it is always possible for these changes to have been made for newly found reasons to correct the record. But that isn’t what occurred – the records were changed with every reading rising in the same percentage. This occurred at least two times. So on the records of those who kept copies of the temperature records we have the original records and two rises. We have had “the hottest year ever” business and then when you look into it the “rise” in temperature is one tenth the error margin. So THAT is all an F-ing lie as well.
The fact is that this is all big business and the money trail was published by Forbes long ago. https://www.forbes.com/sites/larrybell/2011/08/23/the-alarming-cost-of-climate-change-hysteria/#33a854957ebb
We’ve watched as Ian and LTJ have constantly lied about this stuff because as members of the Church of Global Warming it is their duty to lie about it. Too bad neither of them has the slightest training in science and make up for it with “but Dr. Mann says”.
Posts silly link to a 6- year-old rubbish article written by a well-known climate contrarian and disinformation professional. Larry Bell has no climate science credentials whatsoever. Hasn’t published a single scientific journal article on the topic. Absolutely nothing. Yet you present him as an authority on the subject. Weak and deliberately misleading.
I’ve been waiting for your credentials to have the capacity to judge anyone about anything. Judging from your other postings I wonder how you can feed yourself. It is DR. Larry Bell and you are, as far as I can tell, not even a high school graduate. People who have received a doctorate can generally deal with statistics and data. You certainly cannot.
Dr. Larry Bell? And who might he be? if you are referring to the Larry Bell that authored the silly Forbes article that you cited upthread, that Larry Bell does not have a PhD, a fact easily verified. Moreover, he hasn’t published any peer-reviewed science on climate science or a related field. Nothing. Please stop intentionally trying to mislead readers.
“I am a professor and endowed professor at the University of Houston where I founded and direct the Sasakawa International Center for Space Architecture and head the graduate program in space architecture. My background deals extensively with research, planning and design of habitats, structures and other support systems for applications in space and extreme environments on Earth. I have recently written a new book titled “Climate of Corruption: Politics and Power Behind the Global Warming Hoax”. It can be previewed and ordered at http://www.climateofcorruption.com. Additional information about my book and views can be found on my YouTube address: http://www.youtube.com/climateofcorruption.”
You simply are not capable of thought are you?
Thanks for clarifying that Bell does not hold a PhD nor entitled to use the title “Dr. Bell” as you erroneously suggested above. Shameful dishonesty.
Bill Nye has no climate science credentials but he’s the face in public debates
You don’t like Nye? Then take some initiative and review the science.
I’m just calling you out for your hypocrisy. Why should I believe hypocrites , like you and Nye and other like minded libtards?
No its only hypocrisy in your imagination. Once again, go educate yourself and come back and tell us what you learned: https://climate.nasa.gov/evidence/
You didn’t deny Nye doesn’t have any science credentials. Thanks for the validation.
Answer me this Einstein. Is it global warming or regional warming ?
Be careful how you answer. Lol
Start by educating yourself, then come back and tell us what you learned: https://climate.nasa.gov/evidence/
You can’t answer. LOL.
Wow, you folded faster than I thought you would.
Your post would have some veracity if you actually quoted and cited McCarthy saying that. Ideally, since it was a hearing, there could be a vid.
So. Why not do as even the average 6th grader does routinely, and bring documentation and supporting details to your claim?
Circa 1985 ALL truth about the climate was no longer available. Of COURSE most of the world’s scientific community could “agree” with the NASA assessment because it was an attempt to hobble the US production engine that control most of the world’s production. NO ONE ELSE in the world was required to do ANYTHING. Only the US. This gave each and every government progressively more and more power. And the investment community decided that they could also get rich quick by selling carbon credits.
If you don’t have the brains that God gave a goat then I suggest you stay out of conversations you know nothing about or even worse are nothing more than a paid shill.
What an absurdly asinine comment…even for YOU !
Explain the 1958 Scientific Community Report to President Eisenhower…warning of the MASSIVE pumping of TOXIC WASTE GASES into the atmosphere for over 100 years…and the threat of Global Climate Changes.
Explain the 1965 Scientific Community Report to President Johnson…warning even more sternly of the THREAT of Global Warming and Climate changes.
…
1st a Fun Factoid:
“Glen Reese, Ph.D Physics, KSU
CO2 is So Small a Part of the Atmosphere ? ? ?
A small fraction of 5 x 10^18 kg of atmosphere is still a lot of CO2.
About 10^15 kg of CO2. If it was compressed into dry ice,
it would form a shell around the planet over 2 mm thick.
It’s enough to block a lot of IR radiation from escaping to space
in accordance with the Laws of Thermodynamics.
The Discovery of Global Warming January 2017
https://history.aip.org/climate/timeline.htm
Timeline (Milestones)
1800-1870
Level of carbon dioxide gas (CO2) in the atmosphere,
as later measured in ancient ice, is about 290 ppm (parts per million).
.
Mean global temperature (1850-1890) is roughly 13.7°C.
.
First Industrial Revolution. Coal, railroads, and land clearing speed up greenhouse gas emission, while better agriculture and sanitation speed up population growth.
1799
Alexander von Humboldt, Thomas Jefferson
Climate Change postulated because of Human Activities!
1824
Fourier calculates that the Earth would be FAR colder if it lacked an atmosphere. =>Simple models
1859
Tyndall discovers that some gases block infrared radiation. He suggests that changes in the concentration of the gases could bring climate change. =>Other gases
1896
Arrhenius publishes first calculation of global warming from human emissions of CO2. =>Simple models
1897
Chamberlin produces a model for global carbon exchange including feedbacks. =>Simple models
1870-1910
Second Industrial Revolution. Fertilizers and other chemicals, electricity, and public health further accelerate growth.
1914-1918
World War I; governments learn to mobilize and control industrial societies.
1920-1925
Opening of Texas and Persian Gulf oil fields inaugurates era of cheap energy.
1930s
Global warming trend since late 19th century reported. =>Modern temp’s
Milankovitch proposes orbital changes as the cause of ice ages. =>Climate cycles
1938
Callendar argues that CO2 greenhouse global warming is underway, reviving interest in the question. =>CO2 greenhouse
1939-1945
World War II. Military grand strategy is largely driven by a struggle to control oil fields.
1945
US Office of Naval Research begins generous funding of many fields of science, some of which happen to be useful for understanding climate change. =>Government
1956
Ewing and Donn offer a feedback model for quick ice age onset. =>Simple models
Phillips produces a somewhat realistic computer model of the global atmosphere. =>Models (GCMs)
Plass calculates that adding CO2 to the atmosphere will have a significant effect on the radiation balance. =>Radiation math
1957
Launch of Soviet Sputnik satellite. Cold War concerns support 1957-58 International Geophysical Year, bringing new funding and coordination to climate studies. =>International
Revelle finds that CO2 produced by humans will not be readily absorbed by the oceans. =>CO2 greenhouse
1958
AAAS delivers to President Eisenhower, a research report and Warning about Climate Changes caused by global warming and Industrial Gas/Chemical Emissions.
Telescope studies show a greenhouse effect raises temperature of the atmosphere of Venus far above the boiling point of water. =>Venus & Mars
1960
Mitchell reports downturn of global temperatures since the early 1940s.=>Modern temp’s
Keeling accurately measures CO2 in the Earth’s atmosphere and detects an annual rise. =>CO2 greenhouse The level is 315 ppm. Mean global temperature (five-year average) is 13.9°C.
1962
Cuban Missile Crisis, peak of the Cold War.
1963
Calculations suggest that feedback with water vapor could make the climate acutely sensitive to changes in CO2 level. =>Radiation math
1965
American Association for the Advancement of Science delivers to President Johnson, Research Report & Warning, with Spot On accurate projections about Climate change for 2015.
Boulder, Colo. meeting on causes of climate change: Lorenz and others point out the chaotic nature of climate system and the possibility of sudden shifts. =>Chaos theory
1966
Emiliani’s analysis of deep-sea cores and Broecker’s analysis of ancient corals show that the timing of ice ages was set by small orbital shifts, suggesting that the climate system is sensitive to small changes. =>Climate cycles
1967
International Global Atmospheric Research Program established, mainly to gather data for better short-range weather prediction, but including climate. =>International
Manabe and Wetherald make a convincing calculation that doubling CO2 would raise world temperatures a couple of degrees. =>Radiation math
1968
Studies suggest a possibility of collapse of Antarctic ice sheets, which would raise sea levels catastrophically. =>Sea rise & ice
1969
Astronauts walk on the Moon, and people perceive the Earth as a fragile whole. =>Public opinion
Budyko and Sellers present models of catastrophic ice-albedo feedbacks. =>Simple models
Nimbus III satellite begins to provide comprehensive global atmospheric temperature measurements. =>Government
1970
First Earth Day. Environmental movement attains strong influence, spreads concern about global degradation. =>Public opinion
Creation of US National Oceanic and Atmospheric Administration, the world’s leading funder of climate research. =>Government
Aerosols from human activity are shown to be increasing swiftly. Bryson claims they counteract global warming and may bring serious cooling. =>Aerosols
1971
SMIC conference of leading scientists reports a danger of rapid and serious global change caused by humans, calls for an organized research effort. =>International
Mariner 9 spacecraft finds a great dust storm warming the atmosphere of Mars, plus indications of a radically different climate in the past.=>Venus & Mars
1972
Ice cores and other evidence show big climate shifts in the past between relatively stable modes in the space of a thousand years or so, especially around 11,000 years ago. =>Rapid change
Droughts in Africa, Ukraine, India cause world food crisis, spreading fears about climate change. =>Public opinion
1973
Oil embargo and price rise bring first “energy crisis”. =>Government
1974
Serious droughts since 1972 increase concern about climate, with cooling from aerosols suspected to be as likely as warming; scientists are doubtful as journalists talk of a new ice age.=>Public opinion
1975
Warnings about environmental effects of airplanes leads to investigations of trace gases in the stratosphere and discovery of danger to ozone layer. =>Other gases
Manabe and collaborators produce complex but plausible computer models which show a temperature rise of several degrees for doubled CO2. =>Models (GCMs)
1976
Studies show that CFCs (1975) and also methane and ozone (1976) can make a serious contribution to the greenhouse effect. =>Other gases
Deep-sea cores show a dominating influence from 100,000-year Milankovitch orbital changes, emphasizing the role of feedbacks. =>Climate cycles
Deforestation and other ecosystem changes are recognized as major factors in the future of the climate. =>Biosphere
Eddy shows that there were prolonged periods without sunspots in past centuries, corresponding to cold periods .=>Solar variation
1977
Scientific opinion tends to converge on global warming, not cooling, as the chief climate risk in next century. =>Public opinion
1978
Attempts to coordinate climate research in US end with an inadequate National Climate Program Act, accompanied by rapid but temporary growth in funding. =>Government
1979
Second oil “energy crisis.” Strengthened environmental movement encourages renewable energy sources, inhibits nuclear energy growth. =>Public opinion
US National Academy of Sciences report finds it highly credible that doubling CO2 will bring 1.5-4.5°C global warming. =>Models (GCMs)
World Climate Research Programme launched to coordinate international research. =>International
Revelle, Broecker et al got it right:
https://data.giss.nasa.gov/gistemp/graphs/graph_data/Global_Mean_Estimates_based_on_Land_and_Ocean_Data/graph.html
This global warming hoax has one point – to STOP the development of the third world. To murder Africans and Indians and Chinese because of the White man’s racism.
Yes of course…thousands of scientists the world over, working for decades in multiple disciplines and jurisdictions, in the public, private and not-for-profit sectors…all part of a global conspiracy to murder Chinese, Indians and Africans. You go ahead and cling to that ridiculous, extreme notion.
In the first place since H. W. Bush the US started spending $2 Billion/yr. All you had to say was you wanted to prove global warming and YOU were in the money. So don’t give me your crap about how all these scientists believed in this for one second. The actual money spent is $1.5 Trillion and that would make ANYONE say ANYTHING. With your ignorance of science it isn’t surprising that you will stick to your guns.
What a creative imagination you have. Misinformed but nonetheless imaginative.
Tell me where you live Ian5. I would really like to meet you. I think that publishing a picture of you and what you have done so far with your life would show a great deal to the world.
More distraction. My physical location and appearance has no bearing whatsoever on the science, evidence and implications of climate change. Why not educate yourself: https://climate.nasa.gov/evidence/
We grow tired of people who are so obviously mentally 16 years old and slow at that. When I came back from Vietnam from my Air Force hitch I was walking through the LA terminal with a plane load of Army. Little MFers like you were marching up and down screaming “Baby killers” as the nicest thing. We were all walking down to pick up our duffle bags when one SOB spit on my uniform. That guy’s jaw shattered on contact. The cops came running down there to grab me and stopped at the last second and looked around. There was an entire planeload of Army mad as hell surrounding them. Finally with a little judgement those cops picked up that POS and carried him out of there to an emergency hospital. And as we walked down through those scum protesters it was like the parting of the Red Sea. Like you, not one of them had considered the personal effect of your actions. I will tell you again you twerp – I have been in the front edge of science for 40 years and more. My first job out of the Air Force was nuclear research. What have you done jerkoff? Don’t give me some NASA website when they are liars like all of you “environmentalists”. You’re nothing more than another Margaret Sanger who wished to murder everyone other than the upper white elite. Who founded Planned Parenthood that are all placed in black or other minority neighborhoods and kill 40% of the business in black babies. So, yes, what you look like is really important because I think you have a face to smash in. Before and after photos would be a nice page in facebook with your name on it.
“Little MFers like you”, “you twerp”, “jerkoff”, “liars like all of you”, “murder everyone”, “kill 40% of the business in black babies”, “a face to smash in”, etc, etc.
>> Clearly you have some issues. And none of your outrage has any relevance on the science, evidence and implications of climate change. And no, you are not on the “front edge of science”. You are far behind and simply repeating the tired, old talking points of disinformation professionals…and are convincing no one.
94-99% returnees reported friendly reception.
Planes would land at military base, not civ airport
https://www.nytimes.com/2017/10/13/opinion/myth-spitting-vietnam-protester.html
I notice that you’re more than willing to take that picture completely out of context. When was THAT picture taken and where? It certainly looks like a group of families on a military base. The only places I saw friendly receptions was at Travis Air Force Base. Why would you be more willing to accept the line of some scummy leftist over people who actually experienced it in person? There is something really wrong with you liberals.
First of all, I quoted the NY times for their discussion of two survays.
You don’t talk about that.
Second, I noted the airports planes landed
You don’t talk about that.
Third, the article specifically address the claims, the near mythological story you tell.
And the picture has the photographers name, and the military unit those families were a part of.
Read up. The photo well represents the context of the article.
“Why would you be more willing to accept the line of some scummy leftist …”
Corroborated by nationally represented accounts and research.
And, by the way, first hand experience.
And I’d really like to read how that looks like an on base photo.
Robert – let me take your points in line:
1. “Even The Times once quoted, matter-of-factly, a veteran telling of how he arrived stateside from Vietnam on a stretcher with a bullet in his leg, only to be splattered with rotten vegetables and spat on by antiwar college kids.
Whoppers like these go unchallenged by reporters and scholars perhaps because of their memoirist first-person quality, stories told by the men who say it happened to them.”
So even though the Times reported this, it’s untrue. Doesn’t that give you a really uneasy feeling the in the pit of your stomach?
2. Commercial landings to military bases didn’t come until late in the Vietnam Airlift. Exactly how in the hell do you suppose they made interconnecting flights for the myriad bases they had to go to?
3. In my previous postings I noted NOT just the experience I had but the fact that I did the Avionics recovery for 3 years during the Vietnam Airlift. I saw this happen at ALL of the major airports but especially at San Francisco International Airport.
4. That picture did NOT say it was at a military base or where. It said “people welcoming home military.” Exactly what is your point in saying otherwise? Unless you somehow have something different than the picture I’m seeing?
And by the way – don’t think for one second that surveys aren’t designed to arrive at a conclusion. Any social research group well knows how to do surveys so that their beliefs are upheld with a survey. For instance – surveys show that climate change is believed in by 97% of all scientists. Scientists find that interesting because less than 30% actually do.
I will note that by not including the whole paragraph in your quote you’ve changed the meaning of your material.
That is pretty poor behavior, ethically, academicaly, intellectuslly.
I was landing on airbases from 67 . The article corroborate’s that.
V. You making a claim. Like your ‘fractured jaw’ claim.
3 is again you making claims. Which was much the point of the article;that most of the claims grew to near mythology and with little factual basis or evidence.
So, basically, your storytelling is just reinforcing the findings of the nyt article.
4. Your claim: “It certainly looks like a group of families on a military base.”.
I said the photo was in context to the article. Vets generally recd good treatment on landing.
By quoting the entire paragraph I change it’s meaning???? That’s just about the most audacious thing you could say. It proves your own poor ethics!
Exactly what is “I was landing on airbases from 67” supposed to mean?
In my experience which is, I’ll warrant, a great deal wider than yours, that is what I saw. I had my own personal experience of being spit on in LA International. I also worked in all of the major airports around the San Francisco bay area all the way down to Moffett Field and San Francisco International, Oakland International and Travis AFB where the protesters would be lined up outside of the base picketing the AFB.
“And the picture has the photographers name, and the military unit those families were a part of.” is exactly what you said.
Yup. Read your excerpt, then go read whole para.
Then tell us what the first part of the paragraph says.
Again, you’re making claims with no evidence. Assertions which you have no basis to form a statement from.
“..great deal wider than yours,”
And again, I’m going to restate the thesis of the article I linked to: the tales of spitting and other ill-treatment has not been borne out in facts. The stories have commonalities that are assumed and don’t fit the basic facts on the ground.
Yup, you’ve got the facts about the photos provenance.
And agsin, I’ll point out that we have your story v.actual research.
“I was glad the reporter was interested in the origin of these stories, because beginning even before the war ended, news organizations had too often simply repeated them — even though some stories had the hallmarks of tall tales all over them. Even The Times once quoted, matter-of-factly, a veteran telling ….”
Thanks for the days long demonstration of what it takes to fabricate a devoid of fact position.
Let me guess – EVEN though it was written in the New York Times it is your claim (on the weight of exactly whom again?) that this was a myth.
http://www.startribune.com/disrespect-for-vietnam-vets-is-fact-not-fiction/160444095/ is another experience altogether. Complete with incidents.
And https://www.deseretnews.com/article/40449/VIETNAM-VETS-RECALL-THEIR-HOMECOMINGS—-OFTEN-PAINFULLY.html
“John J. Quirk, South Holland, Ill.
After serving in Vietnam from June ’66 to June ’67, I returned to the States to a wonderful reception.
It was the first week in June. I landed at Travis Air Force Base in California, went to the Oakland Army Terminal, and was cleared to go home for 30 days’ leave. I bought a ticket for a flight to Chicago that was scheduled to depart at approximately 4 p.m. Pacific Time. As I walked through the terminal, I noticed several long-haired people but thought nothing of it until I was approached by a young couple who stoped me and asked if I were returning from Nam.
As they were smiling and seemed friendly, I said yes. With that they both started calling me names — Baby Killer and Fascist Dog, among others — before the girl spat at me as her friend shoved me.”
“David Alvarez, San Jose, Calif. The first time I was in transmit from my ship to a temporary duty station. It was the fall of 1970 and I was in Sacramento, Calif., bus station. I was wearing my dress blue uniform with my Vietnam service ribbons, and I was carrying my sea bag over one shoulder. I was confronted by five anit-war protesters — two females and three males. They stopped to question me about my feelings about the war. I declined to comment. Suddeny one of the females began calling me a baby killer and spat on me.”
“The second incident occurred when I returned from Vietnam in the fall of 1971. I was in my dress uniform in San Francisco airport waiting for my wife to arrive from out of state, when a guy ran up to me, called me a war monger, spat on me and ran off. I started after him, but I lost him in the airport crowd.”
These are letters ONLY from those who happened to read that particular columnist. And were willing to recount painful experiences.
But to leftist crap like Robert it’s all lies.
And do you know why? Because Obama WANTED to continue his war and so had to make people love the soldiers and so he put the word out and the leftist media ran as he beckoned. This is the way of socialists. They stick together like crap and toilet paper.
“whom” would, of course, be the author of the nyt article you misrepresented by your selective quoting.
Again, yet again, you can quote modern ( 1989) sources talking about what a particular writer claims, just as you can write your ‘fractured jaw’ stories. Stories that have similarities, tropes that don’t fit, and parts that don’t match the facts on the ground.
Rational readers know to read the primary documemts. The one discussed in the nyt article.
And, we’ll also note the attmepts at insulting namecalling,
Whom would be someone other than the author of the New York Times inserting HIS OPINION. Meaning of course that both YOU and HE intended to mislead people and not I.
While you are talking about “tropes” I find that extremely interesting since the use of that word became popular among hippies. But you ain’t old enough for that so I’ll ask you again – were you one of those who had drug using hippy grandparents that left you alone in the crib while they got high? And you intend to spend the rest of your life pretending that they were just good and you had explanations of why they couldn’t have their jaws broken as well?
Rational readers know how to understand what was written and not the intentional misdirection by other people as you have been doing.
Since you noted the intended insult I hope you will take it to heart.
Especially with your intense ignorance of everything military and your follower attitude which equally matches that of all of the True Believers in the Church of Global Warming. You are doing nothing more than following the liberal line that “we’ve always been the good people, even when we were hanging niggers and Republicans”
“While you are talking about “tropes” I find that extremely interesting since the use of that word became popular among hippies. ”
“..drug using hippy grandparents..”
“..liberal line that “we’ve always been the good people, even when we were hanging niggers and Republicans” ”
” True Believers in the Church of Global Warming. ”
You are continuing to confuse agenda driven letters written in the late 1980s with reporting done at the time.
You also confuse invective , insulting, scare quotes, & irrational claims w no corroborating evidence with forming coherent arguments with supporting data.
C.R.A.A.P. TEST
Currency: the timeliness of the information
When was the information published or posted?
Has the information been revised or updated?
Is the information current or out-of date for your topic?
Are the links functional?
Relevance: the importance of the information for your needs
Does the information relate to your topic or answer your question?
Who is the intended audience?
Is the information at an appropriate level (i.e. not too elementary or advanced for your needs)?
Have you looked at a variety of sources before determining this is one you will use?
Would you be comfortable using this source for a research paper?
Authority: the source of the information
Who is the author/publisher/source/sponsor?
Are the author’s credentials or organizational affiliations given?
What are the author’s credentials or organizational affiliations given?
What are the author’s qualifications to write on the topic?
Is there contact information, such as a publisher or e-mail address?
Does the URL reveal anything about the author or source?
examples: .com (commercial), .edu (educational), .gov (U.S. government),
.org (nonprofit organization), or .net (network)
Accuracy: the reliability, truthfulness, and correctness of the content, and
Where does the information come from?
Is the information supported by evidence?
Has the information been reviewed or refereed?
Can you verify any of the information in another source or from personal knowledge?
Does the language or tone seem biased and free of emotion?
Are there spelling, grammar, or other typographical errors?
Purpose: the reason the information exists
What is the purpose of the information? to inform? teach? sell? entertain? persuade?
Do the authors/sponsors make their intentions or purpose clear?
Is the information fact? opinion? propaganda?
Does the point of view appear objective and impartial?
Are there political, ideological, cultural, religious, institutional, or personal biases?
http://libguides.library.ncat.edu/content_mobile.php?pid=53820&sid=394505#box_394505
Here’s a couple of simple worksheets to print out to help:
http://libraryguides.ccbcmd.edu/ld.php?content_id=14159298
http://www.juniata.edu/services/library/instruction/handouts/craap_worksheet.pdf
A Times reporter isn’t good enough a source for proof that there was spitting incidences but is more than good enough to prove the reverse. As I said, your sorts of responses come from the mentally disturbed.
Note the “even”.
Whether the difficulty is willfully induced or not, you’re ascribing a meaning that doesn’t fit to the thesis or the para or the sentence.
And noted again, insulting
Robert “nitpicks” imaginary faults when he can’t come up with a valid reply.
His problem, not yours.
He has NEVER explained his “I’ve been landing on airbases since 67”. He appears to be implying that he was a commercial airline pilot. Now IF he were and he landed at any other commercial airport he couldn’t MISS the protesters and their actions against the troops. If he WERE a commercial airline pilot they would rotate flight crew out after long flights and he would KNOW that picture had been taken in a base housing complex. Alameda Naval Air Station is no longer an active base but they STILL have these family housing areas and you can still see them in use by perhaps retired lifers or something.
In short – he is in fact attempting to lie about this entire incident because that is the latest liberal line.
it;s an invented background. All his sock puppet must have separate personalities.
Robert is a serial bullzhitter.
Lots of wrong ‘ifs’.
Thanks.
You are the one that stated, “I was landing on airbases from 67” and then wouldn’t answer any questions about that. You plainly meant to imply that you had direct experience with commercial aircraft landing at military bases.
As I noted – besides my own experience in the Air Force, I did electronics instrument recovery on commercial aircraft for three years and they did NOT land at airbases until the end of that three years. The very idea that you could bring thousands of soldiers back with no way to catch interconnecting flights is preposterous. Or perhaps you’re suggesting that they would shuttle soldiers in military buses into the middle of these protesters.
There is really something not all there with you. And your kind of responses comes from people who are mentally disturbed.
Nope. The was no imply.
The difference is that mine match to the facts and descriptions as stated in the article.
What we have is your claims on climate science and on this topic being driven by ideology rather than facts as research show.
You are but a liar. And you couldn’t recognize a fact. Why haven’ you explain your “I was landing on airbases from ’67” statement?
Submitted by Bruce L. Webb, Feb 8, 2007 17:57
Spat on? After two years in theater, I began to meet old Army buddies returning from the “World” who told me harrowing stories about how they’d been “welcomed” home, to such a degree that they volunteered to return to VN rather than be where they were universally reviled for their service. I didn’t believe them – until, on-about-04/15/71 I “processed” off Oakland Army Base enroute home to Texas. As I walked out of the front gate, a very pretty, long-haired blonde girl ran toward me. I smiled at such enthusiasm, but learned quickly as she screamed, “Baby killer”, and SPAT IN MY FACE that my buddies hadn’t lied, Instinctively, I lurched forward to defend myself, but was grabbed by an unseen (GI) hand and jerked backward toward the waiting bus and heard, “It ain’t worth it.” I got on the bus, shocked, humiliated and morally destroyed (no doubt, the plan all along). Only later did I learn that it was an orchestrated act common throughout the US at the time. I see it in my mind’s eye to this day as if it is a bad dream, relived like a bad movie – I would recognize the blonde girl to this day. I will never forget, nor forgive. Bruce Webb, SPC5, USA
We thank you for again trying to equate reminisces from years (1890s or in this case 2007) past with what the documented reporting shows.
Reminisces, anecdotes that have the same non factual points given. Also, claimed expertise in science.
Neither of which fit to the facts on the ground.
Unsupported claims.
And insulting.
“While you are talking about “tropes” I find that extremely interesting since the use of that word became popular among hippies. ”
“..drug using hippy grandparents..”
“..liberal line that “we’ve always been the good people, even when we were hanging niggers and Republicans” ”
” True Believers in the Church of Global Warming. ”
You confuse invective , insulting, scare quotes, & irrational claims w no corroborating evidence with forming coherent arguments with supporting data.
C.R.A.A.P. TEST
Currency: the timeliness of the information
When was the information published or posted?
Has the information been revised or updated?
Is the information current or out-of date for your topic?
Are the links functional?
Relevance: the importance of the information for your needs
Does the information relate to your topic or answer your question?
Who is the intended audience?
Is the information at an appropriate level (i.e. not too elementary or advanced for your needs)?
Have you looked at a variety of sources before determining this is one you will use?
Would you be comfortable using this source for a research paper?
Authority: the source of the information
Who is the author/publisher/source/sponsor?
Are the author’s credentials or organizational affiliations given?
What are the author’s credentials or organizational affiliations given?
What are the author’s qualifications to write on the topic?
Is there contact information, such as a publisher or e-mail address?
Does the URL reveal anything about the author or source?
examples: .com (commercial), .edu (educational), .gov (U.S. government),
.org (nonprofit organization), or .net (network)
Accuracy: the reliability, truthfulness, and correctness of the content, and
Where does the information come from?
Is the information supported by evidence?
Has the information been reviewed or refereed?
Can you verify any of the information in another source or from personal knowledge?
Does the language or tone seem biased and free of emotion?
Are there spelling, grammar, or other typographical errors?
Purpose: the reason the information exists
What is the purpose of the information? to inform? teach? sell? entertain? persuade?
Do the authors/sponsors make their intentions or purpose clear?
Is the information fact? opinion? propaganda?
Does the point of view appear objective and impartial?
Are there political, ideological, cultural, religious, institutional, or personal biases?
http://libguides.library.ncat.edu/content_mobile.php?pid=53820&sid=394505#box_394505
Here’s a couple of simple worksheets to print out to help:
http://libraryguides.ccbcmd.edu/ld.php?content_id=14159298
http://www.juniata.edu/services/library/instruction/handouts/craap_worksheet.pdf
Robert, I’m just a poor little 73 year old man. What I would like you to do is stop hiding behind a keyboard and tell me these sorts of things to my face.
Yup, a bout with nerf sticks will settle whether accurate reporting at the time is beaten by reminisces written decades later.
Oh Robert,….. what a lame reply.
Normal for you of course
FYI, I couldn’t reply to you because I was banned at the food channel for that comment you responded to.
They both discuss farmers making a living and the state of the food industry. Lots of interrelated topics, though the interviewer really wanted to talk about A.Ws new book rather than what happened in P.R. , etc.
Thanks.
Re:your banning , politics in food was also much discussed in the interview.
Up vote wasn’t for you getting banned, but for bringing up the topic.
And my post was removed….
This comment section doesn’t show my answer which I previously posted so I’ll simply repeat:
1. Virtually all surveys are nothing more than political assets. Any research organization can make a survey report anything they want it to. Trump won with an large margin and you can still get surveys from the Times that Obama was preferred let alone Hillary.
2. I entered the USA from the war zone at LA International. I worked on commercial aircraft for three years and until the very end of the Vietnam Airlift all military came through International airports. Exactly how do you propose men stationed at three dozen different bases around the country would get connecting flights? In short – you don’t know what you’re talking about.
3. That story is nothing more than a leftist lie. I told you my experience and if you wish to deny it that is your problem and not mine.
http://www.startribune.com/disrespect-for-vietnam-vets-is-fact-not-fiction/160444095/
Chicago Tribune: “Homecoming”:
“From Library Journal
“Were you ever spat upon when you returned home to the United States?” asked syndicated columnist Greene of the Vietnam veterans among his readership. He received over 1000 letters in reply, many recounting specific details of just such a painfully remembered incident. Evidently this recollection of “hippies” (as they are often called in the letters) spitting on combat veterans has become one of the war’s most unpleasant, enduring images. Conversely, other letters describe acts of generosity toward servicemen, from the typical free beers at the bar to a free show. But the over 200 letters excerpted here do more than confirm popular notions. They bring back the incidents of 20 years ago vividly, but not always with bitterness. And they reveal healing solidarity among veterans in response to what for many was not a happy homecoming. Recommended. Richard W. Grefrath, Univ. of Nevada Lib., Reno
Copyright 1989 Reed Business Information, Inc.”
Almost 3 million Americans served in Vietnam. Most Americans respect not just those who serve in the military but the idea of what Vietnam was about. Obviously YOU do not understand what both Korea and Vietnam were all about.
This does NOT change the fact that the Hippies and Flower Children did express hatred for those they came in contact with and did so viciously at major airports. But a truck driver who knows where his freedom’s emanate buying a vet a beer doesn’t mean that these other incidents did not happen.
You’d really like to know how that looks like an on-base photo??? You were NEVER in the service obviously. Apparently you were NEVER ON a military base and know nothing at all about the on-base housing for families.
I would like to know where in hell you think you have the right to talk about things you don’t know about?
Again, your claims. And the book review you cited reinforces the nyt article;that the stories have many commonalities that are not well supported by primary documents. Note in particular, the reviewer mentioning the use of “hippies”.
Let me guess – your real job is a circus clown? Don’t tell me these things never happened because all of the 3 million people who took part in Vietnam never experienced them. You are about as twisted as possible.
Ahhh, insulting.
More than insulting if you said anything like that to my face. Believe me. Come to Oakland sometime and we’ll show you a night on the town.
And there we go…..
Thanks for the demonstration.
I asked you point blank – are you saying these things didn’t occur?
And I’ve dold you several times. The story you are telling fits to retelling posted many places and those stories not only don’t mesh well with the facts on the ground ,but also contain many illogical pieces.
I’m going to stay with reliable sources, extensive research rather than ideologically driven decades after the fact storytellers.
This thread is full of antagonistic language, threats, accusations; and you own them.
Your penultimate paragraph makes assertions that are just unjustified personal attacks.
Your third to the last paragraph is an effort of equivocation and a restating of claims not supported by primary documentation.
Your 4th to the last paragraph is a ‘wrap myself in the flag’ and an unsupportable personal attack and a claim not supported by your bringing forward supporting evidence, not to mention wandering far afield from the topic..
What’s the matter? Are you afraid of a cyber bully? Will you run away from home? Nothing you’ve said has any relevance to science. You haven’t a single qualification in science. Yor hero Dr. Michael Mann is going down hard and there isn’t any talking or quoting NASA that is going to help you help him. You’re nothing more than another disciple in the Church of Global Warming.
You’re a liar. Never happened. It would have made headlines – and no such headlines exist.
Anywhere. Ever.
https://en.wikipedia.org/wiki/The_Spitting_Image
I figured that you were some baby fresh out of the womb. The fact is that it happened to me so I expect it happened to others. And eventually this will be coming to you. I expect someone like you will write a book about no one ever believing global warming.
Nothing happened to you. That happened to no one – and you insult the dignity of real veterans with your ugly hateful and stupid lies.
Well, at least we know that you are a little child that never went anywhere and did anything. Between engineering jobs I took a job working for Bayaire Avionics in Oakland. I
recovered aircraft avionics for three years. This was the time of the Vietnam Airlift and I saw this so bad that anyone that says it never happened is not mistaken but a liar. The Flower Generation in all its glory. Was that what you got from your human waste grandparents as they were getting high and you were supposedly in their care? So by all means tell me all about how you read a wikipedia entry that said it never happened.
Once again you make up nonsense about me – hoping to offend. But offence is only taken at your lies and hatemongering. I’ve known a gamut of Americans from Vietnam vets to draft dodgers – and the draft dodgers have had nothing but respect for the men that actually served.
And perhaps I take offense at your arrogant stupidity, as you continue to pretend that you are the one mythical elusive victim of expectorating peaceniks. Do you not understand how ridiculous this pretense makes you seem?
You are no veteran.
STFU and stop embarassing the men who are. You are nothing but a blustering buffoon.
We can tell what you think of as a real man – a pole dancer like you.
1.5 TRILLION!!!
My, thats a fascinating and, of course, given that it’s made by you, totally unsubstantiated claim. Care to try, or shall we just assume you’ve scooped it out of the back of your Depends again, old man?
You are really scum aren’t you? All you would have had to do is a search but since it’s something you don’t WANT to know you wouldn’t look https://www.forbes.com/sites/larrybell/2011/08/23/the-alarming-cost-of-climate-change-hysteria/#6e106137ebbe
Name-calling…a strategy typical of propagandists and fifth-graders.
And it doesn’t change the fact that a human garbage bag is making claims without even bothering to look it up. Believe me I would love to get your picture and your work history to publish on the web.
Look what up? The silly and intentionally misleading 2011 article written by disinformation professional and heartland affiliate larry bell?
Once again, do you ever read the articles you link before posting them? Do you understand logic?
If climate change is not real, how can foreign aid to combat its effects be considered an expense of climate change? Aren’t tropical storms, droughts and flooding simply natural events requiring humanitarian aid?
And if “technological subsidy” through tax breaks is to be counted as a climate change expense, surely new tax revenue from burgeoning new industries should be counted as new-found revenue at the same count. Ever hear of Tesla?
These are but two of the logical failings and flaws in this article. Can you not recognise nonsense when you read it?
The Seminal Moment when you realize you have to take a different tack. A different lie. But I must admit you are growing more rediculous by the moment. “IF CLIMATE CHANGE ISN’T REAL WHY WOULD OBAMA GIVE BILLIONS TO HIS SUPPORTERS?” And GEE why would he give $525 Million to Solyndra who the very next day passed out that money to the management and then claimed bankruptcy?
If you’re going to accuse me of lying it behooves you to actually point out a lie.
As for Solyndra: http://www.nytimes.com/2011/09/24/opinion/the-phony-solyndra-scandal.html
“… if we could just stop playing gotcha for a second, we might realize that federal loan programs — especially loans for innovative energy technologies — virtually require the government to take risks the private sector won’t take. Indeed, risk-taking is what these programs are all about. Sometimes, the risks pay off. Other times, they don’t.
It’s not a taxpayer ripoff if you don’t bat 1.000; on the contrary, a
zero failure rate likely means that the program is too risk-averse.
Thus, the real question the Solyndra case poses is this: Are the
potential successes significant enough to negate the inevitable
failures?
I have a hard time answering “no.” Most electricity today is generated by coal-fired power plants, operated by monopoly, state-regulated utilities. Because they’ve been around so long, and because coal is cheap, these plants have built-in cost advantages that no new technology can overcome without help. The federal guarantees help lower the cost of capital for technologies like solar; they help spur innovation; and they help encourage private investment. These are all worthy goals.
To say “no” is also to cede the solar panel industry to China,which last year alone provided some $30 billon in subsidies for its solar industry. Over all, the American solar industry is a big success story; it now employs more people than either steel or coal, and it’s a net exporter.”
Odd that someone who likes to rap himself in the Stars and Stripes is so willing to relinquish the industries of the future to China.
Sorry – you and all of the Warmies have told us that Solar is a sure thing. All of the major power companies around the country have large solar installations.
Now you are telling us that it was a huge risk and the loss of a half billion dollars was just one of those things.
Nothing more than your BS to cover criminal activity. ALL of the money from that loan went to the upper management as they claimed bankruptcy. The management of the company took THE FIFTH and answered none of the questions.
Now you’re trying to support your new lie.
A second lie already? You haven’t even revealed the first one yet.
Tinfoil firmly in place and strapped on….
“Wake Ian5
13 days ago
Circa 1985 ALL truth about the climate was no longer available. Of COURSE most of the world’s scientific community could “agree” with the NASA assessment becauseit was an attempt to hobble the US production engine that control most of the world’s production .”
https://disqus.com/home/discussion/cfact/decision_looms_in_michael_mann_tim_ball_8220hockey_stick8221_lawsuit/#comment-3671684796
Tell me exactly what you know about “thousands of scientists working the world over”. Name these thousands.
Stop being lazy and read the literature.
http://www.prisonplanet.com/lord-monckton-shut-down-the-un-arrest-the-warmist-criminals.html
The endgame of the climate scam is to destroy ALL industry, ALL nations, ALL democracy & ~ 95% of humanity.
The aim is a Communist/Fascist Totalitarian govt of Banksters & their cronies as feudal Lords over the few remaining peasants in the Hunger Games future paradise they’re herding us towards.
http://www.c3headlines.com
Click on Quotes.
If you want to know about the real world I would suggest you get a copy of “The Road to Serfdom” by F.A. Hayek. Though most liberals prefer a 2 minute video. This reading stuff were real knowledge is imparted rather than talking points is just, like man, to serious.
My “to read” list just keeps stretching longer. :)
This Holocene Inter Glacial Warm Period PEAKED
in Temperatues about 8000-9000 years ago.
Since then,
temps have been slowly falling as we slide
into Earth’s most powerful cyclical
CLIMATE CHANGE: Glaciation ! (ice age)
.
Look: http://www.realclimate.org/images//Marcott.png
We were pulled toward the next ICE AGE !
…As Earth is still Being Pulled, in orbit, away from the Sun.
….We should still be cooling toward an ice age, but in the mid 1700’s
Earth’s MOST powerful natural Cycle was terminated.
the Ice Age was terminated
…abruptly…temps started to rise .
Direct observations
1799
Alexander von Humboldt studied, worried and postulated that
Human Activites / pollution would CAUSE CLIMATE CHANGE!
1799
Thomas Jefferson also penned a paper
on observed changes in climate which he stated was
probably caused by man.
1811, Science Tied Warming, Climate Changes directly to
Human Activities & Industrialization.
.
1856 “…the work of Eunice Foote, who three years prior
to the start of Tyndall’s laboratory research, conducted
similar experiments on absorption of radiant energy
by atmospheric gases, such as CO2 and water vapor.
.
The presentation of her report at a major scientific convention in 1856
was accompanied by postulation that even modest increases
in the concentration of CO2 could result in significant atmospheric warming.”
http://www.searchanddiscovery.com/..
.
CO2 is rising sharply due to human activity.
.
Satellite & surface measurements find less energy
is escaping to space at CO2/H2O (& other Green House Gasses)
absorption wavelengths.
Ocean and surface temperature measurements
These Research studies find the planet
continues to accumulate heat.
Year after year.
HERE is a line of empirical evidence:
that human/industry CO2 emissions are causing global warming.
**
*
Climate Myth / The Skeptic-Denier position.
There’s no empirical evidence
“There is no actual evidence that carbon dioxide emissions
are causing global warming. Note that computer models are just
concatenations of calculations you could do on a hand-held calculator,
so they are theoretical and cannot be part of any evidence.”
(noted DENIER David Evans)
***
The line of empirical evidence that humans
are causing global warming is as follows:
.
We’re raising CO2 levels
.
Human carbon dioxide emissions are calculated
from international energy statistics, tabulating coal, brown coal,
peat, and crude oil production by nation and year, going back to 1751.
.
CO2 emissions have increased dramatically over the last century,
climbing to the rate of 29 billion tonnes of CO2 per year in 2006 (EIA).
.
Atmospheric CO2 levels are measured at hundreds of
monitoring stations across the globe.
.
Independent measurements are also conducted by airplanes and satellites.
For periods before 1958, CO2 levels are determined from air bubbles trapped in polar ice cores.
In pre-industrial times over the last 10,000 years,
CO2 was relatively stable at around 180-to-280 parts per million.
.
Over the last 250 years, atmospheric CO2 levels have increased
by about 100 parts per million.
.
Humans are emitting more than twice as much CO2 as what ends up staying there.
Nature is reducing our impact on climate by absorbing
more than half of our CO2 emissions.
.
The amount of human CO2 left in the air, called the “airborne fraction”,
has hovered around 43% since 1958.
CO2 traps heat
.
According to radiative physics and decades of laboratory measurements,
increased CO2 in the atmosphere is expected/predicted to absorb
more infrared radiation as it escapes back out to space.
Human Agriculture & Industry is producing 120-135 TIMES MORE CO2
than ALL of EARTH’s Volcanoes Combined….every year !
..
Leading
Scientists
Questioned
Green House Gas effects in our atmosphere:
So,
In 1970,
NASA launched the IRIS satellite measuring infrared spectra.
.
Google: Iris Satellite Research Abstract
.
In 1996,
the Japanese Space Agency launched the IMG satellite
which recorded similar observations.
Google: IMG Satellite Research Abstract
.
Both sets of data were compared to discern any changes
in escaping radiation levels over the 26 year period
Google (Harries 2001 research abstract)
.
What they found was a drop in Escaping Infra Red radiation
at the PRECISE wavelength bands that greenhouse gases
such as CO2 with H2O, CFC’s, Ozone,
Nitrous Oxides, and methane (CH4) absorb energy.
The change in DECREASE IN ESCAPING I.R. radiation was consistent
with theoretical Expectations / Predictions.
.
This research & paper found
“direct experimental evidence for a significant increase
in the Earth’s greenhouse effect” and Warming on Earth.
.
This result has been confirmed by subsequent research & papers
using data from later satellites
Google (Griggs 2004 Research Abstract)
Google (Chen 2007 Research Astract )
.
Figure 2: Change in spectrum from 1970 to 1996 due to trace gases.
‘Brightness temperature’ indicates equivalent blackbody temperature
Google (Harries 2001 Research Abstract)
When greenhouse gases absorb infrared radiation,
the energy heats the atmosphere which in turn
re-radiates infrared radiation in all directions.
.
Some makes its way back to the earth’s surface.
Hence
we Expect/Predict to find more infrared radiation heading downwards.
.
Surface measurements from 1973 to 2008 find an increasing trend
of infrared radiation returning to earth
Google (Wang 2009 Research Abstract)
.
A regional study over the central Alps found that
downward infrared radiation is increasing due to the
enhanced greenhouse effect
.
Google (Philipona 2004 research abstract).
.
Taking this a step further, an analysis of high resolution spectral data
allowed scientists to quantitatively attribute the increase in
downward radiation to each of several greenhouse gases
.
Google (Evans 2006 Research abstract)
.
The results lead the authors to conclude that
*
*** “this experimental data should effectively end the argument by skeptics
that no experimental evidence exists for the connection between
greenhouse gas increases in the atmosphere and Climate Changes caused
by global warming.”
CO2 & Temperature Marriage:
https://www.bing.com/images/search?view=detailV2&ccid=%2f%2bt8mfVF&id=8999BA373F3B7B4F391B144E98514B474B7894CF&thid=OIP._-t8mfVFvINxHRaKkITjvAHaFT&mediaurl=http%3a%2f%2fzfacts.com%2fmetaPage%2flib%2fzFacts-CO2-Temp.gif&exph=377&expw=526&q=graph+co2+and+world+temperature+rise&simid=608046613771259242&selectedIndex=0&ajaxhist=0
https://en.wikipedia.org/wiki/Effects_of_global_warming#/media/File:2000_Year_Temperature_Comparison.png
.
As I’ve stated before – CO2 is meaningless. What’s more what do you want to bet that NASA doesn’t tell us that this year is another “hottest year ever” despite the fact that all over the world temperatures have been average or below average. Last night was the 2nd coldest temperature on record for New York City.
and of course, you pick 1 local number to give yourself the illusion that your are talking about GLOBAL warming.
Did Breitbart and Daily Caller never mentions the huge heat waves and droughts around the world?
Across the middle east, N. Africa…ETC……
Sorry you missed it.
Deadly heat waves could hit South Asia this century | MIT News
news.mit.edu/2017/deadly-heat-waves-could-hit-south-asia-century-0802
Bose Grants for 2017 reward bold and … Deadly heat waves could hit South Asia this … found climate change could cause deadly heat waves in South Asia by the end …
India facing another summer of deadly heat – CNN
http://www.cnn.com/2017/04/24/asia/india-heat-wave-deaths/index.html
Apr 24, 2017 · India facing another summer of deadly heat. … 2017 . Chat with us in … said that while 11 states have prepared plans for this year’s heat wave, …
Historic Heat Wave Sweeps Asia, the Middle East and Europe
https://www.wunderground.com/cat6/historic-heat-wave-sweeps-asia…
Historic Heat Wave Sweeps Asia, … the 53.5°C reading at Turbat on May 28, 2017, ranks as one of Earth’s top five hottest reliably-measured temperatures on record
I wonder why you continue to assume that real science isn’t real science?
The temperatures I said were about normal or below were from South African, Central Africa, Israel, France, Brisbane Australia, Shanghai, the west coast, central US and east coast.
I wonder what is going through your head when you use a link to an article that says that MIT determined that heat wave could happen in decades if nothing is done? As I noted before – NASA has manufactured temperature records since 1980-1990 and NO scientist’s research can be trusted when the data they are working with is faulty.
” Deadly heat waves could hit South Asia” – Do you understand what the word “could” signifies?
You continue to offer links that do not work. “Oops, this site is not available”.
CO2 & Temperature Marriage:
https://www.bing.com/images/search?view=detailV2&ccid=%2f%2bt8mfVF&id=8999BA373F3B7B4F391B144E98514B474B7894CF&thid=OIP._-t8mfVFvINxHRaKkITjvAHaFT&mediaurl=http%3a%2f%2fzfacts.com%2fmetaPage%2flib%2fzFacts-CO2-Temp.gif&exph=377&expw=526&q=graph+co2+and+world+temperature+rise&simid=608046613771259242&selectedIndex=0&ajaxhist=0
https://en.wikipedia.org/wiki/Effects_of_global_warming#/media/File:2000_Year_Temperature_Comparison.png
http://www.woodfortrees.org/plot/gistemp/from:1980/plot/gistemp/from:1980/trend/plot/gistemp/from:1997/plot/gistemp/from:1997/trend
****
***
2017 is behind only El Niño-amplified 2016. Dana Nuccitelli.
Mon 31 Jul ’17 06.00 EDT.
.
With the first six months of 2017 in the books, average global surface temperatures so far this year are 0.94°C above the 1950–1980 average, according to NASA.Jul 31, 2017
.
2017 is so far the second-hottest year on record thanks to global …
.
https://www.theguardian.com/…/2017/…/2017-is-so-far-the-second-hottest-year-on-reco…
***
Just like your 1 of a kind records.
**
China 50.5 °C (122.9 °F) Erbao Township, Turpan, Xinjiang 10 July 2017[37]
***
Iran 54 °C (129 °F) Ahwaz
Airport (OIAW) 29 June 2017 [
***
Oman 50.8 °C (123.4 °F) Buraimi,
30 May 2017 [51]
***
Pakistan 53.5 °C (128.3 °F) Mohenjo-Daro
28 May 2017
***
Spain 47.3 °C (117.1 °F) Montoro, Cordoba (as Montoro Vega Armijo) 13 July 2017
***
Chile 44.9 °C (112.8 °F) Quillón, Biobio Region[notes 11] 26 January 2017
***
Highest Overnight Low: 44.2 °C (111.6 °F) at the Khasab weather station (WMO Index = 41241) in Oman on June 17, 2017
***
THE LAST Record Cold World Wide Year was 1909/1911.
***
The Thames River routinely froze over 3-4 times per century…hasn’t frozen since 1814 .
There we go with your comedy routine again:
Erbao Township, Turpan, Xinjiang had a previous high of 49.9C. So you think that .6 degrees C show something?
Ahwaz International Airport Iran “The highest daily average high temperature is 115°F on July 27.” Did you note that word “AVERAGE”?
Buraimi – When I send them a message why does the Omani weather bureau tell me that the hottest temperature ever recorded in May was 34.5 degrees C? And that it never hit 50.8 degrees C anywhere in the entire country of Oman in May of 2017? That the highest temperatures occur at the end of July and rarely exceed 38C?
The Thames never froze over from 800-1400 AD. It only commonly froze over during the little ice age.
Nonsense !
The science dates back to 1799…
https://data.giss.nasa.gov/gistemp/graphs/graph_data/Global_Mean_Estimates_based_on_Land_and_Ocean_Data/graph.html
That chart is an outright lie. It shows about .9 degree C. rise from 1979 until 2016. The ACTUAL change averaged zero. This is the measurements in that time from Dr. Roy Spencer – the lead scientist on the NASA climate satellite program: http://www.drroyspencer.com/wp-content/uploads/UAH_LT_1979_thru_March_2017_v6.jpg
This is the same Dr. Roy Spencer and Dr. John Christy
…with a record of FALSE STATEMENTS ON CLIMATE…many of which they have been forced to retract….
OOOPS !
time for a little CROW EATING CONTEST….my bet is on Spencer !
FROM THOSE LEADING
CLIMATE
CHANGE
DENIERS.
The same 2 that Global Warming would END by 2000
.
A STUNNING ADMISSION:
The UAH’s Spencer and Dr. John Christy?
—both leading deniers?
—reported just last month that the UAH data shows a
“Global climate trend since Nov. 16, 1978 [of] +0.12 C [0.22F] per decade.”
NO PAUSE !
NO HIATUS !
sure as hell, NO COOLING !
SPENCER:
“my UAH cohort & boss John Christy, who does the detailed matching
between satellites, is pretty convinced that the RSS data is
undergoing SPURIOUS COOLING because RSS is still using the old NOAA-15
satellite which has a decaying orbit…”
“
Then by all means explain the discrepancy between that so-called temperature chart and the one taken by NASA weather satellites from 1979 to present?
http://www.drroyspencer.com/wp-content/uploads/UAH_LT_1979_thru_March_2017_v6.jpg
Why do you make these claims without a link? And if you do not have a link where do you get this sort of information? From some True Believer site? The fact is that YOU have to both read and understand any of these papers before you start talking about them. I’m not surprised at all that you talk about things that you don’t know what the hell you’re talking about.
Firstly, CO2 was suggested as a gas that might cause atmospheric heating by Svante August Arrhenius. He performed NO experiments himself but relied on some experiments that had to do with measuring the color of moonlight done by others. He was attempting to theorize why we had ice ages. That was circa 1886 I believe. Ever since that time people have unsuccessfully attempted to use his theory to show any number of things.
As we have seen – when the evidence of global warming is disproved by the numbers NASA has simply changed the numbers. https://thsresearch.files.wordpress.com/2017/05/ef-gast-data-research-report-062717.pdf
We could also present the information in this video but you don’t have the patience to do anything but scream “GLOBAL WARMING IS REAL” as your handlers have taught you.
https://www.youtube.com/watch?v=DJBDI7jVMqM
In laymen’s terms…so YOU can understand !
The story in a nutshell: Like most histories, this one begins far back. People had long suspected that human activity could change the local climate. For example, ancient Greeks and 19th-century Americans debated how cutting down forests might bring more rainfall to a region, or perhaps less. But greater shifts of climate happened all by themselves. The discovery in the mid 19th century that there had been ice ages in the distant past proved that climate could change radically over much of the globe, a change vastly beyond anything mere humans seemed able to cause. So what did cause global climate change — was it variations in the heat of the Sun? Volcanoes erupting clouds of smoke? The raising and lowering of mountain ranges, which diverted wind patterns and ocean currents? Or could it be changes in the composition of the air itself? In 1824 a French scientist had explained that Earth’s temperature would be much lower if the planet lacked an atmosphere, and in 1859 an English scientist discovered that the chief gases that trapped heat were water vapor and carbon dioxide (CO2).
In 1896 the Swedish scientist Svante Arrhenius published a new idea.
.
By burning fossil fuels such as coal,
thus adding CO2 to Earth’s atmosphere, humanity would raise the planet’s average temperature.
This “greenhouse effect,” as it later came to be called, was only one of many speculations about climate change, and not the most plausible.
.
The few scientists who paid attention to Arrhenius used clumsy experiments and rough approximations to argue that our emissions could not change the planet. Most people thought it was already obvious that puny humanity could never affect the vast global climate cycles, which were governed by a benign “balance of nature.”
In the 1930s, measurements showed that the United States and North Atlantic region had warmed significantly during the previous half-century.
Scientists supposed this was just a phase of some mild natural cycle, probably regional, with unknown causes.
Only one lone voice, the English steam engineer and amateur scientist Guy Stewart Callendar, published arguments that greenhouse warming was underway. If so, he and most others thought it would be beneficial.
In the 1950s, Callendar’s claims provoked a few scientists to look into the question with far better techniques and calculations than earlier generations could have deployed. This research was made possible by a sharp increase of government funding, especially from military agencies that wanted to know more about the weather and geophysics in general.
Not only might such knowledge be crucial in future battles, but scientific progress could bring a nation prestige in the Cold War competition. The new studies showed that, contrary to earlier crude assumptions, CO2 might indeed build up in the atmosphere and bring warming. In 1960 painstaking measurements of the level of the gas in the atmosphere by Charles Keeling, a young scientist with an obsession for accuracy, drove home the point. The level was in fact rising year by year.
During the next decade a few scientists worked up simple mathematical models of the planet’s climate system and turned up feedbacks that could make the system surprisingly sensitive. Others figured out ingenious ways to retrieve past temperatures by studying ancient pollen and fossil shells. It appeared that grave climate change could happen, and in the past had happened, within as little as a century or two. This finding was reinforced by more elaborate models of the general circulation of the atmosphere, an offshoot of a government-funded effort to use the new digital computers to predict (and perhaps even deliberately change) the weather. Calculations made in the late 1960s suggested that in the next century, as CO2 built up in the atmosphere, average temperatures would rise a few degrees. But the models were preliminary, and the 21st century seemed far away.
In the early 1970s, the rise of environmentalism raised public doubts about the benefits of any human activity for the planet. Curiosity about climate change turned into anxious concern. A few degrees of warming no longer sounded benign, and as scientists looked into possible impacts they noticed alarming possibilities of rising sea levels and possible damage to agriculture.
Meanwhile a few scientists pointed out that human activity was putting not only CO2 but ever more dust and smog particles into the atmosphere, where they could block sunlight and cool the world. Analysis of Northern Hemisphere weather statistics showed that a cooling trend had begun in the 1940s; was pollution the cause? (Decades later, scientists would confirm that soaring industrial pollution had in fact contributed to temporary Northern Hemisphere cooling.) The public media were confused, sometimes predicting a balmy globe with coastal areas flooded as the ice caps melted, sometimes foreboding a catastrophic new ice age, sometimes quoting expert assurances that nothing much would change. Study panels of scientists, first in the U.S. and then internationally, began to warn that one or another kind of future climate change might pose a severe threat. The main thing scientists agreed on was that they scarcely understood the climate system. The only policy action they recommended was to fund more research to find out what might really happen. Research activity did accelerate using state-of-the-art computers, international programs to assemble weather data, and adventurous expeditions across oceans and ice caps to gather information on past climates.
Most scientists thought a disastrous cooling was unlikely, if only because dust and smog fall out of the atmosphere in weeks, whereas CO2 would linger for centuries. Computer models, improving at the breakneck pace of computing in general, consistently showed warming. With worries about climate change rising, in 1979 the U.S. National Academy of Sciences convened a committee of experts to hash out what could reliably be said. They reached a consensus that when CO2 reached double the pre-industrial level, sometime in the following century, the planet would probably warm up by about 3°C (5.4°F), plus or minus a degree or two.
Earlier scientists had sought a single master-key to climate, but now they were coming to understand that climate is an intricate system responding to a great many influences. Volcanic eruptions and solar variations were still plausible causes of change, and some argued these would swamp any effects of human activities. Even subtle changes in the Earth’s orbit could make a difference. To the surprise of many, studies of ancient climates showed that astronomical cycles had partly set the timing of the ice ages. Apparently the climate was so delicately balanced that almost any small perturbation might set off a large shift. According to the new “chaos” theories, in a complex system a shift might happen suddenly. Support for the idea came from ice cores arduously drilled from the Greenland ice sheet. They showed large and disconcertingly abrupt temperature jumps in the past, on a scale not of centuries but decades.
The improved computer models also began to suggest how such jumps could happen, for example through a change in the circulation of ocean currents. Experts now predicted that global warming could bring not only rising sea levels but unprecedented droughts, storm floods, and other disasters. A few politicians began to suspect there might be a public issue here. However, the modelers had to make many arbitrary assumptions about clouds and the like, and reputable scientists disputed the reliability of the results. Others pointed out how little was known about the way living ecosystems interact with climate and the atmosphere. They argued, for example, over how much CO2 humanity might be adding to the atmosphere through deforestation. One thing the scientists agreed on was the need for still larger and more coherent research programs. But the research remained disorganized, and funding grew only in irregular surges.
One unexpected discovery was that the levels of other “greenhouse gases” such as methane and chlorofluorocarbons were rising explosively. Suddenly scientists found that global warming could come twice as fast as expected — in their children’s lifetimes or even their own.
If there’s one place you can get valid science it’s from the ancient Greeks. One major volcanic eruption such as any one of the 50 that occur every year among the 1,500 known volcanoes can spew more CO2 into the atmosphere than man has made to date. But man is a demon to people like you. I’ve even seen your kind telling us that “depopulation” is the real answer. Of course not white people – mainly those bad feriners.
I have read Arrhenius paper which was in German and he said nothing of the sort. Why do you make such false claims all the time? He performed NO experiments because he didn’t have the time or money to do so. His paper was a thought experiment on why ice ages occurred and he used a paper from another study concerning the spectrum of moonlight. None of this had anything to do with warming.
Don’t give us this “subtle changes in orbit” because the
Milankovitch Cycles are not subtle in the least.
Not only have not one single computer model predicted as little as 5 years into the future accurately but they cannot even be used to tell you what happened 5 years into the past since we have actual data on that.
Rather than go through your endless tirade of ignorance you stated:
“1896
Arrhenius publishes first calculation of global warming from human emissions of CO2. =>Simple models”
In fact he did nothing of the kind. He performed NO experiments to verify his ideas and he said he didn’t have the money to do so. Instead he relied upon Langley’s papers on the spectrum of moonlight taken on the full moon throughout a year. He even applied “reduction values” rather indiscriminately to Langley’s data. In his paper he stated that the temperature of the Moon was nearly the same as the Earth. He also assumed that CO2 was a constant and his experiments actually had more to do with the strange effects of “aqueous vapor” which he could not really understand.
In fact the title of his paper pretty much said it all: “The influence of carbonic acid in the air on the temperature of the ground”. What? No atmospheric heat?
“1920-1925 Milankovitch proposes orbital changes as the cause of ice ages. =>Climate cycles”
This has NOTHING to do with “man-made global warming” And while this is an important effect the only REAL close match between heating and cooling has turned out to be a combination of sunspots and cosmic rays from outer space.
“1965
American Association for the Advancement of Science delivers to President Johnson, Research Report & Warning, with Spot On accurate projections about Climate change for 2015.”
This is a huge F-ing lie. The report SAID: “that within a few years, climate models would be able to reasonably project future global surface temperature changes.”
In fact such projections weren’t made for 10 years and his predictions were as much as 200% off. While NASA states that his END prediction and the present temperatures are equal, the entire temperature data for the LAST 40 years is a blithering lie that doesn’t match the satellite temperature data at all. NASA has even shown huge temperature increases in central Africa where they do not even have weather stations. Dr. Roy Spencer the head of NASA’s weather/Earth temperature satellite program states that there has been no average temperature increases for the last 38 years while NASA has been claiming that there are record temperature years every single year for the last ten years.
In short – you know nothing and never did. You read some True Believer website and then make these rediculous statements without even know what they are.
1.
In 1824 a French scientist had explained that Earth’s temperature would be much lower if the planet lacked an atmosphere,
and
2.
in 1859 an English scientist discovered that the chief gases that trapped heat were water vapor and carbon dioxide (CO2).
3.
In 1896 the Swedish scientist Svante Arrhenius published a new idea.
By burning fossil fuels such as coal, thus adding CO2 to Earth’s atmosphere, humanity would raise the planet’s average temperature.
4.
This “greenhouse effect,” as it later came to be called, was only one of many speculations about climate change, and not the most plausible.
5.
The few scientists who paid attention to Arrhenius used clumsy experiments and rough approximations to argue that our emissions could not change the planet.
* 6.*
Most people thought it was already obvious that puny humanity could never affect the vast global climate cycles, which were governed by a benign “balance of nature.”
7.
In the 1930s, measurements showed that the United States and North Atlantic region had warmed significantly during the previous half-century.
8.
Scientists supposed this was just a phase of some mild natural cycle, probably regional, with unknown causes.
9.
Only one lone voice, the English steam engineer and amateur scientist Guy Stewart Callendar, published arguments that greenhouse warming was underway. If so, he and most others thought it would be beneficial.
9.
In the 1950s, Callendar’s claims provoked a few scientists to look into the question with far better techniques and calculations than earlier generations could have deployed. This research was made possible by a sharp increase of government funding, especially from military agencies that wanted to know more about the weather and geophysics in general. Not only might such knowledge be crucial in future battles, but scientific progress could bring a nation prestige in the Cold War competition. The new studies showed that, contrary to earlier crude assumptions, CO2 might indeed build up in the atmosphere and bring warming. In 1960 painstaking measurements of the level of the gas in the atmosphere by Charles Keeling, a young scientist with an obsession for accuracy, drove home the point. The level was in fact rising year by year.
During the next decade a few scientists worked up simple mathematical models of the planet’s climate system and turned up feedbacks that could make the system surprisingly sensitive. Others figured out ingenious ways to retrieve past temperatures by studying ancient pollen and fossil shells. It appeared that grave climate change could happen, and in the past had happened, within as little as a century or two. This finding was reinforced by more elaborate models of the general circulation of the atmosphere, an offshoot of a government-funded effort to use the new digital computers to predict (and perhaps even deliberately change) the weather. Calculations made in the late 1960s suggested that in the next century, as CO2 built up in the atmosphere, average temperatures would rise a few degrees. But the models were preliminary, and the 21st century seemed far away.
In the early 1970s, the rise of environmentalism raised public doubts about the benefits of any human activity for the planet. Curiosity about climate change turned into anxious concern. A few degrees of warming no longer sounded benign, and as scientists looked into possible impacts they noticed alarming possibilities of rising sea levels and possible damage to agriculture.
Meanwhile a few scientists pointed out that human activity was putting not only CO2 but ever more dust and smog particles into the atmosphere, where they could block sunlight and cool the world. Analysis of Northern Hemisphere weather statistics showed that a cooling trend had begun in the 1940s; was pollution the cause? (Decades later, scientists would confirm that soaring industrial pollution had in fact contributed to temporary Northern Hemisphere cooling.) The public media were confused, sometimes predicting a balmy globe with coastal areas flooded as the ice caps melted, sometimes foreboding a catastrophic new ice age, sometimes quoting expert assurances that nothing much would change. Study panels of scientists, first in the U.S. and then internationally, began to warn that one or another kind of future climate change might pose a severe threat. The main thing scientists agreed on was that they scarcely understood the climate system. The only policy action they recommended was to fund more research to find out what might really happen. Research activity did accelerate using state-of-the-art computers, international programs to assemble weather data, and adventurous expeditions across oceans and ice caps to gather information on past climates.
Most scientists thought a disastrous cooling was unlikely, if only because dust and smog fall out of the atmosphere in weeks, whereas CO2 would linger for centuries. Computer models, improving at the breakneck pace of computing in general, consistently showed warming. With worries about climate change rising, in 1979 the U.S. National Academy of Sciences convened a committee of experts to hash out what could reliably be said. They reached a consensus that when CO2 reached double the pre-industrial level, sometime in the following century, the planet would probably warm up by about 3°C (5.4°F), plus or minus a degree or two.
Earlier scientists had sought a single master-key to climate, but now they were coming to understand that climate is an intricate system responding to a great many influences. Volcanic eruptions and solar variations were still plausible causes of change, and some argued these would swamp any effects of human activities. Even subtle changes in the Earth’s orbit could make a difference. To the surprise of many, studies of ancient climates showed that astronomical cycles had partly set the timing of the ice ages. Apparently the climate was so delicately balanced that almost any small perturbation might set off a large shift. According to the new “chaos” theories, in a complex system a shift might happen suddenly. Support for the idea came from ice cores arduously drilled from the Greenland ice sheet. They showed large and disconcertingly abrupt temperature jumps in the past, on a scale not of centuries but decades.
The improved computer models also began to suggest how such jumps could happen, for example through a change in the circulation of ocean currents. Experts now predicted that global warming could bring not only rising sea levels but unprecedented droughts, storm floods, and other disasters. A few politicians began to suspect there might be a public issue here. However, the modelers had to make many arbitrary assumptions about clouds and the like, and reputable scientists disputed the reliability of the results. Others pointed out how little was known about the way living ecosystems interact with climate and the atmosphere. They argued, for example, over how much CO2 humanity might be adding to the atmosphere through deforestation. One thing the scientists agreed on was the need for still larger and more coherent research programs. But the research remained disorganized, and funding grew only in irregular surges.
One unexpected discovery was that the levels of other “greenhouse gases” such as methane and chlorofluorocarbons were rising explosively. Suddenly scientists found that global warming could come twice as fast as expected — in their children’s lifetimes or even their own. Gathering at a 1985 conference in Austria, climate experts from 29 nations agreed to call on the world’s governments to consider forging international agreements to restrict greenhouse gas emissions. Policy makers ignored the advice, and the public scarcely noticed.
By the late 1970s global temperatures had begun to rise again. Some climate scientists predicted that an unprecedented global warming would become apparent around the year 2000. Their worries finally caught wide public attention in the summer of 1988, the hottest on record till then. Computer modeler James Hansen made headlines when he told a Congressional hearing and journalists that greenhouse warming was almost certainly underway. And a major international meeting of scientists in Toronto called on governments to undertake active steps to cut greenhouse gas emissions.
The response was vehement. Corporations and individuals who opposed all government regulation began to spend millions of dollars on lobbying, advertising, and “reports” that mimicked scientific publications, striving to convince the public that there was no problem at all. Environmental groups, less wealthy but more enthusiastic, helped politicize the issue with urgent cries of alarm. The many scientific uncertainties, and the sheer complexity of climate, made room for limitless debate over what actions, if any, governments should take.
*****
To start in,
for the scientific story,
a good starting-point is the keystone essay on the basic discoveries about The Carbon Dioxide Greenhouse Effect, followed perhaps by attempts to explain changes with Simple Models of Climate.
If you are interested especially in the social connections of climate studies you could start, for example, with the facts of The Modern Temperature Trend and proceed to the long essay on U.S. Government:
The View from Washington, followed by International Cooperation.
For basic information and recent developments, see the page of links and bibliography.
models accuracy
http://4.bp.blogspot.com/-ojp3RLdTlTY/UnKsuZniXcI/AAAAAAAAdHw/gcqmQmPZeyo/s1600/climatemodel.png
CO2 & Temperature Marriage:
https://www.bing.com/images/search?view=detailV2&ccid=%2f%2bt8mfVF&id=8999BA373F3B7B4F391B144E98514B474B7894CF&thid=OIP._-t8mfVFvINxHRaKkITjvAHaFT&mediaurl=http%3a%2f%2fzfacts.com%2fmetaPage%2flib%2fzFacts-CO2-Temp.gif&exph=377&expw=526&q=graph+co2+and+world+temperature+rise&simid=608046613771259242&selectedIndex=0&ajaxhist=0
Even this fake model shows that the temperature increases were much less than predicted.
1. Surface weather station measurements CLEARLY register Warming for over a century !
2. Satellite measurements show that the troposphere is warming
3. The stratosphere is cooling as predicted by anthropogenic global warming theory
(this cannot be explained by solar variability)
4. Temperatures at the ocean surface and at various ocean depths show warming as far down as 3000 meters
5. Sea level rise…at an increasing rate.
6. Gravitometric measurements of Greenland and Antarctica show net ice loss
7. Sea-ice loss in the Arctic is dramatically accelerating
8. Acceleration of glaciers in Greenland and Antarctica, particularly within the last few years.
9. The rise of the tropopause
10. Poleward migration of species
11. Increased intensity of hurricanes as expected from rising sea surface temperatures
12. Accelerating decline of glaciers throughout the world
13. Rise in temperatures at greater depths in the permafrost
14. Rapid expansion of thermokarst lakes throughout parts of Siberia, Canada and Alaska
15. Changes in ocean circulation as predicted by climate models, for example, with temperatures rising more quickly overland
16. Disintegration of permafrost coastlines in the arctic
17. Changes in the altitude of the stratosphere
18. An energy imbalance – the earth is receiving more energy than it emits (Google: Hansen 2005 abstract)
19. Poleward movement of the jet streams (Archer 2008, Seidel 2007, Fu 2006)
20. Widening of the tropical belt (Seidel 2007, Fu 2006)
Note – Some of the evidence listed above are unique to CO2 warming – the carbon “fingerprint”.
.
“Overlooked by modern researchers is the work of Eunice Foote, who,
three years prior to the start of Tyndall’s laboratory research,
conducted similar experiments on absorption of radiant energy by atmospheric gases,
such as CO2 and water vapor. The presentation of her report at a major scientific convention in 1856
was accompanied by postulation that even modest increases in the concentration of CO2 would result in significant atmospheric warming.”
http://www.searchanddiscovery.com/..
“publishes first calculation of global warming from human emissions of CO2”
in stead of dealing with that you go into a RABID RANT based on comments from the Hatefilled Envious of his and our world….attacking….but not relevant to WHAT I QUOTED.
The FACT is Arrhenius was on target and you & yours are still off target today.
More cluttered, disoriented fluff.
So what you’re saying is that you are not an American and don’t want the word out.
No you said that. The article is about the misleading views of Tim Ball and Mark Steyn.
Funny that both Ball and Steyn fit the description “not an American”.
The total number of “scientists” that have signed off on the IPCC latest paper are 2500. As it turns out a large percentage of those are not scientists but politicians. And we’re back down to 600 scientists for and 31,000+ having signed the Oregon Petition.
More intentionally misleading rubbish. The Oregon Petition project — organized and coordinated by conservative ideologue Art Robinson – has been thoroughly debunked. Shameful that you continue to reference it.
If it has been “debunked” then by all means show us where and who has done this.
The Wikipedia entry you’ve quoted does a pretty great job of debunking it. Once again, do you actually read your own references, or you cutting and pasting the cherry-picked quotes of others?
“Robinson asserted in 2008 that the petition has over 31,000 signatories, with 9,000 of these holding a PhD degree.[1] Most signatories with a PhD hold their degree in engineering.” Nothing climate-related
“Approved names on the list included fictional characters from the television show M*A*S*H,[21] the movie Star Wars,[20] Spice Girls group member Geri Halliwell, English naturalist Charles Darwin (d. 1882) and prank names such as “I. C. Ewe”.[22] When questioned about the pop singer during a telephone interview with Joseph Hubert of the Associated Press, Robinson acknowledged that her endorsement and degree in microbiology was inauthentic, remarking “When we’re getting thousands of signatures there’s no way of filtering out a fake”.”
“…although the Petition Project website provides a breakdown of “areas of expertise”, it fails to assort the 0.5% of signatories who claim to have a background in Climatology and Atmospheric Science by name, making independent verification difficult. “This makes an already questionable list seem completely insignificant””
Here is the site of that petition project: http://www.petitionproject.org/signers_by_state_main.php
Please show us these fictional characters.
Contact wikipedia.
I gave you the address of the Oregon Petition. YOU made the claim that there are names from MASH and other TV shows. Prove it or by all means be shown for the lying SOB environmentalist pretender.
You’re welcome to try to “correct” wikipedia. I’m doubting you’ll have any success.
W cited wikipedia, then is complaining about what is says?
Other point’s are the basic logical fallacies of ‘big number to impress’ and falsely ascribed authoritativeness.
31k compared to how many b.s. earned a year in the u.s. much less over a 20 or 40 year career and world wide. It’s a laughably small %, even if all the names were somewhat close to climate related expertise.
Robert – do you mean like “97% of all scientists agree with man-made global warming”?
“Multiple studies published in peer-reviewed scientific journals1 show that 97 percent or more of actively publishing climate scientists agree*”
https://climate.nasa.gov/scientific-consensus/
“Based on the evidence, about 97% of climate experts have concluded that human-caused climate change is happening. What We Know helps us understand the science behind the realities, risks and response to the climate challenge.”
http://whatweknow.aaas.org
There are good reasons why there is such a consensus:nearly two hundred years worth of research which includes every alternative hypothesis. That’s how science works.
Further, there is a body of research showing how interested parties funded the ‘debate’.
So, all that’s really left are conspiracy theories.
WHAT WE KNOW
THE REALITY, RISKS, AND RESPONSE TO CLIMATE CHANGE
The overwhelming evidence of human-caused climate change documents both current impacts with significant costs and extraordinary future risks to society and natural systems. The scientific community has convened conferences, published reports, spoken out at forums and proclaimed, through statements by virtually every national scientific academy and relevant major scientific organization — including the American Association for the Advancement of Science (AAAS) — that climate change puts the well-being of people of all nations at risk. http://whatweknow.aaas.org/get-the-facts/
What’s Really Warming the World? Climate deniers blame natural factors; NASA data proves otherwise
https://www.bloomberg.com/graphics/2015-whats-warming-the-world/
What is climate change? http://www.metoffice.gov.uk/climate-guide
Environment and Climate Change Canada https://www.ec.gc.ca/cc/
European Climate Adaptation Platform (CLIMATE-ADAPT) http://climate-adapt.eea.europa.eu
Cornell Climate Change http://climatechange.cornell.edu
republicEn: Engaging Conservatives https://www.climatechangecommunication.org/republicen/
George Mason University Center for Climate Change Communication https://www.climatechangecommunication.org
EARTH Institute http://earth.columbia.edu/articles/view/2124
And the science condensed :
D.3 Detection and Attribution of Climate Change
Human influence has been detected in warming of the atmosphere and the ocean, in changes in the global water cycle, in reductions in snow and ice, in global mean sea level rise, and in changes in some climate extremes (see Figure SPM.6 and Table SPM.1). This evidence for human influence has grown since AR4. It is extremely likely that human influence has been the dominant cause of the observed warming since the mid-20th century. {10.3–10.6, 10.9}
• It is extremely likely that more than half of the observed increase in global average surface temperature from 1951 to 2010 was caused by the anthropogenic increase in greenhouse gas concentrations and other anthropogenic forcings together. The best estimate of the human-induced contribution to warming is similar to the observed warming over this period. {10.3}
• Greenhouse gases contributed a global mean surface warming likely to be in the range of 0.5°C to 1.3°C over the period 1951 to 2010, with the contributions from other anthropogenic forcings, including the cooling effect of aerosols, likely to be in the range of −0.6°C to 0.1°C. The contribution from natural forcings is likely to be in the range of −0.1°C to 0.1°C, and from natural internal variability is likely to be in the range of −0.1°C to 0.1°C. Together these assessed contributions are consistent with the observed warming of approximately 0.6°C to 0.7°C over this period. {10.3}
• Over every continental region except Antarctica, anthropogenic forcings have likely made a substantial contribution to surface temperature increases since the mid-20th century (see Figure SPM.6). For Antarctica, large observational uncertainties result in low confidence that anthropogenic forcings have contributed to the observed warming averaged over available stations. It is likely that there has been an anthropogenic contribution to the very substantial Arctic warming since the mid-20th century. {2.4, 10.3}
• It is very likely that anthropogenic influence, particularly greenhouse gases and stratospheric ozone depletion, has led to a detectable observed pattern of tropospheric warming and a corresponding cooling in the lower stratosphere since 1961. {2.4, 9.4, 10.3}
• It is very likely that anthropogenic forcings have made a substantial contribution to increases in global upper ocean heat content (0–700 m) observed since the 1970s (see Figure SPM.6). There is evidence for human influence in some individual ocean basins. {3.2, 10.4}
• It is likely that anthropogenic influences have affected the global water cycle since 1960. Anthropogenic influences have contributed to observed increases in atmospheric moisture content in the atmosphere (medium confidence), to global scale changes in precipitation patterns over land (medium confidence), to intensification of heavy precipitation over land regions where data are sufficient (medium confidence), and to changes in surface and sub-surface ocean salinity (very likely). {2.5, 2.6, 3.3, 7.6, 10.3, 10.4}
SPM WG1 AR5
More total and utter rubbish. Out of 4,000 scientists polled 37 said that there definitely was AGW. 2 said that there was definitely NO AGW. The rest said that there was insufficient data to tell one way or the other. They ONLY counted the 39 that made positive statement and even reported THAT percentage incorrectly since they must have been as bright as Robert.
Ah, the Internet expert on returning vets and climate science is also now versed in statistics.
So cocksure, seems you think there is no need to cite what you read.
Which doesn’t even meet 6th grade level academic standards.
“0 points
Created citations which were incomplete or inaccurate, and provided no way to check the validity of the information gathered.”
https://www2.uwstout.edu/content/profdev/rubrics/middlelschresearchrubric.html
Yet, you, an adult, seem to think those rules don’t apply.
Interesting.
Considering that you are not a Vietnam Vet and I have produced several stories about vets being spit on as well as myself I would say you know absolutely nothing about it except you think you are somehow on the moral high ground by producing a book written by a man who wasn’t there.
I am a real scientist and you aren’t. I have the credentials to back it up and you don’t. I understand scientific papers and how to read them and more importantly how to find them and you don’t. YOUR response is to cite a kid’s movie produce by the American Association for the Advancement of Science under Obama in 2014 which is nothing more than a propaganda piece. You always seem to have a tight grasp on the subject.
You want citations when any ass could find them with the first Google search.
https://climatechangedispatch.com/97-articles-refuting-the-97-consensus/
https://www.forbes.com/sites/alexepstein/2015/01/06/97-of-climate-scientists-agree-is-100-wrong/#3d89429b3f9f
http://www.al.com/opinion/index.ssf/2016/03/the_myth_of_the_97_percent_glo.html
http://www.nationalreview.com/article/425232/climate-change-no-its-not-97-percent-consensus-ian-tuttle
You just cannot stop yourself from appearing a moron.
Yes, you’ve “..produced several stories…”. Written decades after the fact, not in agreement with facts on the ground, nor supported by reporting done at the time.
Then you double down making assertions you have no way of supporting, personal attacks,
Then, you’ve also become an expert in climate science. Again with no supportable evidence showing why we should accept your word for either professed expertise or the science. And you double down on that by giving us 4 links to a blog, 2 political and business magazines, and a newspaper opinion piece. As though those are the type of sources scientists would use.
And followed by more unprovable claims. And more insults.
And OPP
https://disqus.com/home/discussion/cfact/decision_looms_in_michael_mann_tim_ball_8220hockey_stick8221_lawsuit/#comment-3672694213
And Hoax https://disqus.com/home/discussion/cfact/decision_looms_in_michael_mann_tim_ball_8220hockey_stick8221_lawsuit/#comment-3672761399
Thanks for showing us what not being able to do a modicum of critical thinking results in.
.
Yeah, everyone that reads this stuff can see your moronic behavior. Those who were there don’t know anything about it and those who weren’t do. You really are one miserable piece of human waste aren’t you?
I have shown you that NONE of your references are anything other than a pack of lies. I have described to you how CO2 not only isn’t a “greenhouse gas” but couldn’t be because of the way thermal energy moves about in the troposphere.
But you without one bit of training can tell us differently. And why have you told us what you meant when you wrote, “I was flying into airbases in ’67”?
Time for you to invent more “facts” that you can’t support.
WHAT WE KNOW
THE REALITY, RISKS, AND RESPONSE TO CLIMATE CHANGE
The overwhelming evidence of human-caused climate change documents both current impacts with significant costs and extraordinary future risks to society and natural systems. The scientific community has convened conferences, published reports, spoken out at forums and proclaimed, through statements by virtually every national scientific academy and relevant major scientific organization — including the American Association for the Advancement of Science (AAAS) — that climate change puts the well-being of people of all nations at risk. http://whatweknow.aaas.org/get-the-facts/
What’s Really Warming the World? Climate deniers blame natural factors; NASA data proves otherwise
https://www.bloomberg.com/graphics/2015-whats-warming-the-world/
What is climate change? http://www.metoffice.gov.uk/climate-guide
Environment and Climate Change Canada https://www.ec.gc.ca/cc/
European Climate Adaptation Platform (CLIMATE-ADAPT) http://climate-adapt.eea.europa.eu
Cornell Climate Change http://climatechange.cornell.edu
republicEn: Engaging Conservatives https://www.climatechangecommunication.org/republicen/
George Mason University Center for Climate Change Communication https://www.climatechangecommunication.org
EARTH Institute http://earth.columbia.edu/articles/view/2124
And the science condensed :
D.3 Detection and Attribution of Climate Change
Human influence has been detected in warming of the atmosphere and the ocean, in changes in the global water cycle, in reductions in snow and ice, in global mean sea level rise, and in changes in some climate extremes (see Figure SPM.6 and Table SPM.1). This evidence for human influence has grown since AR4. It is extremely likely that human influence has been the dominant cause of the observed warming since the mid-20th century. {10.3–10.6, 10.9}
• It is extremely likely that more than half of the observed increase in global average surface temperature from 1951 to 2010 was caused by the anthropogenic increase in greenhouse gas concentrations and other anthropogenic forcings together. The best estimate of the human-induced contribution to warming is similar to the observed warming over this period. {10.3}
• Greenhouse gases contributed a global mean surface warming likely to be in the range of 0.5°C to 1.3°C over the period 1951 to 2010, with the contributions from other anthropogenic forcings, including the cooling effect of aerosols, likely to be in the range of −0.6°C to 0.1°C. The contribution from natural forcings is likely to be in the range of −0.1°C to 0.1°C, and from natural internal variability is likely to be in the range of −0.1°C to 0.1°C. Together these assessed contributions are consistent with the observed warming of approximately 0.6°C to 0.7°C over this period. {10.3}
• Over every continental region except Antarctica, anthropogenic forcings have likely made a substantial contribution to surface temperature increases since the mid-20th century (see Figure SPM.6). For Antarctica, large observational uncertainties result in low confidence that anthropogenic forcings have contributed to the observed warming averaged over available stations. It is likely that there has been an anthropogenic contribution to the very substantial Arctic warming since the mid-20th century. {2.4, 10.3}
• It is very likely that anthropogenic influence, particularly greenhouse gases and stratospheric ozone depletion, has led to a detectable observed pattern of tropospheric warming and a corresponding cooling in the lower stratosphere since 1961. {2.4, 9.4, 10.3}
• It is very likely that anthropogenic forcings have made a substantial contribution to increases in global upper ocean heat content (0–700 m) observed since the 1970s (see Figure SPM.6). There is evidence for human influence in some individual ocean basins. {3.2, 10.4}
• It is likely that anthropogenic influences have affected the global water cycle since 1960. Anthropogenic influences have contributed to observed increases in atmospheric moisture content in the atmosphere (medium confidence), to global scale changes in precipitation patterns over land (medium confidence), to intensification of heavy precipitation over land regions where data are sufficient (medium confidence), and to changes in surface and sub-surface ocean salinity (very likely). {2.5, 2.6, 3.3, 7.6, 10.3, 10.4}
SPM WG1 AR5
https://www.youtube.com/watch?v=DJBDI7jVMqM
Thanks !
A ten yr old movie starring several personages who haven’t been publishing in the field certainly corrects the record.
/’s
But does do a grand job of displaying an inability to use 6th grade tools for determining the quality of a resource.
C.R.A.A.P. TEST
Currency: the timeliness of the information
When was the information published or posted?
Has the information been revised or updated?
Is the information current or out-of date for your topic?
Are the links functional?
Relevance: the importance of the information for your needs
Does the information relate to your topic or answer your question?
Who is the intended audience?
Is the information at an appropriate level (i.e. not too elementary or advanced for your needs)?
Have you looked at a variety of sources before determining this is one you will use?
Would you be comfortable using this source for a research paper?
Authority: the source of the information
Who is the author/publisher/source/sponsor?
Are the author’s credentials or organizational affiliations given?
What are the author’s credentials or organizational affiliations given?
What are the author’s qualifications to write on the topic?
Is there contact information, such as a publisher or e-mail address?
Does the URL reveal anything about the author or source?
examples: .com (commercial), .edu (educational), .gov (U.S. government),
.org (nonprofit organization), or .net (network)
Accuracy: the reliability, truthfulness, and correctness of the content, and
Where does the information come from?
Is the information supported by evidence?
Has the information been reviewed or refereed?
Can you verify any of the information in another source or from personal knowledge?
Does the language or tone seem biased and free of emotion?
Are there spelling, grammar, or other typographical errors?
Purpose: the reason the information exists
What is the purpose of the information? to inform? teach? sell? entertain? persuade?
Do the authors/sponsors make their intentions or purpose clear?
Is the information fact? opinion? propaganda?
Does the point of view appear objective and impartial?
Are there political, ideological, cultural, religious, institutional, or personal biases?
http://libguides.library.ncat.edu/content_mobile.php?pid=53820&sid=394505#box_394505
Here’s a couple of simple worksheets to print out to help:
http://libraryguides.ccbcmd.edu/ld.php?content_id=14159298
http://www.juniata.edu/services/library/instruction/handouts/craap_worksheet.pdf
Somewhat odd the best copy you brought forward looks like something done with a cellphone pointed at a TV screen with subtitles.
(minor edit to note age of movie that is supposed to be the greatest ever proof that that only denialists think they know ‘the truth’ )
What YOU know is nothing. Your he-said she-said knowledge without any education is pretty funny.
When the court reconvenes you can say all you like about their judgement.
http://notrickszone.com/2018/01/01/150-non-global-warming-graphs-from-2017-pummel-claims-of-unusual-modern-warmth/#sthash.xOMSjuoT.x0FtGL4O.dpbs
Well, obviously, it’s not me, it’s the we –
WHAT WE KNOW
THE REALITY, RISKS, AND RESPONSE TO CLIMATE CHANGE
The overwhelming evidence of human-caused climate change documents both current impacts with significant costs and extraordinary future risks to society and natural systems. The scientific community has convened conferences, published reports, spoken out at forums and proclaimed, through statements by virtually every national scientific academy and relevant major scientific organization — including the American Association for the Advancement of Science (AAAS) — that climate change puts the well-being of people of all nations at risk. http://whatweknow.aaas.org/get-the-facts/
https://www.thegwpf.org/content/uploads/2016/10/PeerReview.pdf
Thanks for your continuing demonstration of an inability to find reputable sources.
Here’s a guide to assist your further endeavors :
C.R.A.A.P. TEST
Currency: the timeliness of the information
When was the information published or posted?
Has the information been revised or updated?
Is the information current or out-of date for your topic?
Are the links functional?
Relevance: the importance of the information for your needs
Does the information relate to your topic or answer your question?
Who is the intended audience?
Is the information at an appropriate level (i.e. not too elementary or advanced for your needs)?
Have you looked at a variety of sources before determining this is one you will use?
Would you be comfortable using this source for a research paper?
Authority: the source of the information
Who is the author/publisher/source/sponsor?
Are the author’s credentials or organizational affiliations given?
What are the author’s credentials or organizational affiliations given?
What are the author’s qualifications to write on the topic?
Is there contact information, such as a publisher or e-mail address?
Does the URL reveal anything about the author or source?
examples: .com (commercial), .edu (educational), .gov (U.S. government),
.org (nonprofit organization), or .net (network)
Accuracy: the reliability, truthfulness, and correctness of the content, and
Where does the information come from?
Is the information supported by evidence?
Has the information been reviewed or refereed?
Can you verify any of the information in another source or from personal knowledge?
Does the language or tone seem biased and free of emotion?
Are there spelling, grammar, or other typographical errors?
Purpose: the reason the information exists
What is the purpose of the information? to inform? teach? sell? entertain? persuade?
Do the authors/sponsors make their intentions or purpose clear?
Is the information fact? opinion? propaganda?
Does the point of view appear objective and impartial?
Are there political, ideological, cultural, religious, institutional, or personal biases?
http://libguides.library.ncat.edu/content_mobile.php?pid=53820&sid=394505#box_394505
“The likely range of the human contribution to the global mean temperature increase over the period 1951–2010 is 1.1° to 1.4°F (0.6° to 0.8°C), and the central estimate of the observed warming of 1.2°F (0.65°C) lies within this range (high confidence). This translates to a likely human contribution of 92%–123% of the observed 1951–2010 change. The likely contributions of natural forcing and internal variability to global temperature change over that period are minor (high confidence). (Ch. 3; Fig. ES.2)”
USGCRP, 2017: Climate Science Special Report: Fourth National Climate Assessment, Volume I [Wuebbles, D.J., D.W. Fahey, K.A. Hibbard, D.J. Dokken, B.C. Stewart, and T.K. Maycock (eds.)]. U.S. Global Change Research Program, Washington, DC, USA, 470 pp., doi: 10.7930/J0J964J6.
https://nofrakkingconsensus.files.wordpress.com/2011/10/delinquentteenager_sample.pdf
“I have shown you that NONE of your references are anything ..”
“…one miserable piece of human waste…”
“..you without one bit of training can tell us differently…”
“While you are talking about “tropes” I find that extremely interesting since the use of that word became popular among hippies. ”
“..drug using hippy grandparents..”
“..liberal line that “we’ve always been the good people, even when we were hanging niggers and Republicans” ”
” True Believers in the Church of Global Warming. ”
You are continuing to confuse agenda driven letters written in the late 1980s with reporting done at the time.
You also confuse invective , insulting, scare quotes, & irrational claims w no corroborating evidence with forming coherent arguments with supporting data.
C.R.A.A.P. TEST
Currency: the timeliness of the information
When was the information published or posted?
Has the information been revised or updated?
Is the information current or out-of date for your topic?
Are the links functional?
Relevance: the importance of the information for your needs
Does the information relate to your topic or answer your question?
Who is the intended audience?
Is the information at an appropriate level (i.e. not too elementary or advanced for your needs)?
Have you looked at a variety of sources before determining this is one you will use?
Would you be comfortable using this source for a research paper?
Authority: the source of the information
Who is the author/publisher/source/sponsor?
Are the author’s credentials or organizational affiliations given?
What are the author’s credentials or organizational affiliations given?
What are the author’s qualifications to write on the topic?
Is there contact information, such as a publisher or e-mail address?
Does the URL reveal anything about the author or source?
examples: .com (commercial), .edu (educational), .gov (U.S. government),
.org (nonprofit organization), or .net (network)
Accuracy: the reliability, truthfulness, and correctness of the content, and
Where does the information come from?
Is the information supported by evidence?
Has the information been reviewed or refereed?
Can you verify any of the information in another source or from personal knowledge?
Does the language or tone seem biased and free of emotion?
Are there spelling, grammar, or other typographical errors?
Purpose: the reason the information exists
What is the purpose of the information? to inform? teach? sell? entertain? persuade?
Do the authors/sponsors make their intentions or purpose clear?
Is the information fact? opinion? propaganda?
Does the point of view appear objective and impartial?
Are there political, ideological, cultural, religious, institutional, or personal biases?
http://libguides.library.ncat.edu/content_mobile.php?pid=53820&sid=394505#box_394505
Here’s a couple of simple worksheets to print out to help:
http://libraryguides.ccbcmd.edu/ld.php?content_id=14159298
http://www.juniata.edu/services/library/instruction/handouts/craap_worksheet.pdf
I’m still waiting for you to produce some explanation of your “flying into airbases in ’67”. You seem to be avoiding that. Why is that?
It is pretty funny that you’re pretending to know things that you so obviously are ignorant of. I really like your claim that the people that were there don’t know what happened but teenagers now do.
I’ve not bothered as you set up your own analysis and assertions which were so laughable as to not need comment.
But, to simplify, my experience matches that of the the source I quoted.
You’ve chosen to rely on anecdotal reminisces written decades after the fact rather than research based on primary documents.
You spending a lot of effort trying to argue a point that didn’t support your main point, which is that the climate science analysis isn’t an accurate representation of what is observed seem pretty consistent, though.
LTJ – I will ask you again – WHERE DO YOU GET A DEGREE IN “CLIMATE SCIENCE”? What University has such courses?
Is your googling finger still in a splint?
Meaning you haven’t any idea at all. Well, the fact is that “climate scientists” are self proclaimed. There are so many different sciences involved in “climate science” that no one can know more than tiny percentages of the workings of a system that has carried itself from everything from the birth of life that changed the atmosphere from 60% Nitrogen and 39% CO2 to the carbon reduction from life to our present 60% Nitrogen and 39% Oxygen. In other words – the atmospheric chemistry changed so violently that the pretense that trace gases could have any significant effect is preposterous.
From continental motions that had all of the land area in one super-continent on several occasions to many continents walking about all over the globe. From an asteroid collisions with the Earth so violent that it destroyed almost the entire reptile species to today where CO2 had reduced to the point where photosynthesis was about to cease, giving us another extinction event. The continental motions gave us such extreme conditions that we can’t even guess though a reasonable estimate would be +1298 F in the region of the Chixculub impact site to the massive global cooling that killed even the water borne dinosaurs in the oceans.
That someone as puny as Dr. Michael Mann could think that he could predict anything including what he is going to have for dinner tomorrow is pretty funny.
The release of stored carbon in the form of fossil fuels has done nothing for this planet but improve conditions. More people are living better than ever before not only because of having access to more energy but to the improved plant growth from increased CO2 is now feeding more people than existed on this planet just 10 years ago.
You as a liberal should be telling us that we should stop allowing third world countries to develop. To refuse them the right to energy, food and water. What your kind have always referred to as “Ethical Depopulation”. Murder multimillions for fear that they might impact your lifestyle despite every fact to the contrary.
Or as another of your liberal cohorts said, “We don’t want the word to go out that we want to exterminate the Negro population so we must enlist the pastors to convince them otherwise.”
Your kind of liberal.
You’re kind of stupid. A special kind, at that.
http://www.mastersportal.eu/study-options/269779069/climate-studies-meteorology-united-states.html
https://www.bachelorsportal.com/study-options/268927101/climate-studies-meteorology-united-kingdom.html
https://www.bachelorsportal.com/study-options/269779069/climate-studies-meteorology-united-states.html
http://hub.globalccsinstitute.com/insights/top-10-universities-study-climate-change
https://www.masterstudies.com/MSc/Climate-Change/
http://www.sciencemag.org/careers/2009/11/careers-climate-change-research-feature-index
And just in case you’d like to be a little less special: http://www.open.edu/openlearn/nature-environment/the-environment/climate-change/content-section-0
Well done! Amazing how well so many climate science deniers have swallowed the codswallop to the point where they don’t even bother to check the veracity of what their blogs tell them.
And that’s with being in front of a device that can render results researchers 20 years ago would have had to go to a library and root through shelves of information to find the answer.
I particularly like the one that is a degree is social sciences so that you know how to convince people of a false premise.
One would expect that if someone were going to use examples they would at least bother to read them to discover that they’re pure BS. But then bloodsuckers usually don’t have anything other than sucking on their mind.
That’s all you’ve got? Insignificant nitpicking and more off-target insults?
My work here may be done.
https://nofrakkingconsensus.files.wordpress.com/2011/10/delinquentteenager_sample.pdf
Turns out you’ve pulled more “facts” out of your Depends again.
Pretty funny that you are attempting to disqualify extremely high level scientists by saying it was organized by someone you don’t like. Let’s see what happens to Mann. Then most of the people here will laugh in your face. Then you can tell us that the judge was an ideologue.
Organized by Art Robinson of the Oregon Institute of Science and Medicine…an organization that is one based on ideology not science. Go look it up yourself and apply some basic critical thinking. Its silly “Journal” of American Physicians and Surgeons masquerades as a scientific journal but is nothing of the sort…Listed by Quackwatch as unreliable and untrustworthy…a purveyor of utter nonsense.
Top class, thanks.
Perhaps you can become President Trump’s science adviser since he doesn’t seem to be able to understand the papers written that show that NASA purposely and with aforethought manufactured false data. This was proven by simple mathematical analysis and the paper was peer reviewed. Because of this false data NO statement by any organization that used that data is reliable. And ALL of your quoted organizations used the NASA counterfeit data.
https://thsresearch.files.wordpress.com/2017/05/ef-gast-data-research-report-062717.pdf
From your screaming and crying defense of global warming I don’t expect you to have sufficient mathematical ability to make proper change for a dollar, but you can show it to someone in your family that does.
My dear Wake – you have been shown this unscientific paper residing at a blog site is nonsense at least three times by three separate people. Why do you persist in claiming that it is peer-reviewed and in some way credible?
Move along. Find a new argument – because you’re losing face each time you come back with this one.
I love it when you would like to “disprove” a scientific study by quoting a political site. That’s almost as funny as you making up entire things I was supposed to have said. I have worked directly in science for over 40 years and your qualifications are that you read DeSmogBlog which is the weirdest bunch I’ve ever seen outside of a zoo.
Perhaps you have an example of one of these things you’re claiming l’ve made up?
More intentionally misleading rubbish. You provided a single link to an unpublished paper written by well known contrarians, posted to the silly, amateurish ‘tropical hot spot research’ website. No it is not peer-reviewed, published research, and regardless, it does not demonstrate that NASA purposefully manufactured false data.
How is it that YOU know what the positions of these institutions are? All of them use the temperature data from NASA which was falsified. No research that has used that data is reliable. No claims based on those numbers are true.
AND IF IT does NOT goose step to YOUR ideological certainty…it must be faked and fiddled with.
and
research team after research team have tried to prove THAT PREMISE, THAT truly asinine accusation
((( …and ALL have FAILED )))
….trying to grasp the immeasurable notoriety and wealth proving the accusation accurate
………..instead they ALL added to the credibility of GLOBAL WARMING SCIENCE….
BUT still you use this meaningless crutch to sustain your DENIAL !
Temperature DATA is fudged, fiddled with…manipulated !
WHAT ? Ground based Digital Data from 155 different nations
is fudged ?
World Newspapers and Media giants (SEEKING TO MAKE A LOT OF HEADLINES AND A LOT OF MONEY…proving NOAA & NASA fudged the data)))
along with private investigators.
…………………..****..found over 30,000 privately
owned and operated
DIGITAL GROUND WEATHER STATIONS
Outside nearly EVERY city and town on Earth…..
Farm Bureaus and Coops,
Trucking Companies, Bus Companies,
Ocean Shipping companies, corporate farms,
free ports and Unaffiliated air fields,
monasteries, wineries…
..
tens of millions of data sets per year……
most going back over 20 years.
………….and when the math is ALL done
.
((not models for you to fixate and ventilate about))
.
the math…….down to .01 degree of NASA’s and NOAA’s figures
…..after all of your wasted spittle and exasperated exhales of CO2
………YOUR CLAIMS WERE WRONG !
That is why the Scientific community has PEER REVIEW
…mandatory PUBLICATION IN SCIENTIFIC JOURNALS
…..and required REPLICATION before any hypothesis is more widely accepted.
…..
What absolute BALDERDASH !
TRUE RELIGIOUS IDEOLOGICAL IDIOCY !
The line of empirical evidence that humans
are causing global warming is as follows:
.
We’re raising CO2 levels
.
Human carbon dioxide emissions are calculated
from international energy statistics, tabulating coal, brown coal,
peat, and crude oil production by nation and year, going back to 1751.
.
CO2 emissions have increased dramatically over the last century,
climbing to the rate of 29 billion tonnes of CO2 per year in 2006 (EIA).
.
Atmospheric CO2 levels are measured at hundreds of
monitoring stations across the globe.
.
Independent measurements are also conducted by airplanes and satellites.
For periods before 1958, CO2 levels are determined from air bubbles trapped in polar ice cores.
In pre-industrial times over the last 10,000 years,
CO2 was relatively stable at around 180-to-280 parts per million.
.
Over the last 250 years, atmospheric CO2 levels have increased
by about 100 parts per million.
.
Humans are emitting more than twice as much CO2 as what ends up staying there.
Nature is reducing our impact on climate by absorbing
more than half of our CO2 emissions.
.
The amount of human CO2 left in the air, called the “airborne fraction”,
has hovered around 43% since 1958.
CO2 traps heat
.
According to radiative physics and decades of laboratory measurements,
increased CO2 in the atmosphere is expected/predicted to absorb
more infrared radiation as it escapes back out to space.
Human / Industry is producing 135 TIMES MORE CO2
than ALL of EARTH’s Volcanoes Combined….every year !
..
Leading
Scientists
Questioned
Green House Gas effects in our atmosphere:
So,
In 1970,
NASA launched the IRIS satellite measuring infrared spectra.
.
Google: Iris Satellite Research Abstract
.
In 1996,
the Japanese Space Agency launched the IMG satellite
which recorded similar observations.
Google: IMG Satellite Research Abstract
.
Both sets of data were compared to discern any changes
in escaping radiation levels over the 26 year period
Google (Harries 2001 research abstract)
.
What they found was a drop in Escaping Infra Red radiation
at the PRECISE wavelength bands that greenhouse gases
such as CO2 with H2O, CFC’s, Ozone,
Nitrous Oxides, and methane (CH4) absorb energy.
The change in DECREASE IN ESCAPING I.R. radiation was consistent
with theoretical Expectations / Predictions.
.
This research & paper found
“direct experimental evidence for a significant increase
in the Earth’s greenhouse effect” and Warming on Earth.
.
This result has been confirmed by subsequent research & papers
using data from later satellites
Google (Griggs 2004 Research Abstract)
Google (Chen 2007 Research Astract )
.
Figure 2: Change in spectrum from 1970 to 1996 due to trace gases.
‘Brightness temperature’ indicates equivalent blackbody temperature
Google (Harries 2001 Research Abstract)
When greenhouse gases absorb infrared radiation,
the energy heats the atmosphere which in turn
re-radiates infrared radiation in all directions.
.
Some makes its way back to the earth’s surface.
Hence
we Expect/Predict to find more infrared radiation heading downwards.
.
Surface measurements from 1973 to 2008 find an increasing trend
of infrared radiation returning to earth
Google (Wang 2009 Research Abstract)
.
A regional study over the central Alps found that
downward infrared radiation is increasing due to the
enhanced greenhouse effect
.
Google (Philipona 2004 research abstract).
.
Taking this a step further, an analysis of high resolution spectral data
allowed scientists to quantitatively attribute the increase in
downward radiation to each of several greenhouse gases
.
Google (Evans 2006 Research abstract)
.
The results lead the authors to conclude that
*
*** “this experimental data should effectively end the argument by skeptics
that no experimental evidence exists for the connection between
greenhouse gas increases in the atmosphere and Climate Changes caused
by global warming.”
.
Figure 3:
Spectrum of the greenhouse radiation measured at the surface.
Greenhouse effect from water vapor is filtered out,
showing the contributions of other greenhouse gases
Google (Evans 2006 Research Abstract)
.
This Entire planet is accumulating heat
.
When there is more energy coming in than escaping back out to space,
our climate accumulates heat.
.
The planet’s total heat buildup can be derived by
adding up the heat content from the ocean, atmosphere,
land and ice.
.
Google (Murphy 2009 Research abstract)
.
Ocean heat content was determined down to 3000 metres deep.
Atmospheric heat content was calculated from the surface temperature record
and heat capacity of the troposphere.
Land and ice heat content (eg – the energy required to melt ice)
were also included.
.
Figure 4:
Total Earth Heat Content from 1950
.
Google (Murphy 2009 Research Abstract)
.
Ocean data taken from Domingues et al 2008.
.
From 1970 to 2003, the planet has been accumulating heat at a
rate of 190,260 gigawatts
with the vast majority of the energy going into the oceans.
Considering a typical nuclear power plant has an output of 1 gigawatt,
imagine 190,000 nuclear power plants
pouring their energy output directly into our oceans.
What about after 2003?
.
A map of of ocean heat from 2003 to 2008 was constructed
from ocean heat measurements down to 2000 metres deep
.
Google (von Schuckmann 2009).
Globally, the oceans have continued to accumulate heat
to the end of 2008 at a rate of 0.77 ± 0.11 Wm?2,
consistent with other determinations of
the planet’s energy imbalance (Hansen 2005, Trenberth 2009).
The planet continues to accumulate heat.
.
Figure 5: Time series of global mean heat storage (0–2000 m), measured in 108 Jm-2.
.
So we see a direct line of evidence that we’re causing global warming.
Human CO2 emissions far outstrip the rise in CO2 levels.
The enhanced greenhouse effect is confirmed
by satellite and surface measurements.
The planet’s energy imbalance is confirmed by summations of the
planet’s total heat content and ocean heat measurements.
Figure 2: Change in spectrum from 1970 to 1996 due to trace gases.
‘Brightness temperature’ indicates equivalent blackbody temperature
Google (Harries 2001 Research Abstract)
When greenhouse gases absorb infrared radiation,
the energy heats the atmosphere which in turn
re-radiates infrared radiation in all directions.
.
Some makes its way back to the earth’s surface.
Hence we expect to find more infrared radiation heading downwards.
.
Surface measurements from 1973 to 2008 find an increasing trend
of infrared radiation returning to earth
Google (Wang 2009 Research Abstract)
.
A regional study over the central Alps found that
downward infrared radiation is increasing due to the enhanced greenhouse effect
.
Google (Philipona 2004 research abstract).
.
Taking this a step further, an analysis of high resolution spectral data
allowed scientists to quantitatively attribute the increase in
downward radiation to each of several greenhouse gases
.
Google (Evans 2006 Research abstract)
.
The results lead the Research authors to conclude that
**** “this experimental data should effectively end the argument by skeptics
that no experimental evidence exists for the connection between
greenhouse gas increases in the atmosphere and global warming.”
.
Figure 3:
Spectrum of the greenhouse radiation measured at the surface.
Greenhouse effect from water vapor is filtered out,
showing the contributions of other greenhouse gases
Google (Evans 2006 Research Abstract)
.
The planet is accumulating heat
You are getting tiresome Kooi – CO2 has nothing whatsoever to do with the atmosphere retaining heat. The only real source is H2O in its three phases which is on a world wide average 100 times more common than CO2. And on a real comparison – power generators are distributed around cities and most of the world’s cities are on waterways meaning that the relative humidity is more like 40% around where CO2 is being generated. Man’s addition to the NATURAL production and destruction of CO2 is only 25% and CO2 is a trace gas to begin with. Furthermore CO2 has only THREE very narrow absorption bands and only ONE of them is available to absorb energy. And that band had absorbed every single joule with CO2 levels at between 200-250 ppm. You can worship at the altar of Man-Made Global Warming if you like but don’t try to tell thinking individuals about things you know nothing about.
Leading
Scientists
Questioned
Green House Gas effects in our atmosphere:
So,
In 1970,
NASA launched the IRIS satellite measuring infrared spectra.
.
***********Google: ********Iris Satellite Research Abstract
.
In 1996,
the Japanese Space Agency launched the IMG satellite
which recorded similar observations.
.
***********Google: ********IMG Satellite Research Abstract
.
Both sets of data were compared to discern any changes
in escaping radiation levels over the 26 year period
.
***********Google ********(Harries 2001 research abstract)
.
What they found was a drop in Escaping Infra Red radiation
at the PRECISE wavelength bands that greenhouse gases
such as CO2 with H2O, CFC’s, Ozone,
Nitrous Oxides, and methane (CH4) absorb energy.
The change in DECREASE IN ESCAPING I.R. radiation was consistent with theoretical Expectations / Predictions.
.
This research & paper found
“direct experimental evidence for a significant increase
in the Earth’s greenhouse effect” and Warming on Earth.
.
This result has been confirmed by subsequent research & papers
using data from later satellites
.
***********Google ********(Griggs 2004 Research Abstract)
***********Google ******** (Chen 2007 Research Astract )
Is there something that prevents you from understanding what I wrote? “And that band had absorbed every single joule with CO2 levels at between 200-250 ppm.” Imagine that – they found missing wavelengths.
Where is this satellite data that shows some sort of decreasing radiation with increasing CO2?
Had you actually taken those University Courses you claimed to have taken, you would have seen the Studies.
“Leading
Scientists
Questioned
Green House Gas effects in our atmosphere:
So,
In 1970,
NASA launched the IRIS satellite measuring infrared spectra.
.
Google: Iris Satellite Research Abstract
.
In 1996,
the Japanese Space Agency launched the IMG satellite
which recorded similar observations.
Google: IMG Satellite Research Abstract
.
Both sets of data were compared to discern any changes
in escaping radiation levels over the 26 year period
Google (Harries 2001 research abstract)
.
What they found was a drop in Escaping Infra Red radiation
at the PRECISE wavelength bands that greenhouse gases
such as CO2 with H2O, CFC’s, Ozone,
Nitrous Oxides, and methane (CH4) absorb energy.
The change in DECREASE IN ESCAPING I.R. radiation was consistent
with theoretical Expectations / Predictions.
.
This research & paper found
“direct experimental evidence for a significant increase
in the Earth’s greenhouse effect” and Warming on Earth.
.
This result has been confirmed by subsequent research & papers
using data from later satellites
Google (Griggs 2004 Research Abstract)
Google (Chen 2007 Research Astract )
.
Figure 2: Change in spectrum from 1970 to 1996 due to trace gases.
‘Brightness temperature’ indicates equivalent blackbody temperature
Google (Harries 2001 Research Abstract)
When greenhouse gases absorb infrared radiation,
the energy heats the atmosphere which in turn
re-radiates infrared radiation in all directions.
.
Some makes its way back to the earth’s surface.
Hence
we Expect/Predict to find more infrared radiation heading downwards.
.
Surface measurements from 1973 to 2008 find an increasing trend
of infrared radiation returning to earth
Google (Wang 2009 Research Abstract)
.
A regional study over the central Alps found that
downward infrared radiation is increasing due to the
enhanced greenhouse effect
.
Google (Philipona 2004 research abstract).
.
Taking this a step further, an analysis of high resolution spectral data
allowed scientists to quantitatively attribute the increase in
downward radiation to each of several greenhouse gases
.
Google (Evans 2006 Research abstract)
.
The results lead the authors to conclude that
*
*** “this experimental data should effectively end the argument by skeptics
that no experimental evidence exists for the connection between
greenhouse gas increases in the atmosphere and Climate Changes caused
by global warming.”
.
Figure 3:
Spectrum of the greenhouse radiation measured at the surface.
Greenhouse effect from water vapor is filtered out,
showing the contributions of other greenhouse gases
Google (Evans 2006 Research Abstract)
.
This Entire planet is accumulating heat
.
When there is more energy coming in than escaping back out to space,
our climate accumulates heat.
.
The planet’s total heat buildup can be derived by
adding up the heat content from the ocean, atmosphere,
land and ice.
.
Google (Murphy 2009 Research abstract)
.
Ocean heat content was determined down to 3000 metres deep.
Atmospheric heat content was calculated from the surface temperature record
and heat capacity of the troposphere.
Land and ice heat content (eg – the energy required to melt ice)
were also included.
.
Figure 4:
Total Earth Heat Content from 1950
.
Google (Murphy 2009 Research Abstract)
.
Ocean data taken from Domingues et al 2008.
.
OK, I want to know what “University Courses” I have claimed to have taken. I want to know WHY you are spreading false data? I want to know why you are attempting to spread lies about me?
So what NASA launch IRIS so what is your point?
A bit about kooki Rick’s flagrant abuse of sanity. NASA launched, not IRIS satellite, but the IRIS instrument, aboard the NIMBUS 6 satellite … Sheesh, he doesn’t know the difference between a spectrometer and a satellite that holds the spectrometer … Anyhow, IRIS recorded some … not all, but some of the infrared spectrum that we care about. The infrared spectra, of concern, the far infrared, is 100/cm to 650/cm, 15㎛ to 100㎛.
The IRIS “saw” 400/cm [25㎛] 1600/cm [6¼㎛]. Nimbus -6 IRIS misses these far infrared wavelengths, 25㎛ to 100㎛, wavenumbers 100/cm to 400/cm.
The IMG instrument that was carried aboard the Japan ADEOS-1 satellite, was sensitive to 600/cm [16㎛] to 3000/cm [3㎛], missing from 600/cm to 100/cm, or from 16㎛ to 100㎛ in wavelength.
Each of the ≈9-month intervals is not a “climate-length” observation… and doesn’t include a full annual cycle, or even compatible segments of the sampled annual cycles. The IMG instrument looked down from October-June, and the IRIS, April to January. Furthermore, the were about 27 years apart.
Harries 2001 makes unsubstantiated claims.
Harries, John E., et al. 2001 “Increases in greenhouse forcing inferred from the outgoing longwave radiation spectra of the Earth in 1970 and 1997.” Nature
https://www.researchgate.net/profile/John_Harries/publication/12065270_Increases_in_greenhouse_forcing_inferred_from_the_outgoing_longwave_radiation_spectra_of_the_Earth_in_1970_and_1997/links/02e7e5360e06d47ed4000000/Increases-in-greenhouse-forcing-inferred-from-the-outgoing-longwave-radiation-spectra-of-the-Earth-in-1970-and-1997.pdf
They have test flown an instrument that will fly in low-earth orbit. They will only last months in these orbits so the plan is to launch new ones when required. These devices (damn my concussion ravaged memory can’r remember their name – CRAK?) consist of a silicon wafer with layers of silicon grown to the wavelengths under discussion. This makes these devices an almost perfect blackbody in the low IR. This will make the measurement of radiation from the Earth accurate to almost totality.
Where does all this IR radiation come from?
IT’s Magic to an IDEOLOGUE who hid behind the School Room door….Sophomore, High School.
Low Energy Short Wave Infra Red Radiation is an Earth Emission..
..
AFTER HEAT BUILDS UP from incoming SOLAR LONG WAVE RADIATION….which crosses the Atmosphere as if it were invisible…and enters our Earth system.
Low Energy I.R. Radiation is very reactive to atmospheric gasses.
H2O
CO2
Methane
Ozone
Nitrous Oxide
Cfc
Hfc
Pfc
Wrong again short wave length is high energy photons. Long wave has much less energy. Where does this IR come from?
There is almost much energy on average radiated in IR at the TOA as there is absorbed in shortwave from the Sun, save for the ongoing energy imbalance and consequent warming.
The IR is radiated according to the temperature of the surface and from IR active gas species in the atmosphere.
Wrong again. IR is produced as it passes through the molecules of the atmosphere. Every time a photon passes through a gas molecule, the photon loses energy and it’s wave length gets longer. Remember it’s UV that gives the sun burn not IR.
LOL. Seems you have zero understanding of science. Fancy that.
Not zero. But he doesn’t understand heat transfer through conduction and radiation perfectly. Sunlight emissions are in the 350 nm to 800 or so nm region. O2 absorbs in a wide spectrum around 250 nm and N2 around 300 nm. CO2 is in the lower IR but as a trace gas it isn’t worth speaking about.
So sunlight strikes the Earth after losing about half if its strength from reflection and atmospheric absorption almost entirely from H2O. This is converted from high energy light to lower energy IR though the mass of Earth – 70% of which is oceans or lakes and 30% ground with higher density per unit of volume.
The Earth is a pretty well kept environment and man has little to no ability to effect anything other than purely local conditions.
no !
LOL. Seems you also have zero understanding of science. Fancy that.
Where do you think all that IR comes from. It doesn’t come from the Sun. Fancy that who really has zero understanding Science.
Photons do not lose energy and change wavelength Charles.
They are either wholly absorbed or not. Their specific energy being related to the necessary quantized energy related to a change in physical state, be it molecular vibrational state or promotion of an electron to a higher energy orbital state.
The IR comes from the bulk temperature of the atmosphere.
It appears that you are trying to claim that downwelling IR results the Suns energy that changes wavelength on the way to the surface.
Given that the atmosphere radiates more energy to the surface than that received from the Sun, you describe a physical impossibility. Quite an achievement. Bravo!
You should take a Physics class. Then you would know as much about photons as I do. According to you the photon gives up no energy yet can increase the energy state of a molecule or atom. I guess we don’t need the sun if we believe you.
Charles – look at this: https://en.wikipedia.org/wiki/Earth%27s_energy_budget#/media/File:The-NASA-Earth%27s-Energy-Budget-Poster-Radiant-Energy-System-satellite-infrared-radiation-fluxes.jpg
While this is not completely accurate it is more accurate than your idea. Photons do not “pass through” molecules on their way to the ground and lose energy.
A high energy photon is so close to massless it simply goes between most gases. Raleigh scattering is one of the few ways that photons lose energy on their way to the ground. Other than this you don’t have photons bouncing about in the air.
Reflection doesn’t lose energy and approximately a third of the emissions from the Sun that strike the outer atmosphere is reflected by N2, O2, O3 and high altitude clouds.
70% of the Earth is covered with oceans and the sunlight that strikes it is in general absorbed by matter such as plankton in the first 10 meters. Land masses in general absorb all light frequencies. Ice is highly reflective. High altitude clouds are composed of solid phase H2O and that’s why they are so reflective. Energy that isn’t reflected is in general absorbed.
You still seem to think the Sun has no roll in heating.
ooooops
typo
Kooi is correct. Half of the energy that strikes the outer atmosphere makes it to the ground and is absorbed. This heats the oceans and land masses. This in turn with a far lower energy per mass emits in the lower IR. The gases he mentons indeed absorb this lower IR but all but H2O are in such low amounts that they can be completely ignored. CO2 is the largest minority gas and it composes on 1/100th the average H2O levels. Moreover the absorption frequencies of CO2 are sharply limited and in an area of the lower IR where there is very little energy.
The only thing that counts is H2O in its three phases.
Charles – as you can see the ass R. Kooi doesn’t know.
Sunlight in its higher frequencies (known as light) show upon the Earth. Almost all of the energy is in the Ultra Violet (very little), visable light and high infrared. Approximately 30% is reflected by the atmosphere, clouds or the ground (70% of the Earth is covered by water and water is weakly reflective).
Some 19% of the incoming radiation is absorbed either by clouds or the atmosphere. And the remaining 51% of the incoming radiation is absorbed by the Earth – the oceans absorb most of it and the land the rest.
During the day when the energy absorbed and contained by the Earth exceeds the incoming energy the Earth radiates its energy in the far infrared bands. At night there is little to no incoming energy and so it emits throughout the night in the same energy bands.
What is important to know is that because the Earth never gets very warm the energy released is always in the low infrared. This is outside of the absorption lines of most of the atmospheric gases. The one exception is water which is in the atmosphere in all three phases – vapor, water and ice.
Because of this heat is not carried in the Earth into outer space via radiation. The radiated IR from the Earth is captured almost immediately by H2O almost immediately and is then moved throughout the atmosphere via conduction and convection. Or more crudely – by molecule containing heat bumping into other molecules and transferring part of their energy to them. The conduction of heat also knocks the molecules further apart – the air become lighter and rises. Cooler air replaces it through convection or the movement of air due to heat and density.
As you can see – under these conditions in the atmosphere ALL of the gasses are on the same footing and it doesn’t matter in the least what gas it is.
I agree with lots of your statement but not H2O. Once H2O(v) gets to above 30,000 feet there is not a lot of other molecules for the heat to be absorbed ergo that a lot of the heat from condensation drifts out into space.
Water vapor does not drift into outer space. Hydrogen does and some helium. But everything else is too heavy.
H2O is not a GHG it’s the planet’s heat exchanger. Water vapor goes well above 30,000 feet and then condences into micro ice crystals. At the point of sublimation heat is released and more than half of the heat energy is returned to space.
How?
You don’t know much about Physics? If you took Science your first observational experiment is watching an ice cube melt and that water go to boil. In Physics we had to solve for how much 1 cc of H20 to evaporate and go to the clouds to condense back into a 1 cc rain drop. Go study some real Science not spewing propaganda.
So you could not answer the question, I see.
It seems your school has a competent at teaching English as it was Physics.
I would like you to actually look at what you wrote. Criticizing someone’s English while making mistake of equal value makes you look silly.
LOL, you must be a Poe, surely.
Let me guess – you come from outer space and can’t even look up the proper spelling of words.
Dude do you know how hard it to fight with your phone when it decides for you. Or the fact that the comments section on my phone is really small. And editing on my phone is a nightmare. As my Freshman Comp Prof told us. You need to exercise linguistic humility.
No Science but plenty of fallacies.
I bet you don’t know these 4 Science Giants or what their contributions where. They where all treated with out respect from people like you.
1. John Harrison
2. Michael Faraday
3. Gregor Mendel
4. Georges Lemaitre.
And people like you had Antoine Lavoisier executed for being a Scientist
Charles – either answer his question or don’t respond. You have shown you’re not very bright at physics yourself by trying to reference your “professors”. And its not Physics or Science, these are not proper nouns that require capitalization unless you are referring specifically to a course in school.
R002 was not asking you how to boil water. He was asking how energy was lost to space.
In the troposphere energy radiates from the surface and is captured very rapidly by water vapor which is this thing called “humidity”.
Once the radiated energy is captured the movement of this energy into the stratosphere is almost entirely by conduction and convection. Using conduction all gases are pretty much the same so additional CO2 would make no difference.
My estimate is that all radiated energy (except for some holes in the absorption spectrum such as the 10 nm hole) is captured in about 1 meter though one authority, whose studies I’ve read, estimated 10 meters from surface level. I calculated the number of CO2 molecules per cubic meter and the emission spectrum of the Earth and it appears that 10 meters would be 100% absorption whereas I am assuming that once energy is captured these molecules rise and are replaced with other CO2 molecules with a dearth of energy. Since this mixing would require time perhaps the 10 meter estimation is better. And since the troposphere is 17 kilometers deep in mid-latitudes it doesn’t really matter. It does demonstrate that radiation really only occurs at the surface interface and heat is moved via conduction.
In the stratosphere the energy could not be lost without impinging sunlight. That is – molecules absorb additional energy until they reach the stage at which they can radiate not just the energy from the Earth but the additional energy from the Sun. This is plainly shown by the temperature curve in the stratosphere being inverted – that is, as gas rises it becomes warmer. This is peculiar to the stratosphere.
Since radiation occurs in all directions some of this energy is returned to the tropopause. But the absorption and emission frequencies are identical so the almost entire radiation comes from O2 and N2 and hence is absorbed by N2 and O2 to work its way out as many times as necessary for the radiated energy to make it to outer space.
98 or 99% of the energy that strikes the Earth from the Sun ends up back in space. The rest of it is used to make plant materials. CO2 has to be split into carbon plant material and free O2 and this requires energy.
H2O absorbs energy both coming in and going from sunlight down and IR out. It is the only greenhouse gas to actually speak of because the quantities of others are too low to bother with.
Both of you are arguing points that you aren’t clear on. So I would like you to stop calling each other stupid while you both are simply unclear on the subject.
Try some science:
https://pubs.giss.nasa.gov/docs/2010/2010_Lacis_la09300d.pdf
But, why rely on science and its inconvenient truths when the intertubes so readily provide us with thinking that helps absolve us of our responsibility?
Robert, exactly what do you know about climatology? Having read an article in Popular Science does not qualify you to make snooty remarks.
I know there is a near two hundred year body of research that has explored, discussed, analyzed every hypothesis that has been brought forward.
I know the consilience of evidence points to one hypothesis.
I know that there is a virtual 100% consensus among practicing climate scientists based on that near two hundred year body of research.
And I know that the world -minus a few comment threads – has analyzed, developed, and put into action military, public, and corp. plans and policies taking responsibility for our behavior’s effect on the ecosystem.
1. There is NOT a two hundred year body of research what causes the climate. There isn’t even that long a body of official knowledge of weather prediction.
2. IF the evidence pointed to ONE hypothesis it would have been tested. It has and doesn’t work. The computer models using the MANY hypothesis of climate not only cannot accurately predict the future, using the accurate measured data they cannot even predict the past!
https://nofrakkingconsensus.files.wordpress.com/2011/10/delinquentteenager_sample.pdf
Thanks for continuing to demonstrate that you think your incredulity is equivalent to actual expertise.
http://www.davidappell.com/EarlyClimateScience.html
https://history.aip.org/climate/co2.htm
Somehow, you’ve convinced yourself you’re an expert on the topic.
Here is a short compilation of book lists to help you disabuse yourself .
A Climate Change Reading List For Laypeople
https://www.npr.org/templates/story/story.php?storyId=121057831
The Global Climate Crisis and Capitalism: A Reading List
https://www.versobooks.com/lists/3003-the-global-climate-crisis-and-capitalism-a-reading-list
Earth’s Water Cycle and Climate Change: Reading List
https://www.loc.gov/rr/scitech/SciRefGuides/watercycle.html
Climate Change: A Reading List
https://bookriot.com/2016/11/27/climate-change-reading-list/
1A Earth Sciences – Reading List & Resources
https://www.esc.cam.ac.uk/library/research-skills-1/reading-lists/part-1a-earth-sciences-reading-list
For Climate Change Reporters, Here’s an Essential Reading List
http://www.sej.org/publications/sejournal/climate-change-reporters-heres-essential-reading-list
Read your link then share with the class so we can engage in debate. If you don’t then you’re just a lame drive by troll.
This article is making assumptions that simply aren’t true. Look, during the age of Dinosaurs the climate was very much like today and we had over 1% of the Earth’s atmosphere as CO2.
It is thought that the initial atmosphere was some 40% CO2 and the Earth was actually cooler then, since the Sun gained heat as it aged.
Remember that any of these studies are only the opinions of the scientists who are writing them and unfortunately with the inaccurate temperature data that NASA has been passing out you can’t trust anything about temperature to be accurate.
For instance: https://en.wikipedia.org/wiki/Global_warming#/media/File:Global_Temperature_Anomaly.svg
Pay specific attention to the time period on the chart from 1980 to present.
Now look at the actual satellite data: http://www.drroyspencer.com/wp-content/uploads/UAH_LT_1979_thru_March_2017_v6.jpg
This might appear to you as a slight temperature increase but in fact all it shows is that 1998 was a hotter than normal year and that the summer of 2015 was hotter than normal. All of the rest is nothing more than normal chaotic temperature changes. And despite these higher variations the average temperature actually averages to no change.
Perhaps you should elaborate on your evidence free assertion. A link to your peer reviewed rebuttal will suffice. LOL
http://www.woodfortrees.org/plot/gistemp/from:1980/plot/gistemp/from:1980/trend/plot/rss/from:1980/plot/rss/from:1980/trend
Same rate of warming in both. Fancy that.
You are an idiot, with zero comprehension on the subject you make comment. That your comments substantiate my position is most welcome, do go on…
By all means tell us what that page is supposed to mean? That higher atmospheric CO2 gives us more wood growth per year? What has that to do with temperature?
Is there not a grown up with you that can help?
After Germany surrendered the SS did not. The SS went through neighborhoods and any civilians that were flying a white flag to identify themselves as non-combatants the SS murdered. Prisoners that were held in SS prison camps were murdered. This is the sort of thing that you warmies think would be appropriate. Your “Sieg Heil” is precisely the same – without an ounce of knowledge you follow your leader. You and Robert snap to attention instantly and proclaim your allegiance to a NASA leadership that has been shown to be liars and criminals. You and Robert, are saying that all of the science out there that shows that AGW is not occurring is “cherry picking” the data. You proclaim the 2500 scientists on the IPCC (most of whom are not scientists at all but politicians, and a large percentage of the real scientists who disagree with AGW) to be far more important than the over 31,000 scientists who have signed the Oregon Petition including over 9,000 PhD’s and at least three Nobel Prize winners. That papers written by math experts and peer reviewed by members of the EPA and a Fulbright Scholar is cherry picking. What became of those Nazi’s? Most of them were finally murdered by their own. What do you suppose will happen to you now that no money is going into AGW “studies” – read phony papers? Very soon like the SS you will be left without your extremist leader and you won’t have anything to do but run around claiming that the world isn’t like it really is.
Thanks for that rant. It’s not every day that one comes across a genuine lunatic on Disqus. It seems remarkable that you claim that established science is in error, yet you also state you are unable to read a graph.
I find that hilarious. ;-)
Somebody seems to have missed the function of that slightly larger key on the right.
And why teachers from the last hundred years or so stressed the difference between topic sentences and supporting details.
Oh, and referencing OPP…
But he did well with the circling back to the SS topic…..
https://www.youtube.com/watch?v=Fh2_3WFEqYA&feature=youtu.be&t=2215
Person with rampant conspiracy theories posts video of Illuminati. Is this meant to impress?
Jaw drops.
Here, have the points. Have the points of my children yay unto the third generation of shape-shifting lizards.
This one is special.
He’s a scientist too, don’t you know, except for the blatant contradiction in his commenting history:
I got a job working on cars on a used car lot at 14 and worked for a year an a half and the owner paid me off with a used car. Then I could drive across town to work the entire time after school until 10 pm washing dishes at a restaurant. When I turned 17 1/2 I dropped out of school and went into the Air Force. VFW. The training I got there allowed me to work my way up to an electronics engineer better than most.
https://disqus.com/home/discussion/thefederalist23/10_things_house_minority_leader_nancy_pelosi_must_think_cost_1000_72/#comment-3731860595
The must be a special kind of stupid on offer at the moment.
“Better than most” is a giveaway.
But you left out the best bit:
What’s even funnier is that you don’t even know what “established science” means. As a scientist I have watched people like you attempt to teach your ideas of science to the rest of us. Since you are a complete idiot not only does that not work but it clues in all of those around you that have enough education to see that you are a total ass. But carry on. This same thing happened when you fools tried to get Hillary elected. The more you spoke the more people turned against you and your asinine ideas. Now we have a study showing that Hillary’s 2 million vote “popular vote” was really a 3.5 million fake vote loss. PLEASE continue to talk.
OMG, this just get funnier and funnier.
Person that cannot read a graph now claims to be a scientist too. Nicely explained here:
http://psych.colorado.edu/~vanboven/teaching/p7536_heurbias/p7536_readings/kruger_dunning.pdf
Perhaps, Mr claimed scientist, you would like to set out your object to the greenhouse effect? LOL
“the over 31,000 scientists who have signed the Oregon Petition including over 9,000 PhD’s and at least three Nobel Prize winners.”
The Oregon Petition:
1. is not fact-checked
2. all it requires to claim status as a “scientist” is an undergraduate degree in some science major
3. By that definition, the number of people who fit the definition runs to several million, a fact fully consistent with the overwhelming consensus in the expert climate science community who accept AGW as wrong
4. It contains the names of many fakes, including the Spice Girls and more than one family pet.
5. The Nobel Prize winners who signed it are none of them climate experts .
6. Having a PhD does not bestow one with magical all-knowing powers. Very few of the PhDs on the list have the appropriate scientific expertise.
The Oregon Petition has become a running joke.
Climate scientists receive funding to study the climate, not to argue yay or nay on AGW. AGW is basically taken as a given in the expert community.
For some reason RSS trend is some ~0.1C/decade higher than GIS ’80 thru about ’98 or so, then about 0.1C/decade lower than GIS ’98 thru present.
Hadcrut4 however matches RSS trend closely after ’98.
Given they are measuring different things, and the RSS is considerably more influenced relatively by El Nino events, picking dates and indicating different trends would be completely expected.
Given C.T.’s implied claim that your source has faulty science, it seems a bit odd there was no effort to link to another published piece that refutes it. Surely the last 7+ years some revered emeritus would have had the time……. not to mention the month it took to come up with such an insightful, witty rebuttal
( https://disqus.com/home/discussion/cfact/decision_looms_in_michael_mann_tim_ball_8220hockey_stick8221_lawsuit/#comment-3727547067 )
to your comment…..
Didn’t you reply back to me that most of the heat never returns back to space??
Before making a stupid comment like that perhaps you ought to actually look back a couple of postings where a comment nothing at all like your memory was made.
Charles – I am curious to where you get the idea that you can proclaim one act for water? The heat exchange mechanism is so complex that I am rather put out that you proclaim only a single mechanism and one that is the most minor of them all.
At low altitudes water can condense into low altitude liquid phase and even lower as fog and depending on many things can either trap in heat or cause frost which warms the lower atmosphere.
At middle altitudes water can appear a gaseous, liquid or ice particles and in all cases it would have a different effect on the atmosphere. At high altitudes it is usually pushed there by heavy storm action and it can be either liquid or ice and usually reflects the sun’s energy in very large percentages.
Perhaps you’d like to explain why the upper stratosphere is warmer than the tropopause?
Passing crap around as if the atmosphere was some simple one-word easy to understand thing is pretty juvenile.
And as ANY IR astronomer will tell you, water is the ONLY significant GHG.
95% + of greenhouse effect is H2O, water, invisible as vapour, or visible as clouds etc. Less than 4% of greenhouse effect is CO2, Carbon Dioxide.
Of the CO2 in the atmosphere 95% + is generated by nature. Less than 4% is generated by Man.
Man’s CO2 dominates climate change?
BWAHAHAHAHA. Wankers at large.
57% of atmospheric CO2 is outgassed from warm tropical oceans.
Volcanoes contribute significantly, also decaying vegetation, every winter. Animals alone contribute 25X mans’ CO2 output.
What you warmunista bedwetters plan to do?
Slaughter all the animals?
Or the humans? As if I need ask. Communist/Fascist crapheads always love to slaughter millions of people, all for the good of the people, of course.
Think Communist USSR, Communist China, Fascist Germany, Communist Cambodia & present-day Fascist USSA.
Quantities, in gigatons, are given in Ian Plimer’s H & E book.
John – these days the True Believers in the Church of Global Warming refer to the murdering of millions – of forbidding the uses of fuel to Africa, India and large parts of the minority world as “Ethical Depopulation”.
Do you have this? The outright murder is bad but murder by proxy is really really good. Margaret Sanger said everything that the white liberals have ALWAYS believed:
“The most merciful thing that the large family does to one of its infant members is to kill it.”
— Woman and the New Race, Chapter 5, “The Wickedness of Creating Large Families.” (1920) http://www.bartleby.com/1013/
Is there any woman more perverted than one who wants to kill kids?
The agendas behind the warming/climate scam are vast depopulation, the destruction of ALL nations, the founding of a world Nazi Govt, based on the UN & the elimination of Christianity.
Grim book: Merchants Of Despair, radical environmentalists, criminal pseudo-scientists and the fatal cult of antihumanism
By Robert Zubrin, PhD nuclear engineer with 9 patents to his name or pending.
It is easy because so many of my Science professors said so. If you remove all the water and retain the same atmospheric pressure at sea level. You would see 300 degree temp changes each day. Most likely would be more extreme. I am sorry you still go to the church of CHG. Water is not a CHG even as clouds. What you mistake as a CHG effect at night is in reality a transitory blanket effect.
What is CHG? I assume that is a typo? You are telling us the heat exchange mechanism for atmospheric H2O which is identical to that of the touted greenhouse gases. Or don’t you understand that temperature stabilization is really what is occurring?
The mass of the Earth absorbs the rather small amount of energy that strikes the Earth and makes it to the surface. That energy warms the surface only so much. You can use the Stefan-Boltzmann Law to predict the temperature from the emitted IR or visa versa. While you cannot be absolutely accurate without a coefficient of emission, it is so close to one that it can be safely ignored. This law was really designed to measure the temperature of a star.
All of the “energy balance” drawings from NASA show 100% of the energy that falls upon the Earth as being emitted in one manner or another. But we have coal and oil deposits that prove that it is not 100%. While the energy retained must be pretty small it is not 100% emission. And so it should not be presented as such.
You and I agree on the actions of water in the atmosphere but please do not invoke the authority of some unknown “professors”. It is plain that you are contradicting me in nothing more than a reworded identical process.
H2O is 95% + of greenhouse effect.
John – That remaining 5% is all other greenhouse gases combined and that includes Ozone which is damned absorbent between 9.8 um to 9.99 which besides H2O is also near CO2.
I would hesitate to call it greenhouse effect. This represents H2O converting radiated energy into conductive energy. Since radiation occurs at the speed of light while conduction occurs at the speed of molecular motion you can see why the lower atmosphere is warmer than the tropopause. This entire subject is really screwed up because of the words “greenhouse” and the fact that people have no idea how a greenhouse works.
The Greenhouse Effect
“Instead, parts of our atmosphere act as an insulating blanket of just the right thickness, trapping sufficient solar energy to keep the global average temperature in a pleasant range. The Martian blanket is too thin, and the Venusian blanket is way too thick! The ‘blanket’ here is a collection of atmospheric gases called ‘greenhouse gases’ based on the idea that the gases also ‘trap’ heat like the glass walls of a greenhouse do.”
http://eo.ucar.edu/learn/1_3_1.htm
How is Earth a greenhouse?
“Earth’s atmosphere does the same thing as the greenhouse. Gases in the atmosphere such as carbon dioxide do what the roof of a greenhouse does.”
https://climatekids.nasa.gov/greenhouse-effect/
Why does CO2 get most of the attention when there are so many other heat-trapping gases?
“Heat-trapping gases, in balanced proportions, act like a blanket surrounding Earth, keeping temperatures within a range that enables life to thrive on a planet with liquid water.
Unfortunately, these gases—especially CO2—are accumulating in the atmosphere at increasing concentrations due to human activities such as the burning of fossil fuel in cars and power plants industrial processes, and the clearing of forests for agriculture or development.
As a result, the insulating blanket is getting too thick and overheating the Earth as less energy (heat) escapes into space. ”
https://www.ucsusa.org/global-warming/science-and-impacts/science/CO2-and-global-warming-faq.html
Similes work.
I correctly explained how the warming in the troposphere has to do with CONDUCTION and not radiation. Since the CO2 has slightly more conduction of heat than other gases in fact CO2 is a coolant. Your simile is incorrect. Greenhouses work by blocking OFF conduction and not by acting as a blanket. If you open the door of a greenhouse and let air circulate they became the same temperature inside and out.
When you DON’T understand what is being said you should either learn or remain silent. Instead your operation is to spew stupidity.
Yes, my FIRST CHOICE when looking for science information is to head to the comment section of a climate science denialist blog. ( /s, just in case)
The simile works. It is a simile, not the 14 thlecture of a 400 level physics course. That’s why one of te sources is a childrens’site
And the only people I’ve run across who want to argue that the simile is a way to disprove the hypothesis are pretend experts on those comment sections.
Thanks for continuing to display how a lack of a modicum of critical thinking lead you to your conclusions.
C.R.A.A.P. TEST
Currency: the timeliness of the information
When was the information published or posted?
Has the information been revised or updated?
Is the information current or out-of date for your topic?
Are the links functional?
Relevance: the importance of the information for your needs
Does the information relate to your topic or answer your question?
Who is the intended audience?
Is the information at an appropriate level (i.e. not too elementary or advanced for your needs)?
Have you looked at a variety of sources before determining this is one you will use?
Would you be comfortable using this source for a research paper?
Authority: the source of the information
Who is the author/publisher/source/sponsor?
Are the author’s credentials or organizational affiliations given?
What are the author’s credentials or organizational affiliations given?
What are the author’s qualifications to write on the topic?
Is there contact information, such as a publisher or e-mail address?
Does the URL reveal anything about the author or source?
examples: .com (commercial), .edu (educational), .gov (U.S. government),
.org (nonprofit organization), or .net (network)
Accuracy: the reliability, truthfulness, and correctness of the content, and
Where does the information come from?
Is the information supported by evidence?
Has the information been reviewed or refereed?
Can you verify any of the information in another source or from personal knowledge?
Does the language or tone seem biased and free of emotion?
Are there spelling, grammar, or other typographical errors?
Purpose: the reason the information exists
What is the purpose of the information? to inform? teach? sell? entertain? persuade?
Do the authors/sponsors make their intentions or purpose clear?
Is the information fact? opinion? propaganda?
Does the point of view appear objective and impartial?
Are there political, ideological, cultural, religious, institutional, or personal biases?
http://libguides.library.ncat.edu/content_mobile.php?pid=53820&sid=394505#box_394505
Here’s a couple of simple worksheets to print out to help:
http://libraryguides.ccbcmd.edu/ld.php?content_id=14159298
http://www.juniata.edu/services/library/instruction/handouts/craap_worksheet.pdf
And, love that your conclusion is an insult.
The hilarious part about your list of institutions all seem to refuse to answer questions on their positions. If you can’t answer questions then your theory is not very sound. Ergo it is most likely propaganda to create an entire class of taxation.
Oh, really? You have copies of your emailed queries and some form of response saying that?
Booby that is your only fall back is to use a fallacy. I task you to write to them and ask questions. They won’t reply to you either.
So, no actual evidence. Thank you for acknowledging your claim was an effort to sidetrack a conversation.
Noted, again, that name calling is used rather than taking the effort to learn the science.
Booby do you know why CO2 is a Green House Gas? What temperature does CO2 become a GHG?
C.T., that you start your query with namecalling/insulting is indicative.
If you really, honestly think there is room for debating basic physics & chemistry behind nearly two centuries of research, please go attend a class at your local community college.
Or, if you want to continue entertaining readers hrre, walk us through why you think it is necessary to argue these fundemental points.
The world – minus a vanishingly small coterie of pd for denialist blogs and current administration – has moved well past that and is discussing, developing, and putting into action, military, public, and corp. policy to mitigate and adapt to the ecologic effects we are responsible for.
Especially funny response you’ve given about sites whose main purpose is to present detailed explanations of the science and the effects of our actions.
Sad thing bobby that all those sites refuse to answer question put to them. It can’t be Science if they refuse to answer questions.
Your evidence they are acting as you claim?
Go missing…
And we’ll note your efforts at diminution rather than actually trying to bring forward evidence.
Before I can bring forth my evidence. I need to find out what you know. It appears you either don’t know much or are afraid of sharing what you know about Climate Change.
Let’s start off with my original question. How does CO2 retain so much heat energy that as a trace gas it can increase global temp? None of you useful fools seem to handle answer this basic question on AGW.
That you think a comment thread is a venue to argue basic physics…..
Here, educate yourself. Then realize no one is really arguing the science; instead, we – virtually every country, state, county, city -are developing policies in reaction to what we are doing to our ecosystem.
“The likely range of the human contribution to the global mean temperature increase over the period 1951–2010 is 1.1° to 1.4°F (0.6° to 0.8°C), and the central estimate of the observed warming of 1.2°F (0.65°C) lies within this range (high confidence). This translates to a likely human contribution of 92%–123% of the observed 1951–2010 change. The likely contributions of natural forcing and internal variability to global temperature change over that period are minor (high confidence). (Ch. 3; Fig. ES.2)”
USGCRP, 2017: Climate Science Special Report: Fourth National Climate Assessment, Volume I [Wuebbles, D.J., D.W. Fahey, K.A. Hibbard, D.J. Dokken, B.C. Stewart, and T.K. Maycock (eds.)]. U.S. Global Change Research Program, Washington, DC, USA, 470 pp., doi: 10.7930/J0J964J6
WHAT WE KNOW
THE REALITY, RISKS, AND RESPONSE TO CLIMATE CHANGE
The overwhelming evidence of human-caused climate change documents both current impacts with significant costs and extraordinary future risks to society and natural systems. The scientific community has convened conferences, published reports, spoken out at forums and proclaimed, through statements by virtually every national scientific academy and relevant major scientific organization — including the American Association for the Advancement of Science (AAAS) — that climate change puts the well-being of people of all nations at risk. http://whatweknow.aaas.org/…
What’s Really Warming the World? Climate deniers blame natural factors; NASA data proves otherwise
https://www.bloomberg.com/g…
What is climate change? http://www.metoffice.gov.uk…
Environment and Climate Change Canada https://www.ec.gc.ca/cc/
European Climate Adaptation Platform (CLIMATE-ADAPT) http://climate-adapt.eea.eu…
Cornell Climate Change http://climatechange.cornel…
republicEn: Engaging Conservatives https://www.climatechangeco…
George Mason University Center for Climate Change Communication https://www.climatechangeco…
EARTH Institute http://earth.columbia.edu/a…
And the science condensed :
D.3 Detection and Attribution of Climate Change
Human influence has been detected in warming of the atmosphere and the ocean, in changes in the global water cycle, in reductions in snow and ice, in global mean sea level rise, and in changes in some climate extremes (see Figure SPM.6 and Table SPM.1). This evidence for human influence has grown since AR4. It is extremely likely that human influence has been the dominant cause of the observed warming since the mid-20th century. {10.3–10.6, 10.9}
• It is extremely likely that more than half of the observed increase in global average surface temperature from 1951 to 2010 was caused by the anthropogenic increase in greenhouse gas concentrations and other anthropogenic forcings together. The best estimate of the human-induced contribution to warming is similar to the observed warming over this period. {10.3}
• Greenhouse gases contributed a global mean surface warming likely to be in the range of 0.5°C to 1.3°C over the period 1951 to 2010, with the contributions from other anthropogenic forcings, including the cooling effect of aerosols, likely to be in the range of −0.6°C to 0.1°C. The contribution from natural forcings is likely to be in the range of −0.1°C to 0.1°C, and from natural internal variability is likely to be in the range of −0.1°C to 0.1°C. Together these assessed contributions are consistent with the observed warming of approximately 0.6°C to 0.7°C over this period. {10.3}
• Over every continental region except Antarctica, anthropogenic forcings have likely made a substantial contribution to surface temperature increases since the mid-20th century (see Figure SPM.6). For Antarctica, large observational uncertainties result in low confidence that anthropogenic forcings have contributed to the observed warming averaged over available stations. It is likely that there has been an anthropogenic contribution to the very substantial Arctic warming since the mid-20th century. {2.4, 10.3}
• It is very likely that anthropogenic influence, particularly greenhouse gases and stratospheric ozone depletion, has led to a detectable observed pattern of tropospheric warming and a corresponding cooling in the lower stratosphere since 1961. {2.4, 9.4, 10.3}
• It is very likely that anthropogenic forcings have made a substantial contribution to increases in global upper ocean heat content (0–700 m) observed since the 1970s (see Figure SPM.6). There is evidence for human influence in some individual ocean basins. {3.2, 10.4}
• It is likely that anthropogenic influences have affected the global water cycle since 1960. Anthropogenic influences have contributed to observed increases in atmospheric moisture content in the atmosphere (medium confidence), to global scale changes in precipitation patterns over land (medium confidence), to intensification of heavy precipitation over land regions where data are sufficient (medium confidence), and to changes in surface and sub-surface ocean salinity (very likely). {2.5, 2.6, 3.3, 7.6, 10.3, 10.4}
SPM WG1 AR5
Clearly you don’t. All you can do is copy and paste. Then once confronted you use fallacy and avoid the question. It is hard to debate if you won’t answer.
Yup. Absolutely correct. Go learn science in a science class. That you think there is any actual debate on the basic chemistry and physics only points to a diehard opinion that you don’t want to be considered responsible for your actions.
Now. If you want to discuss Capitalism, religious idiocy, nationalism, and general human disregard having gotten us here and what the best efforts to adapt, mitigate, there is plenty of space on this opinion site.
No scientist can be expected to give an accurate assessment if he is being handed bad data no matter how honest he is. And as I showed above – NASA has been changing raw data in a manner that mathematicians says is impossible. What’s more, you NEVER change raw data. You publish another chart with any corrections you feel necessary with complete explanations of what and why corrections were made.
They actually have done this with the sea level changes. And they killed all of their veracity with that.
By direct measurement at most sites since the civil war sea levels have been measured. This is very difficult in the best of times but they were showing sea level rises of a single mm per year. Suddenly in 1980 they claimed that sea levels were changing at 2 mm per year.
When examined we discovered that NASA was claiming that the core of the Earth was shrinking at 1 mm per year and so the sea level would have to be increasing at 2 mm per year to show 1 mm per year sea level increases.
Uhh, that shrinkage has NEVER been measured. It is a wild-assed guess that comes from the fact that although we are gaining star-dust at a rate of 40,000 tonnes per year, we are losing 50,000 tonnes of hydrogen and helium each year as it floats off into outer space because Earth’s gravity field is too light to hold it against the solar wind.
Even 6th grade students understand that :
1 -claims need to be supported by evidence.
2 -Extraordinary claims require extraordinary evidence” Carl Sagan.
https://www2.uwstout.edu/content/profdev/rubrics/middlelschresearchrubric.html
“When examined we discovered…”
Perhaps you don’t understand these sorts of things – if NASA claims that there is shrinkage due to the core cooling THEY have to demonstrate extraordinary evidence and not me.
Perhaps you should try re-reading what I posted and note who it was posted to.
This is a social media. If you want to hold a private conversation go to Facebook and use private messaging. Does it bother you that I have answers for your misinformation?
Ummm, I posted that to you….
And your answers hold little to no weight without substantive supporting resources. That was the point.
You claim, with no evidence, to have expertise. I point to actual, real people and institutions who have demonstrated their expertise.
And have pointed out the world has accepted that expertise and act based on that understanding.
You counter w more claims and unsupported assertions.
“NASA has been changing raw data in a manner that mathematicians says is impossible…”
The average 6th grader know that there needs to be an in text citation following that.
https://owl.english.purdue.edu/owl/resource/560/02/
https://owl.english.purdue.edu/owl/resource/747/02/
Firstly, I have cited the source of that study many times. Second, what sort of ass uses suggestions on how to write social science papers about mathematics? You do not REFERENCE anything but your source of data and statistical analysis does not require references.
But since your memory is one of two postings long: https://thsresearch.files.wordpress.com/2017/05/ef-gast-data-research-report-062717.pdf
As for peer review:
“The Undersigned Agree with the Conclusions of this Report:
Dr. Alan Carlin
Retired Senior Analyst and manager, US Environmental Protection Agency,
Washington, DC.
Author, Environmentalism Gone Mad, Stairway Press, 2015.
Ph.D., Economics, Massachusetts Institute of Technology, Cambridge, MA.
BS, Physics, California Institute of Technology, Pasadena, CA.
Dr. Harold H. Doiron
Retired VP-Engineering Analysis and Test Division, InDyne, Inc.
Ex-NASA JSC, Aerospace Consultant
B.S. Physics, University of Louisiana – Lafayette
M.S., Ph.D., Mechanical Engineering, University of Houston
Dr. Theodore R. Eck
Ph.D., Economics, Michigan State University
M.A, Economics, University of Michigan
Fulbright Professor of International Economics
Former Chief Economist of Amoco Corp. and Exxon Venezuela
Advisory Board of the Gas Technology Institute and Energy Intelligence Group
Dr. Richard A. Keen
Instructor Emeritus of Atmospheric and Oceanic Sciences, University of Colorado
Ph.D., Geography/Climatology, University of Colorado
M.S., Astro-Geophysics, University of Colorado
B.A., Astronomy, Northwestern University
Dr. Anthony R. Lupo
IPCC Expert Reviewer
Professor, Atmospheric Science, University of Missouri
Ph.D., Atmospheric Science, Purdue University
M.S., Atmospheric Science, Purdue University
Dr. Thomas P. Sheahen
Ph.D., Physics, M.I.T.
B.S., Physics, M.I.T.
Dr. George T. Wolff
Former Chair EPA’s Clean Air Scientific Advisory Committee
Ph.D., Environmental Sciences, Rutgers University
M.S., Meteorology, New York University
B.S., Chemical Engineering, New Jersey Institute of Technology”
Thanks for yet again showing you really have a unclear concept on what citing a reliable source means.
Or, quite obviously what supporting an assertion means…
What do you find unreliable about a paper that was reviewed by the manager of the EPA, a NASA consultant, a Fulbright scholar, an Instructor Emeritus of Atmospheric and Oceanic Sciences, a member of the IPCC, a PhD scholar in physics from MIT and the Former Chair EPA’s Clean Air Scientific Advisory Committee?
Or perhaps you object to the fact that the paper was written by a psychiatrist, an econometrician and a meteorologist despite the fact that understanding the acts of people like you who insist you know what you’re talking about when you haven’t the slightest training requires an understanding of the mental states that would lead you to continue arguing about these things?
1 – “a paper”
2- unpublished
3- multiple logical fallacies
4- attempted insulting
Wow, nearly a dozen resources explain the basic science…
Basic science with a consilience of evidence from a near 200 year body of research.
And the response is…
Wait for it….
Unsupported and near conspiracy level assertions.
When you don’t know what you’re talking about would you please not post? Or if you believe you do know what you’re talking about perhaps you can offer real references and not Climate Kids.
Keep playing with the logical fallacy creator.
So, other than an Attack the Messenger, you don’t have anything.
Other than a shade of ‘America, love it or leave it’.
Thanks.
Somehow, you’ve convinced yourself you’re an expert on the topic.
Here is a short compilation of book lists to help you disabuse yourself .
A Climate Change Reading List For Laypeople
https://www.npr.org/templates/story/story.php?storyId=121057831
The Global Climate Crisis and Capitalism: A Reading List
https://www.versobooks.com/lists/3003-the-global-climate-crisis-and-capitalism-a-reading-list
Earth’s Water Cycle and Climate Change: Reading List
https://www.loc.gov/rr/scitech/SciRefGuides/watercycle.html
Climate Change: A Reading List
https://bookriot.com/2016/11/27/climate-change-reading-list/
1A Earth Sciences – Reading List & Resources
https://www.esc.cam.ac.uk/library/research-skills-1/reading-lists/part-1a-earth-sciences-reading-list
For Climate Change Reporters, Here’s an Essential Reading List
http://www.sej.org/publications/sejournal/climate-change-reporters-heres-essential-reading-list
Can you explain who CO2 at such a pitiful small amount can retain so much heat? Please use your own words not a link. I can debate with you I can’t debate with your deaf link
The science says what the sciences say. That you think your incredulity implies the science is wrong only points to your inability or unwillingness to understand what that nearly two hundred years of research says.
If you had a science source supporting your talking point virtually copy/pasted from paid for from denialist blogs, we’d see it
Instead, we get your claim that no efforts to explain the science are available to you.
Here are some additional learning opportunities:
“The likely range of the human contribution to the global mean temperature increase over the period 1951–2010 is 1.1° to 1.4°F (0.6° to 0.8°C), and the central estimate of the observed warming of 1.2°F (0.65°C) lies within this range (high confidence). This translates to a likely human contribution of 92%–123% of the observed 1951–2010 change. The likely contributions of natural forcing and internal variability to global temperature change over that period are minor (high confidence). (Ch. 3; Fig. ES.2)”
USGCRP, 2017: Climate Science Special Report: Fourth National Climate Assessment, Volume I [Wuebbles, D.J., D.W. Fahey, K.A. Hibbard, D.J. Dokken, B.C. Stewart, and T.K. Maycock (eds.)]. U.S. Global Change Research Program, Washington, DC, USA, 470 pp., doi: 10.7930/J0J964J6
WHAT WE KNOW
THE REALITY, RISKS, AND RESPONSE TO CLIMATE CHANGE
The overwhelming evidence of human-caused climate change documents both current impacts with significant costs and extraordinary future risks to society and natural systems. The scientific community has convened conferences, published reports, spoken out at forums and proclaimed, through statements by virtually every national scientific academy and relevant major scientific organization — including the American Association for the Advancement of Science (AAAS) — that climate change puts the well-being of people of all nations at risk. http://whatweknow.aaas.org/…
What’s Really Warming the World? Climate deniers blame natural factors; NASA data proves otherwise
https://www.bloomberg.com/g…
What is climate change? http://www.metoffice.gov.uk…
Environment and Climate Change Canada https://www.ec.gc.ca/cc/
European Climate Adaptation Platform (CLIMATE-ADAPT) http://climate-adapt.eea.eu…
Cornell Climate Change http://climatechange.cornel…
republicEn: Engaging Conservatives https://www.climatechangeco…
George Mason University Center for Climate Change Communication https://www.climatechangeco…
EARTH Institute http://earth.columbia.edu/a…
And the science condensed :
D.3 Detection and Attribution of Climate Change
Human influence has been detected in warming of the atmosphere and the ocean, in changes in the global water cycle, in reductions in snow and ice, in global mean sea level rise, and in changes in some climate extremes (see Figure SPM.6 and Table SPM.1). This evidence for human influence has grown since AR4. It is extremely likely that human influence has been the dominant cause of the observed warming since the mid-20th century. {10.3–10.6, 10.9}
• It is extremely likely that more than half of the observed increase in global average surface temperature from 1951 to 2010 was caused by the anthropogenic increase in greenhouse gas concentrations and other anthropogenic forcings together. The best estimate of the human-induced contribution to warming is similar to the observed warming over this period. {10.3}
• Greenhouse gases contributed a global mean surface warming likely to be in the range of 0.5°C to 1.3°C over the period 1951 to 2010, with the contributions from other anthropogenic forcings, including the cooling effect of aerosols, likely to be in the range of −0.6°C to 0.1°C. The contribution from natural forcings is likely to be in the range of −0.1°C to 0.1°C, and from natural internal variability is likely to be in the range of −0.1°C to 0.1°C. Together these assessed contributions are consistent with the observed warming of approximately 0.6°C to 0.7°C over this period. {10.3}
• Over every continental region except Antarctica, anthropogenic forcings have likely made a substantial contribution to surface temperature increases since the mid-20th century (see Figure SPM.6). For Antarctica, large observational uncertainties result in low confidence that anthropogenic forcings have contributed to the observed warming averaged over available stations. It is likely that there has been an anthropogenic contribution to the very substantial Arctic warming since the mid-20th century. {2.4, 10.3}
• It is very likely that anthropogenic influence, particularly greenhouse gases and stratospheric ozone depletion, has led to a detectable observed pattern of tropospheric warming and a corresponding cooling in the lower stratosphere since 1961. {2.4, 9.4, 10.3}
• It is very likely that anthropogenic forcings have made a substantial contribution to increases in global upper ocean heat content (0–700 m) observed since the 1970s (see Figure SPM.6). There is evidence for human influence in some individual ocean basins. {3.2, 10.4}
• It is likely that anthropogenic influences have affected the global water cycle since 1960. Anthropogenic influences have contributed to observed increases in atmospheric moisture content in the atmosphere (medium confidence), to global scale changes in precipitation patterns over land (medium confidence), to intensification of heavy precipitation over land regions where data are sufficient (medium confidence), and to changes in surface and sub-surface ocean salinity (very likely). {2.5, 2.6, 3.3, 7.6, 10.3, 10.4}
SPM WG1 AR5
WOW you know how to copy and paste. A lot words but mostly it is a contrivance. It is still only a trace gas at 400 ppm. How does it retain so much heat? Can you answer that without a link or a copy and paste?
Well nearly a dozen resources show that your efforts to argue basic physics is a ludicrous position to cling to in an effort to not accept what the world -minus a few denialist blogs- knows and has taken responsibility for our behavior to heart by developing military, public, and corp. policy and plans to mitigate and adapt to our changing ecosystem.
You are not arguing basic physics. None of your comments have shown you understand basic physics. Again let me repeat – looking for something that will back your position and then using that as some sort of reference is not science. It is nothing more than bias. I have designed and programmed spectrometers and gas analyzers. I can tell you unequivocally that increasing CO2 would make no difference because all of the energy in those absorption bands is already saturated at perhaps 250 ppm or so. What’s more, plant growth is seriously affect by CO2 that low. Photosynthesis ceases at 180 ppm and the increase in CO2 is feeding the world.
Absolutely correct that I’m not arguing basic, foundational physics.
“…plant growth is seriously affect by CO2 that low. ”
Interesting given how ~280, what we’ve had from the beginning of agriculture, has allowed farm and forest to flourish for so many centuries.
Again. There is -other than a few Internet comments – no one arguing that the basic physics is wrong.
Indeed, the world has understood the basics, understood the science is solid, and have developed, researched, and put into action policies based on that acceptance of the xcience and our effects on our environment.
All you are doing is showing how you are unwilling to take responsibility for your actions.
Tell me how you know what CO2 levels were 12,000 years ago which is approximately the start of real agriculture? If you read: http://www.geocraft.com/WVFossils/stomata.html you will discover that over the last 15,000 years that CO2 level has averaged about 310 ppm but with some wild swings that show ticks as high as 340 ppm. This is as much as 25% more than the ice core research shows.
You are rather comical trying to use popularity of an idea as proof of its accuracy.
Wow, a whole body of research easily available at scholar . google and you found….
geocraft
So, what you’ve demonstrated is
1-that your incredulity does not mean you are right
2 – a lack of intellectual curiosity, rigor, and critical thinking skills
3- a source that agrees with your conclusion is worth more to you than what basic research skills would have rendered.
Background: Unprecedented Rise of CO2
“Over the past million years, atmospheric carbon dioxide has been generally low and fluctuated predictably within a window of 200 to 300 ppm. This, the researchers explain, has sustained the current icehouse – a time marked by continental ice at the polar regions – under which humans have evolved. This trend has been abruptly interrupted by the pronounced rise of carbon dioxide over the past 100 years to the current level of 401 ppm—one not seen on Earth for at least the past 3.5 million years.”
https://phys.org/news/2016-10-ancient-co2-future-climate.html
I realize that it was too much for you to read the article.
The actual papers which you haven’t any capability of understanding was:
http://droyer.web.wesleyan.edu/RPP.pdf
https://debunkhouse.wordpress.com/2015/03/09/stomata-posts/
But of course if you were bright enough to actually research anything you’re find a technique called “Geocarb” which uses geological rock degradation from CO2 to estimate CO2 levels in the atmosphere. These show CO2 levels to be even higher than the stomata research.
This shows among other things that there was a very low CO2 levels directly following the Maunder Minimum. The colder the oceans the less outgasing of CO2 and the more it absorbs. As the oceans warm they outgas CO2. It takes a VERY long time to warm 300 million cubic miles of seawater. But I’m sure you’re not interested in that.
Your interests lie in using an ignorant term like “denialist”. The proof positive that you haven’t a clue what is going on around you.
Ah,,,,,, insulting,
generic link w no quoted material,
disreputable site
a paltry selection of cherry picked resources….
And why cite geocraft then say “The actual papers …”
And it would be interesting to see your thesis statement or hypothesis driving your cites.
Here is a study that shows that 400 ppm contrary to the claims of the enviro-whackos is neither unusual or particularly high.
http://www.geocraft.com/WVFossils/stomata.html
There is a chart there that demonstrates wild differences between plant stomata research and the ice dome samples.
For years I’ve been saying that these ice samples are wildly inaccurate when it comes to CO2 and this is proof of it.
Robert, I should have known that you get your information from “climatekids”. The description of how a greenhouse works is incorrect.
And if CO2 acted like the roof of a greenhouse the upper atmosphere would be warm and it is not. “In mathematical speak that is 9.8°C per 1,000 meters. However, if you’re in a cloud, or it is snowing/raining, the temperature decreases by about 3.3°F for every 1,000 feet up you go in elevation. Thus meaning it’s a change of 6°C per 1,0000 meters”
Please don’t look around to find anything that can support your view and then use that as some sort of accurate reference.
NASA has been changing their temperature data. You should NEVER change your actual measure data but make new charts that explain what corrections you’ve made and why.
And especially when any competent mathematician can look at the changes and see that they could not have been due to correcting for calibration errors: https://thsresearch.files.wordpress.com/2017/05/ef-gast-data-research-report-062717.pdf
“The conclusive findings of this research are that the three GAST data sets are not a valid representation of reality. In fact, the magnitude of their historical data adjustments, that removed their cyclical temperature patterns, are totally inconsistent with published and credible U.S. and other temperature data. Thus, it is impossible to conclude from the three published GAST data sets that recent years have been the warmest ever –despite current claims of record setting
warming.
Finally, since GAST data set validity is a necessary condition for EPA’s GHG/CO2 Endangerment Finding, it too is invalidated by these research findings.”
“The Undersigned Agree with the Conclusions of this Report:
Dr. Alan Carlin
Retired Senior Analyst and manager, US Environmental Protection Agency,
Washington, DC.
Author, Environmentalism Gone Mad, Stairway Press, 2015.
Ph.D., Economics, Massachusetts Institute of Technology, Cambridge, MA.
BS, Physics, California Institute of Technology, Pasadena, CA.
Dr. Harold H. Doiron
Retired VP-Engineering Analysis and Test Division, InDyne, Inc.
Ex-NASA JSC, Aerospace Consultant
B.S. Physics, University of Louisiana – Lafayette
M.S., Ph.D., Mechanical Engineering, University of Houston
Dr. Theodore R. Eck
Ph.D., Economics, Michigan State University
M.A, Economics, University of Michigan
Fulbright Professor of International Economics
Former Chief Economist of Amoco Corp. and Exxon Venezuela
Advisory Board of the Gas Technology Institute and Energy Intelligence Group
Dr. Richard A. Keen
Instructor Emeritus of Atmospheric and Oceanic Sciences, University of Colorado
Ph.D., Geography/Climatology, University of Colorado
M.S., Astro-Geophysics, University of Colorado
B.A., Astronomy, Northwestern University
Dr. Anthony R. Lupo
IPCC Expert Reviewer
Professor, Atmospheric Science, University of Missouri
Ph.D., Atmospheric Science, Purdue University
M.S., Atmospheric Science, Purdue University
Dr. Thomas P. Sheahen
Ph.D., Physics, M.I.T.
B.S., Physics, M.I.T.
Dr. George T. Wolff
Former Chair EPA’s Clean Air Scientific Advisory Committee
Ph.D., Environmental Sciences, Rutgers University
M.S., Meteorology, New York University
B.S., Chemical Engineering, New Jersey Institute of Technology”
Sorry you think the nearly dozen resources can be exemplified by a single source. That transparent use of a logical, fallacy points out just how empty your efforts are in trying to argue basic, foundational research of the past nearly two centuies.
Meanwhile, the rest of the world has taken science and learned from it. And have accepted our responsibility of working within the ecological system that allowed us to flourish.
And have taken the effort to resesrch, develop, and put into action public and corp. plans to mitigate and adapt to what we’ve done.
What I think is that your entire line of thought is exemplified with the label “Climatekids”. Look, I don’t like to insult you but you don’t understand science and physics. You are stuck in the era of Obama when “97% of all scientists believe in man-made global warming”.
No one that has ever worked in science could EVER believe that 97% of all scientists could agree on anything including whether chickens lay eggs. Who was part of the 97% that NASA quoted? The American Medical Association! Now there is some group that could be expected to know climatology. And the Boy Scouts of America.
This is an unlimited amount of information out there that shows that there has been warming between 1898 and 1940, but thanks to NASA fiddling with the data we can’t really tell if there has actually been any warming since then. And the most we look into it the more questions arise.
Some dumbass study looked into the dilatory effects of higher levels of CO2 on the plants. They discovered that the higher levels of CO2 cause reductions in protein, zinc and vitamin A production in plants. What they fail to say is that greenhouses normally run 550 ppm NOW. Or that this can easily be countered by using different types of plant food as most farmers do.
If you want to believe that you world is coming to an end then perhaps you ought to sell everything you have and go see the hot spots in Europe. Go see the Wailing Wall in Jerusalem. See the pyramids in Egypt. Make the most of your short time on Earth because men are destroying the planet right? I watched so many people kill themselves with drugs because, “like dude, there’s no future here” that I can’t count them. The Flower generation was as stupid as the Millennials.
Yet we have multiple studies, multiple databases, multiple methodologies all pointing to similar conclusions.
And, as far as I’ve seen, a paper by Lord Monkton and a bunch of comment thread, and some denialist blog posts saying they’re wrong.
I’ll go with reputable, repeatable research over incredulity
“No one that has ever worked in science could EVER believe that 97% of all scientists could agree on anything including whether chickens lay eggs. “
Then perhaps you ought to explain that to Congress because they actually caught NOAA manufacturing false data:
https://www.thenewamerican.com/tech/environment/item/25472-congress-investigates-fraudulent-science-used-by-noaa-to-push-un-global-warming-treaty
You missed something….
Quote?
Gone missing….
Here’s one:
“…published a 4,000-plus word exposé on the NOAA/Karl study on the prestigious website of Dr. Judith Curry…”
No mention of actual official action, sanction, no mention of actual journal published work
… just conservative political commentary .
Or as Stein put it; ‘there’s no there there’.
That’s an opinion piece in the John Birch Society newsletter, and, of course, it grossly distorts the facts. Congress didn’t catch NOAA manufacturing anything. Despite the noise in political opinion outlets like Newamerican, Dr. Bates doesn’t actually fault the scientific work Karl and his team did. Bates had designed a new validation and archiving system for NOAA, and it wasn’t ready in time for Karl’s project to use it. So Karl decided early in the project to keep using the system already in production. Bates wanted him to delay his project so it could use his new system and Karl refused. All of his complaints about Karl’s operation boil down to that dispute.
Apparently you’re one of those people to who “John Birch” has some negative meaning. Have you ever read anything published by them or are you simply the run-of-the-mill hack who follows the social media where someone said something negative about them and so you feel compelled to follow them?
If that isn’t enough try this one: https://tinyurl.com/y79xpfng or https://tinyurl.com/y75yoq4k or if you have the time: https://www.youtube.com/watch?v=DJBDI7jVMqM
Ah, another paid for denialist blog talking point brought forward “thanks to NASA fiddling “.
Thanks.
The use of the word “denialist” fits you perfectly. Anyone that uses that term simply is an incompetent boob. Since you don’t know anything about science you even have to invent a word for those who do!
Check the first example sentence…..
denialist
NOUN
A person who refuses to admit the truth of a concept or proposition that is supported by the majority of scientific or historical evidence.
‘the small minority of very vocal climate change denialists’
as modifier ‘the denialist view’
More example sentences
‘To the skeptics’ discomfort, their arguments are frequently quoted by the denialists.’
‘So far the pattern is for the emails to look a lot less suspicious once they’re put into context, and for the denialists to oversell what they’ve found.’
‘Since the denialists are denying, drastic measures are required.’
‘While the greenhouse denialists reject such scenarios outright, more hard-headed ruling-class planners take them more seriously.’
‘It is probably true that The Day After Tomorrow’s special effects-driven excesses have given the greenhouse denialists a propaganda free kick.’
‘Those who did speak up were “bludgeoned quite strongly” and labelled denialists.’
‘He hints darkly that, though some ‘denialists’ are ‘not evil’, others ‘cross the line between what could arguably be protected free speech’.’
‘Then there’s the well-funded greenhouse denialist think-tanks on the lookout for any evidence, argument or anecdote that might raise public doubts – legitimate or otherwise – about the growing strength of the scientific consensus.’
‘And just, by the by, you are about the third or fourth left-winger I have seen on the net saying that the dissidents “are more properly termed denialists”.’
‘Thank you for Talbot’s excellent series of articles debunking the myths propagated by the AIDS denialists.’
‘The HIV denialists do not all belong in one category.’
‘But denialists have never been interested in understanding the science, after all, if they understood it, they could not be in denial anymore.’
‘They are the problem, and they need to acknowledge that fact and start cleaning up their own mess rather than spouting denialist rhetoric.’
‘Until recently, AIDS researchers and activists in the United States tended to regard the denialists with derision, assuming they would fade away.’
‘He came under the influence of a group of maverick scientists known as Aids denialists.’
‘The denialist position within the government has put the fear of God into the medical establishment, who will do nothing to counter it.’
‘But many in the medical establishment say the sacking of her deputy is evidence that he remains an “Aids denialist” who questions the link between HIV and the disease.’
‘The denialist side was actively subverting the peer review process.’
‘We need to recognise that the denialist movement is a true grass-roots phenomenon, though this does not make it any less reactionary.’
https://en.oxforddictionaries.com/definition/denialist
You are really a hoot. There is also dictionary definitions of Maui Wowie and Acapulco Gold. This does not mean that it wasn’t an invented term by people like you for those who know what they’re talking about.
Wow.
Wowie
You’ve jumped the shark.
“invented term ”
I wonder now if we’re not headed off into some Chomskian linguistic diatribe….
Ah… there’s a solid critique “Some dumbass study looked into…”
This from the guy whose reference was “Climate Kids”.
And quotes from AR5
And nearly a dozen sources… None of whitch you’ve been able to argue are not accueate. Which is why you’re reduced to two logical fallacies as your sole source of argument.
And a leap into the hedge…
“The Flower generation was as stupid as the Millennials.”
Yet you aren’t capable of understanding a paper written mathematically proving that NASA and NOAA manufactured data to prove what the environmentalists wanted proven. You’re showing yourself less capable by the second.
Tinfoil….
“..NASA and NOAA manufactured data to prove what the environmentalists wanted proven…”
No math needed.
Thanks
Also see:
“Who was part of the 97% that NASA quoted? The American Medical Association! Now there is some group that could be expected to know climatology. And the Boy Scouts of America.”
With no examples.
“And the most we look into it the more questions arise.”
Thanks
Leading off with logical fallacies is never a good idea….
“What I think is that your entire line of thought is exemplified with the label “Climatekids”. “
Where did the “undersigned” get their collaborative work published?
You simply cannot keep yourself from exposing your total ignorance of science. 99% of all studies are never published in public literature. The AAAS would publish a very small amount. Where do you suppose the rest would be published?
In extremely low distribution specialty publications like “American Journal of Biochemistry and Biotechnology” or “American Journal of Immunology”. But you have my permission to continue with your supreme stupidity.
Fonzie tried to bolster sinking ratings. That isn’t a good technique for trying to prove an argument.
“99% of all studies are never published in public literature. “
“The description of how a greenhouse works is incorrect.”
Noted: you make no effort to show who has a correct version, or produce your own explanation.
Or accept it as an analogy.
If you don’t know how and why a greenhouse works why don’t you look it up and then look at the stupid explanation Mann makes in his paper? Exactly why do you post if you are incapable of looking things up beyond Climatekids?
Quotes.
Cites.
Gone missing.
Understanding what an analogy is and why they are used.
Gone missing
I do not offer “quotes” to someone that can’t understand them. I do not need to cite anything since your jackass idea that there is ANY analogy between a greenhouse and the way CO2 is supposed to act is totally incorrect.
Run back to Climatekids and cry.
Meanwhile, the rest of the world is acting on what the observations, models, theory all agree on.
Here is a compilation of resources discussing what a complete analysis of the body of literature says. I’ll stick with reputable research, not what some anonymous Internet commenter wants to argue about whether greenhouse is an analogy or not..
“The likely range of the human contribution to the global mean temperature increase over the period 1951–2010 is 1.1° to 1.4°F (0.6° to 0.8°C), and the central estimate of the observed warming of 1.2°F (0.65°C) lies within this range (high confidence). This translates to a likely human contribution of 92%–123% of the observed 1951–2010 change. The likely contributions of natural forcing and internal variability to global temperature change over that period are minor (high confidence). (Ch. 3; Fig. ES.2)”
USGCRP, 2017: Climate Science Special Report: Fourth National Climate Assessment, Volume I [Wuebbles, D.J., D.W. Fahey, K.A. Hibbard, D.J. Dokken, B.C. Stewart, and T.K. Maycock (eds.)]. U.S. Global Change Research Program, Washington, DC, USA, 470 pp., doi: 10.7930/J0J964J6
WHAT WE KNOW
THE REALITY, RISKS, AND RESPONSE TO CLIMATE CHANGE
The overwhelming evidence of human-caused climate change documents both current impacts with significant costs and extraordinary future risks to society and natural systems. The scientific community has convened conferences, published reports, spoken out at forums and proclaimed, through statements by virtually every national scientific academy and relevant major scientific organization — including the American Association for the Advancement of Science (AAAS) — that climate change puts the well-being of people of all nations at risk. http://whatweknow.aaas.org/get-the-facts/
What’s Really Warming the World? Climate deniers blame natural factors; NASA data proves otherwise
https://www.bloomberg.com/graphics/2015-whats-warming-the-world/
What is climate change? http://www.metoffice.gov.uk/climate-guide
Environment and Climate Change Canada https://www.ec.gc.ca/cc/
European Climate Adaptation Platform (CLIMATE-ADAPT) http://climate-adapt.eea.europa.eu
Cornell Climate Change http://climatechange.cornell.edu
republicEn: Engaging Conservatives https://www.climatechangecommunication.org/republicen/
George Mason University Center for Climate Change Communication https://www.climatechangecommunication.org
EARTH Institute http://earth.columbia.edu/articles/view/2124
And the science condensed :
D.3 Detection and Attribution of Climate Change
Human influence has been detected in warming of the atmosphere and the ocean, in changes in the global water cycle, in reductions in snow and ice, in global mean sea level rise, and in changes in some climate extremes (see Figure SPM.6 and Table SPM.1). This evidence for human influence has grown since AR4. It is extremely likely that human influence has been the dominant cause of the observed warming since the mid-20th century. {10.3–10.6, 10.9}
• It is extremely likely that more than half of the observed increase in global average surface temperature from 1951 to 2010 was caused by the anthropogenic increase in greenhouse gas concentrations and other anthropogenic forcings together. The best estimate of the human-induced contribution to warming is similar to the observed warming over this period. {10.3}
• Greenhouse gases contributed a global mean surface warming likely to be in the range of 0.5°C to 1.3°C over the period 1951 to 2010, with the contributions from other anthropogenic forcings, including the cooling effect of aerosols, likely to be in the range of −0.6°C to 0.1°C. The contribution from natural forcings is likely to be in the range of −0.1°C to 0.1°C, and from natural internal variability is likely to be in the range of −0.1°C to 0.1°C. Together these assessed contributions are consistent with the observed warming of approximately 0.6°C to 0.7°C over this period. {10.3}
• Over every continental region except Antarctica, anthropogenic forcings have likely made a substantial contribution to surface temperature increases since the mid-20th century (see Figure SPM.6). For Antarctica, large observational uncertainties result in low confidence that anthropogenic forcings have contributed to the observed warming averaged over available stations. It is likely that there has been an anthropogenic contribution to the very substantial Arctic warming since the mid-20th century. {2.4, 10.3}
• It is very likely that anthropogenic influence, particularly greenhouse gases and stratospheric ozone depletion, has led to a detectable observed pattern of tropospheric warming and a corresponding cooling in the lower stratosphere since 1961. {2.4, 9.4, 10.3}
• It is very likely that anthropogenic forcings have made a substantial contribution to increases in global upper ocean heat content (0–700 m) observed since the 1970s (see Figure SPM.6). There is evidence for human influence in some individual ocean basins. {3.2, 10.4}
• It is likely that anthropogenic influences have affected the global water cycle since 1960. Anthropogenic influences have contributed to observed increases in atmospheric moisture content in the atmosphere (medium confidence), to global scale changes in precipitation patterns over land (medium confidence), to intensification of heavy precipitation over land regions where data are sufficient (medium confidence), and to changes in surface and sub-surface ocean salinity (very likely). {2.5, 2.6, 3.3, 7.6, 10.3, 10.4}
SPM WG1 AR5
If there are errors in any of those resources, quote, cite, and explain why w links to supporting science.
Til then, all you’ve done is a logical fallacy -Attack the Messenger.
And cherry picking.
And attempted insulting by example.
Agreed. I think of the greenhouse effect as a probable nett cooling effect: daytime solar insolation warms Earth, especially at or near equator, mostly oceans. This evaporates water as vapour which rises & forms clouds, which reflect back to space the Sun’s radiation. Nightime these clouds reflect Earth’s heat,which is trying to escape to space, back down to Earth.
This keeps the Tropics temperate both day & night, while deserts at temperate latitudes will boil daytime & freeze nightime.
As a greenhouse gas, CO2 is negligible, especially over 400 ppmv, where we are now.
Make sense?
can you support your claim?
Climatologist Dr. Tim Ball’s book: Human Caused Global Warming
the biggest deception in history.
Page 27: Good graphic: Greenhouse gases are approx 2% of total atmosphere. 4% of greenhouse gases are CO2. 3.4% of Co2 is caused by human activity.
do the maths. Human CO2 drives the climate? Bollix.
Animals alone breath out 25 times human CO2.
The CO2 contributions of the mid-ocean 40,000 mile volcanic ridges are uncounted.
Page 56 : 400,000 year ice core records show warming ALWAYS preceded increases in CO2, as warming oceans outgas CO2. The time-lag is about 800 years plus or minus 200 years.
Warming is a cause of increased CO2, not an effect.
Page 57: Graph showing NO correlation over 600 Million years CO2 vs Earth’s tropical & ice ages.
Geology Prof Ian Plimer’s book: Heaven and Earth global warming: the missing science.
Page 180: At present (2009) 186 Billion tonnes CO2 enter the atmosphere from all sources, of which 3.3% comes from human activities. More than 100 Bln tonnes (57%) from oceans & 71 Bln tonnes is exhaled by animals (including humans).
Pages 374 &375: increases in CO2 have a logarithmically decreasing effect on temperatures. Graph to show negligible effect of CO2 on temperatures above 400 ppmv, where we are now.
Page 366: All CO2 does is slow down heat loss.
(IE, it does NOT cause heat gain. That’s the Sun’s job.)
Page 369: more than 98% of the effect of atmospheric greenhouse gases is due to water vapour. Page 370: two good graphs.
I believe I am safe in my statements.
Book: Heaven and Earth global warming: the missing science
Prof. of geology Ian Plimer.
Book: Human Caused Global Warming the biggest deception in history
Climatologist Dr. Tim Ball.
drtimball.com
Book: Climate Change the facts 2017
22 essays, edited by Jennifer Marohasy.
How does a TRACE gas do all this Hogwarts magic? Can you explain it?
Charles – indeed it must be magic. What is more magic is that the people that talk about global warming don’t have any educations in science and yet will argue all day that they know something because they read an article in Popular Science.
YOU claim CO2 was LOW to begin with….upon what basis do YOU make that determination.
HUMAN’S and Nearly Every Animal & Plant on earth have
NEVER EXISTED WITH ATMOSPHERIC GASES AT THIS LEVEL
….let alone where your advocacy of CO2 WILL BE LEADING US ! ! ! !
UPON WHAT SKILL SET ARE YOU PONTIFICATING SAINT HOOD FOR CO2
Exactly what sewer do they pull you kind of creatures out of? The original Earth’s atmosphere was about 60% Nitrogen and 39% CO2. Plant life evolved from that, and eventually animal life evolved to take advantage of plant life. In the last full blown ice age the atmosphere was still 10% CO2. That was about 110,000 to 11,000 years ago. We are presently in an Interglacial Period in that same Ice Age.
If you have no education stop trying to spread ignorance around.
When someone is as stupid as you, you simply aren’t worth the time to bother with.
What if addressing global warming didn’t do what you fear, but would instead make America stronger, wealthier, and healthier?
Here is a group of leading Conservative economists that have proposed a solution to address global warming from greenhouse gas emissions from fossil fuels with a market-based, revenue neutral solution:
http://clcouncil.org
Carbon Dividends would make America stronger.
The reason the Clcouncil.org and others think this is important to do is because serious people take scientific consensus seriously. Here is the executive summary of the Fourth National Climate Assessment. Read the highlights for a fact-based summary of the state of the science:
https://science2017.globalchange.gov/chapter/executive-summary/
Here is why some people are confused about the validity of the science: https://www.scientificamerican.com/article/exxon-knew-about-climate-change-almost-40-years-ago/
Heartland Institute and CFACT are two of the PR firms that got fossil fuel industry money and promote Doubt about the real science. Watch ‘Merchants of Doubt’ to get the big picture.
More evidence supporting ” Here is why some people are confused about the validity of the science:”
Institutionalizing delay: foundation funding and the creation of U.S. climate change counter-movement organizations
” This paper conducts an analysis of the financial resource mobilization of the organizations that make up the climate change counter-movement (CCCM) in the United States. Utilizing IRS data, total annual income is compiled for a sample of CCCM organizations (including advocacy organizations, think tanks, and trade associations). These data are coupled with IRS data on philanthropic foundation funding of these CCCM organizations contained in the Foundation Center’s data base. This results in a data sample that contains financial information for the time period 2003 to 2010 on the annual income of 91 CCCM organizations funded by 140 different foundations. An examination of these data shows that these 91 CCCM organizations have an annual income of just over $900 million, with an annual average of $64 million in identifiable foundation support. The overwhelming majority of the philanthropic support comes from conservative foundations. Additionally, there is evidence of a trend toward concealing the sources of CCCM funding through the use of donor directed philanthropies.”
http://drexel.edu/~/media/Files/now/pdfs/Institutionalizing%20Delay%20-%20Climatic%20Change.ashx?la=en
” “The climate change countermovement has had a real political and ecological impact on the failure of the world to act on the issue of global warming,” said Brulle. “Like a play on Broadway, the countermovement has stars in the spotlight – often prominent contrarian scientists or conservative politicians – but behind the stars is an organizational structure of directors, script writers and producers, in the form of conservative foundations. If you want to understand what’s driving this movement, you have to look at what’s going on behind the scenes.”
To uncover how the countermovement was built and maintained, Brulle developed a listing of 118 important climate denial organizations in the U.S. He then coded data on philanthropic funding for each organization, combining information from the Foundation Center with financial data submitted by organizations to the Internal Revenue Service.
The final sample for analysis consisted of 140 foundations making 5,299 grants totaling $558 million to 91 organizations from 2003 to 2010. The data shows that these 91 organizations have an annual income of just over $900 million, with an annual average of $64 million in identifiable foundation support. Since the majority of the organizations are multiple focus organizations, not all of this income was devoted to climate change activities, Brulle notes.”
Not Just the Koch Brothers: New Drexel Study Reveals Funders Behind the Climate Change Denial Effort
http://drexel.edu/now/archive/2013/December/Climate-Change/
There once was a polar bear – science vs the blogosphere
By Bart Verheggen
https://ourchangingclimate.wordpress.com/2017/11/29/there-once-was-a-polar-bear-science-vs-the-blogosphere/
longer
https://ourchangingclimate.wordpress.com/2017/12/22/how-blogs-convey-and-distort-scientific-information-about-polar-bears-and-arctic-sea-ice/
…and Then There’s Physics also discusses it at
Polar Bears and Arctic sea ice
https://andthentheresphysics.wordpress.com/2017/12/03/polar-bears-and-arctic-sea-ice/
Those are great resources, thanks.
It’s difficult to understand how anyone can let themselves be fooled by AGW deniers any more, when confronted with the fact that the fossil fuel industry has spent a billion dollars a year for thirty years to get people to lie about the science to delay addressing carbon emissions from fossil fuels.
Here are some of my favorites…
Exxon knew 40 years ago: https://www.scientificamerican.com/article/exxon-knew-about-climate-change-almost-40-years-ago/
Exxon vs the world:
https://www.npr.org/sections/13.7/2016/11/30/503825417/exxonmobil-vs-the-world
The legal implications are closing in on the fossil fuel industry. I hope the AGW deniers we see have lots invested in the fossil fuel majors stocks. I don’t think it will be much longer before the big industry players are held legally responsible for causing extremely high costs by delaying rational action for decades: https://insideclimatenews.org/news/09112017/climate-change-sea-level-rise-fossil-fuel-exxon-chevron-bp-study
And of course there is also Naomi Oreskes and ‘Merchants of Doubt’. https://youtu.be/LNPRgR-2o-A
Thanks! And thanks for the further resources, also.
The denialism runs deep and swift….
When published research on denialist funding is given, the only response is ‘can’t be. Doesn’t fit what my employers told me’
David Wojick➡ Robert
9 days ago
“That $900 million a year is ridiculous. I can believe $9 million, maybe even $19 million, but that is about it. The number of professional skeptics is maybe about a hundred, including me, …”
https://disqus.com/home/discussion/cfact/the_greens_are_losing_the_international_climate_fight/#comment-3676987757
https://disqus.com/home/discussion/cfact/the_greens_are_losing_the_international_climate_fight/#comment-3679008746
A billion dollars a year is nothing to an industry that clears a hundred billion or two in profit a year. It’s a drop in the bucket, and has succeeded in delaying action and keeping those profits flowing so from a stockholder’s perspective was well worth it. Well, for a stockholder who doesn’t live on Earth or have any kids on Earth that is.
One small consolation with the trumptastic Nov ’16 is the reaction. Getting some regulations overturned is actually fueling a bigger, stronger reaction. Hence the ‘retirements’.
Sorry John – that isn’t conservative. It is a sort of victimization that is a little difficult for none economists to understand. Those founding companies are the ones that would grow rich trading in carbon credits. Certainly the American economy would grow. But it would grow in the sector that trades these credits.
You’ve got the Carbon Dividends solution confused with cap and trade, but they are as different as apples and oranges.
Thanks for looking, but spend a little more time reading about the Carbon Dividends policy and you’ll see. There are no carbon credits involved. (I agree, cap and trade is a convoluted solution only a politician could love). Carbon Dividends is a direct fee on fossil fuel production based on the greenhouse emissions of coal, oil, and natural gas, and the money collected is returned to American households each month on an equal basis.
https://www.clcouncil.org/our-plan/
Carbon Dividends has the backing of leading Conservative economists, past treasury secretaries of and secretaries of state (of Republican administrations):
https://www.clcouncil.org/founding-members/
As far as being a conservative plan, what could be more conservative than an efficient, market-based solution to conserve our natural resources for future generations that doesn’t grow government?
The big business endorsements can be justified for two reasons: addressing the global warming problem with a carbon fee, dividend, and border adjustment solution is necessary and would grow the economy, which will be good for business. The fourth pillar, eliminating regulation, will help businesses by reducing costs. If you just want the first parts, take a look at this policy instead: http://citizensclimatelobby.org/basics-carbon-fee-dividend
Yours is yet another BIG LIE….by the BIG GREEDY
FOSSIL FUEL MONOPOLY ! !
take for example:
1. Breitbart’s James Delingpole CLAIMED 400 new scientific papers show global warming is a myth.
Numerous studies have found near-unanimous scientific agreement on human-caused climate change, with perhaps the most well-known study on the matter finding that 97 percent of scientific papers taking a position on the cause of global warming agree that humans are behind it.
And this year,
a review of the 3 percent of papers that deny climate change found that they were ALL FLAWED.
Nonetheless, Breitbart writer Delingpole claimed that 400 scientific papers published this year demonstrated that climate change is a “myth,” basing his article on a post on the denialist blog No Tricks Zone.
The fact-checking website Snopes roundly debunked Delingpole’s article, giving it a “False” verdict after speaking with authors of some of the cited papers who said their work was grossly misinterpreted or misrepresented….”
I have reviewed over 100 of the Scientists who supposedly were critical of Global Warming Science…ALL but ONE are strong supports and contributors to the preponderance of evidence for Global Warming and threatening CLIMATE CHANGES !
Tell us what credentials you have to understand the first thing about any of this research. http://notrickszone.com/2017/09/04/ph-d-physicist-uses-empirical-data-to-assert-co2-greenhouse-theory-a-phantasm-to-be-neglected/#comment-1229248
Investigate for yourself who created WWF in 1962 and what they were promoting. Combine the anti-science paradigm with MK-ULTRA drugging of American youth and Adorno’s radio music project. Frankfort Schoo trained Theodore Adorno worked with the Tavistock Institute, an arm of British Intelligence. Together with the Congress For Cultural Freedom these organizations succeeded in creating an anti-science paradigm shift among the boomer population. In other words, the Anglo-American oligarchy created the New Left/Green counter-culture for the purpose of destroying the United States committee the to scientific and technological science.
WHAT?
Kill off 6 billion people.
WHAT DO YOU SMOKE ?
Killing off 6 billion people is the anti human Green agenda.
what an ignorant raving of a self delusional ideologue
Anyone can post to youtube. It doesn’t mean what they are posting is science… and on a fossil-funded propaganda outlet like this one, it’s really wiser to be skeptical.
http://www.desmogblog.com/committee-constructive-tomorrow
Indeed anyone can. But the Oregon Petition will only accept signatures from highly educated scientists. Presently they have over 31,000 signatures and over 9,000 of them from PhD’s stating that AGW does not exist. On the opposite hand the IPCC paper was supposedly authored by 2,500 “scientists” but the majority of these “scientists” were politicians without a lick of scientific training. And MANY of the scientists on that list claim that their work was either totally misrepresented or simply marked as “for AGW” when they were neutral. On NASA’s part we have scientists having to SUE NASA to get their names off of the “FOR AGW” list as NASA simply took anyone that didn’t give an absolute “no” as being “for”. And come on – 97% of all scientists for? That is an impossible number. Not to mention that 97% includes the American Medical Assoc. and the Boys Scout of America. Now there are some real climate scientists.
desmogblog is nothing more than a PR garbage site. Why would you use that as a reference?
https://tinyurl.com/y6wnmt25 is a list of 150 papers disproving the claims of global warming.
https://tinyurl.com/gtn5wpl is an article that shows that the IPCC employed STUDENTS and not qualified experts as their “scientists”.
https://tinyurl.com/ycce23nl is a list of seven papers that actually predict global cooling as one would expect since warm periods normally have run their course in a little over a century.
https://tinyurl.com/y79xpfng This pretty clearly demonstrates that NASA “fixed” the data in a manner that plainly shows a lot of hanky-panky going on.
As you say, ANYONE can make a youTube video but not anyone is famous PhD’s and there are NUMEROUS anti-global warming videos by just such professors.
https://www.youtube.com/watch?v=sq3lvKj7qmk
https://www.youtube.com/watch?v=EhW-B2udhQw
https://www.youtube.com/watch?v=LyztWNW2HsM
The entire Internet is covered with real science that proves AGW is a hoax and a fake. WHY would incompetent fools posting on these sites that haven’t one year of high school science to their names the one’s arguing that AGW is real? Don’t you think about these peculiarities for one second?
Stop lazily citing the silly Oregon Petition project – it is unreliable, thoroughly debunked rubbish. Organized and coordinated by Art Robinson – he hasn’t published a single peer-reviewed article on climate science. Robinson was president of the Oregon Institute of Science and Medicine a political advocacy group that is based on ideology not science. He has extreme views on climate change, AIDS, homosexuality and evolution. Go look it up yourself and apply some basic critical thinking. The OISM’s silly “Journal” of American Physicians and Surgeons masquerades as a scientific journal but is listed by Quackwatch as unreliable and untrustworthy…”a purveyor of utter nonsense”.
And yet as is usual with you True Believers, I don’t see any citations of these supposed “debunkings”. Only your usual sniveling that someone else said that someone else said that someone else said. As with all stupid asses you want to use one or two extremists to discredit tens of thousands of great scientists. I would say that you should be ashamed of yourself but True Believers don’t have that capacity.
Spot on.
Very well said, you have the picture, Prometheus11.
http://www.green-agenda.com
The “Friends of Science” are anything but.
Perhaps you’d consider the actuarial approach recommended here: https://www.scientificamerican.com/article/the-window-is-closing-to-avoid-dangerous-global-warming/
,,though I’m guessing you’ll just add Scientic American magazine to your vast list of conspirators.
All you did was refer to an article that did not address any of the scientific facts that I referred to.
This is not a scientific argument.
Show that what I am saying is false or irrelevant. Otherwise you are just making an argument to authority. Doesn’t work in science.
You have no science on your side – you have only a string of unsubstantiated claims from gawd-knows-where and a youtube clip of an electrical engineer speaking at a climate change denial conference.
https://www.desmogblog.com/steve-goreham
“You have no science on your side” – unsubstantiated claim
“you have only a string of unsubstantiated claims from gawd-knows-where” – you have not disputed even one of them
“youtube clip of an electrical engineer speaking at a climate change denial conference” – more ad hominem attacks that are irrelevant in a scientific discussion
http://www.populartechnology.net/2011/04/truth-about-desmogblog.html
DeSmogBlog is a smear site founded by a scientifically unqualified public relations man, James Hoggan and funded by a convicted money launderer, John Lefebvre. The irony here is their favorite tactic is to attempt to smear those they disagree with as funded by “dirty money”.
Since its creation in 2006 the site has done nothing but post poorly researched propaganda with a clear intent to smear respected scientists, policy analysts or groups who dare oppose an alarmist position on global warming.
My statement that you have no science is substantiated by the fact that all of your idiocy is (wait for it) completely without substantiation!
Try providing your sources for your laundry list of bullshit – and using better ones than “popular technology” to quote about Desmogblog, because PT is just another in the circle-jerk of denialist sites that constantly reference each other rather than scientific sources or facts. Here’s a hint: The misfit computer geeks writing and editing at PT aren’t scientists and using a search engine isn’t scientific research.
BTW, the facts about John Lefebvre are here: https://www.creators.com/read/jacob-sullum/02/07/netellers-open-and-honest-conspiracy
Facts do matter. Your slander doesn’t, because whether Lefebvre’s fortune came from gambling is immaterial to the fact that your boy Steve Goreham has no credentials whatsoever that qualify him to speak on the topic of climate change.
You seem determined to avoid a discussion of science. I asked you to pick one of my 8 statements to dispute. All you do is name call.
Lets start with number 1.Every year the temperature swings about 60 degrees F. We are supposedly in a crisis because the temp rose 1.4F (.8C) over 100 years.
Have you noticed that the temp in the summer is 90F and in the winter 30F. That is an annual swing of 60 degrees. Do you dispute that?
It is religious dogma for alarmists that ” the temp rose 1.4F (.8C) over 100 years”. Do you dispute that?
If you do not dispute either of these statements then you must accept my first statement as true.
You continue to insist that you are ‘sciencing’ when you are clearly unfamiliar with the concept. Science requires verifiable data. It requires parameters. You have provided neither in your sweeping claims.
At which point on the planet does the temperature swing about 60°F? Where on the planet is the temperature 90°F in the summer and 30°F in the winter? Why does it matter in a discussion of the impact of global warming?
And the globe is warming, by more than the “religious dogma for alarmists” you describe. It approached .99°C last year:
https://www.theguardian.com/environment/climate-consensus-97-per-cent/2017/jul/31/2017-is-so-far-the-second-hottest-year-on-record-thanks-to-global-warming#img-3
Is it possible for you to discuss something without name calling?
My first claim is:
“1.Every year the temperature swings about 60 degrees F. We are supposedly in a crisis because the temp rose 1.4F (.8C) over 100 years.”
You quoted the Guardian newspaper for an increase of .99C. I believe that you may have made a typo and that should be .94C.
I was referencing the alarmist Bible, the IPCC AR5 Summary for Policymakers p5
“The globally averaged combined land and ocean surface temperature data as calculated by a linear trend, show a warming
of 0.85 [0.65 to 1.06] °C, over the period 1880 to 2012”
http://www.ipcc.ch/pdf/assessment-report/ar5/wg1/WG1AR5_SPM_FINAL.pdf
The IPCC is claiming a crisis based upon an increase of .85C (1.5F) over a period of 132 years.
You inquired about the location for temperature swings.
http://www.weatherexplained.com/Vol-1/Record-Setting-Weather.html has some interesting data.
For Alabama, the record high temp is 112F and low is -27F a difference of 139F.
For Colorado, the record high temp is 118F and low is -61F a difference of 179F.
For Maine, the record high temp is 105F and low is -48F a difference of 153F.
Browning Montana experienced a change in temp from 44F to -56F, a difference of 100F in 24 hours
Granville ND experienced a change in temp from -33F to 50F, a difference of 83F in 12 hours
You asked “Why does it matter in a discussion of the impact of global warming?”
The purpose is to put a change of .85C (1.5F) over 132 years in context. Daily swings in temperature of 15F are common and annual swings in temperature of 60F are common. Changes in temp over 24 hours of 83F and 100F have been recorded.
It matters because this temperature observation (.85C over 132 years) is used to justify trillions of dollars of investment. If we do not have a climate crisis, this money could be used to provide clean drinking water and sewage treatment for billions of people.
You poor, delicate hypocritical little snowflake.
That is the last name I shall call you.
This is a collosal waste of time. You are unable to ever consider facts that disturb your conspiracy-driven world view. You cannot simply admit that the world has continued to warm since 2012. You contradict the facts presented without justification or a reference provided for your own claim once again (.94°C vs .99°C – really?).
And you make absurdly bizarre claims about TRILLIONS of dollars. And ridiculous assumptions that the few billion actually devoted to the cause last year would have been re-deployed in the third world if had not been spent in the interest of saving our own asses from our own developing crisis,
‘the world has continued to warm since 2012’
Maybe so.
But so what?
Is a warmer, greener world a better place than a colder, greyer one? Or not?
Please show your working.
As of January 2014 according to Gina McCarthy. There has been no temp increase over the past decade. That statement proves Michael Mann ‘s Global Warming Hiatus.
In all fairness since NASA has manufactured data instead of presenting the actual temperature records you can’t blame other scientists for arriving at the wrong answers using NASA’s data.
Do you think it is fraudulent to adjust raw data to account for biases and anomalies in the instruments and timings of measurements?
So we’re to ignore the record back-to-back temperatures seen in 2014, 2015 and 2016?
Why is that?
Is it the same reasoning that has you ignoring the fact that five of the annual temperatures in the decade you claim was not warming actually ranked in the top ten of all time during that period?
Did you look up EPA Secretary Gina McCarthy’ s Senate Testimony? Do you know who Josh Willis is? The Temperature Anomaly is a fabrication. It is not the real Global Mean Temperature. You keep believing in your make believe temp anomaly.
I’ve read it. and no where does she say Temperatures have not increased.
Even Denier Dr. John Christy has finally admitted the TRUTH….over 1.19C in a little over 100 years.
versus historical Natural Cyclical temperature changes that AVERAGE 1C in 7500 years.
You couldn’t have read it. It’s a video. You’re wrong again as usual. Global Temp feel in the mid 1200s. It dropped from 63 f to 53f. Your 1.5 increase is well within the margin of error. It did start to warm up in the 1820s.
How does a TRACE gas increase global temp?
IT is CALLED the CONGRESSIONAL RECORD…every hearing is recorded and transcribed.
you said
“Global Temp feel in the mid 1200s”
Medieval warm period (MWP), also called medieval warm epoch or little climatic optimum, brief climatic interval that is hypothesized to have occurred from approximately 900 ce to 1300 (roughly coinciding with the Middle Ages in Europe),”
This is the Holocene inter glacial warm period
World Wide It peaked about 8000 years ago
World Wide Temps have been falling slowly since then
That ENDED rather abruptly around 1750-1780
Thomas Jefferson noticed and postulated that human activities were change the climate
Alexander von Humboldt noticed and postulated that is was human caused “CLIMATE CHANGE”
http://www.realclimate.org/images//Marcott.png
I have Biology, History, and Art
There is a preponderance of trees that don’t agree with the MAP.. The coast redwood, giant sequioia, creosote Bush circles, and the ancient Bristlecone Pine, they all have tree rings from the 1200s showing it got colder. History in the 1200s William Wallace was born and at that time no one was talking about warm days. In the 1200s many cultures collapsed due to global cooling. Greenland started to whiten up, the end of
This is a short list of cultures that didn’t make it into the 1300s due to global cooling.
DANISH NORDIC EMPIRE
Mayays, Chocoan, Timbuktu, this is a,short list. Art if you notice that people in the paintings are wearing lots of clothes as if it is cold all the time.
“You poor, delicate hypocritical little snowflake. “ You must have learned your debating skills at Yale.
“You contradict the facts presented without justification or a reference provided for your own claim once again (.94°C vs .99°C – really?). “
Obviously you also learned to read at Yale. The first sentence of YOUR reference is “With the first six months of 2017 in the books, average global surface temperatures so far this year are 0.94°C above the 1950–1980 average, according to NASA. “ Maybe you can explain how you read that as a .99C increase.
Your reference: https://www.theguardian.com/environment/climate-consensus-97-per-cent/2017/jul/31/2017-is-so-far-the-second-hottest-year-on-record-thanks-to-global-warming#img-3
My claim is not .94C. My claim is .85C over 132 years taken from IPCC AR5 Summary for Policy Makers, the Bible of the Greens.
“would have been re-deployed in the third world if it had not been spent in the interest of saving our own asses from our own developing crisis. “
If you are going to waste billions, never mind the trillions required to prevent Globull Warming, you might as well do something useful, as in save lives by improving drinking water and sewage treatment in the third world.
It would only take a few tens of millions to prevent 1 million African women and children dying from malaria every year if religious zealots in the Green movement were willing to admit that Saint Rachel Carson was just another purveyor of junk science and lift the ban on DDT.
But Green narcissist only think about themselves.
But maybe the Greens are not just selfish. Maybe they are also genocidal. After all their anti human religion regards humanity as a plague spreading across the surface of the world. And the “carrying capacity” of the Earth is only 1 billion. Something has to be done about the other 6 billion inhabitants of the world.
Just think, if you had been born 500 years ago, you would be sacrificing virgins to appease the weather gods rather than shutting down nuclear energy and coal plants.
ROTFL!
I do enjoy it when you double-down on your mistakes. You wouldn’t care to get together for a poker game, would you?
The 2017 reference has next-to-nothing to do with the 2016 reference, and even less to do with 2012. Do try to keep up.
BTW, I didn’t learn to read at Yale – but then again, I only spent a day there. Here in Canada, we learn to read starting in kindergarten, and are pretty much expected to have it mastered before leaving grade school. So sorry to hear about the deficiencies in education in your country.
Although it does explain the bizarre and illogical leaps you make with all your other assumptions…
I will ask you again – what are your credentials to make ANY comments regarding science?
What the greens are going for now is forced sterilization of Africans, Chinese and Indians. As astonishing as it is from the same mouths that scream “racism” if you tell a Asian joke (Asians are presently the highest paid ethnic group and obviously don’t need protection from high school students like LTJ) we are hearing that the only possibility of saving the world is depopulation. And where would it be necessary? The three countries mentioned. While the white elite don’t need such measures of course. Only the white lower classes.
Wow.
Where in the twisted recesses of your syphallitic brain did that nonsense come from?
Sorry but according to Dr. Roy Spenser, the head of the NASA weather satellite project launched in 1979, there hasn’t been any warming that is outside of the normal chaotic weather patterns. And the average temperature since 1979 has remained static. Obviously you are going to quote either NASA or papers written using the counterfeited NASA temperature records. But it has been proven that NASA “fixed” the temperature records and any papers written using that data are worthless.
https://thsresearch.files.wordpress.com/2017/05/ef-gast-data-research-report-062717.pdf
This paper establishes not just the fact that NASA has changed the raw data which is the worst thing a scientist can do but has done it in such a manner that even officials from the EPA peer reviewed this paper and agree with the findings.
‘ It requires parameters’
An example of where/how ‘it requires parameters’ would help my understanding.
He so obviously is uneducated I have to wonder. He is unaware that a parameter is nothing more than a single part of a set.
Even in little temperate UK I’ve measured a swing of over 60F between winter and summer temperatures.
So what’s the latitude, Latimer?
BTW, that’s an example of a parameter for you. Others to consider: altitude, longitude, period, median vs average vs extreme, the equipment used and its positioning – basically all the factors involved in making your results reproducible.
Ah .So a parameter is just another piece of data.
Why didn’t you say so? Does ‘parameter’ sound better? More tekkie?
In case you’re interested, I measured the minimum of -16C at Lat 56N, and the max of 34C at 51N. That’s a 50C (90F) range. All within our small island temperate maritime island.
I really cannot persuade myself that civilisation wil come to an end if teh average were to increase by 2C and the range therefore change to -14C to +36C
Can you?
Please show your working.
A parameter is not just another piece of data. Parameters are the specifics that allow others to verify the data you provide.
I fear the examiners at your old university are ashamed of you.
Your fear is unfounded. Sleep easy on their behalf.
Toodle pip.
As a simple question – if you don’t know what you’re talking about and it’s clear to anyone with an education – why are you posting?
…and why do I warrant so much of your attention whenever I do?
For a simple reason – you and your kind believe that you can lie about anything without response by those who know better. You are a jackass if you actually believe what you’ve published and you are a liar and a fool if you don’t.
…and yet I’ve consistently shown your claims to be false and misleading.
I might be a jackass (I’ve been called one by better women than you), but you seem to be less clever than this one – and unable to leave it alone.
Then give us a numbered list of what you have shown. Your claim that Mann has released his data is a total lie. He has not as proven by a court order for him to release it that he has ignored. You haven’t made one single point – instead you have spent your time here name calling because you have neither the ability nor knowledge to have anything of worth to say.
I have spent my time here being accused of name-calling by hypocritical people who have called me jackass, brown shirt and worse.
Actually you have spent your time here telling everyone that they didn’t know what they were talking about. You started by telling us all that a woman reporter with a degree in art knows more about science that real scientists do.
You then discounted any opinions of Edward Teller because he has died after signing the Oregon Petition.
Then YOU as a completely non-credentialed person who more than obviously is totally ignorant of science told everyone here that a man with a masters of science degree doesn’t know anything because he says that we don’t have any AGW.
You then went on to tell us all that anyone that you didn’t like didn’t know what they were talking about unless they agree with AGW.
You are so plainly a little man afraid of everyone around you that it’s funny. You show that you think you’ve been bullied and that you can “get even” with them with the anonymity of an Internet comment group.
Now be a good boy and go back to playing with your legos.
Once again you resort to making absurd assumptions (while knowing nothing about me) because you are incapable of factual debate.
I made no statements about any woman reporter. You continue to discount her reporting based primarily upon her sex, it would seem. Rather ridiculous, when you could be discussing the article.
And once again you resort to insults and namecalling. And then you hypocritically say that I’m the one trying to ‘get even’ here?
I’m trying to make it clear that the facts and the science support the thesis of AGW. This site exists solely to obfuscate those facts and deny the scientific consensus – which is why you are here, seeking comfort and support for your own delusion.
Reproducible? I doubt it. These were not measurements of a controlled experiment but of the weather itself. I don’t think weather is exactly reproducible.
Unless you have a weather maker?
If so, please can you arrange for my humble home at 51N, 1W to get the climate of the Loire Valley that we were promised 40 years ago.
I have been eagerly awaiting ‘global warming’ to have brought us this climatic improvement ever since.
But sadly without effect so far.
So it seems you “science” like our friend Stephen here – which is to say, not at all.
And like so many of the denialist ilk, you believed Al Gore and the sensationalist press, and have been disappointed. And for some reason you want to blame that on real scientists, rather than on the folks who wildly exaggerated their findings.
I fear the examiners at my old University disagree with you. They managed to award me not just one but two degrees in a ‘hard’ science… and unless chemistry has drastically changed in the last 30-odd years I imagine that those degrees are still pretty much valid today.
And FWIW my specialist subject was in computer modelling high-atmosphere reaction kinetics as as part of the ozone hole panic. Sadly my model was shown to be wrong ..as the actual data did not match predictions..a lesson it seems today’s ‘climate modellers’ are eventually learning too.
As to Al Gore, I doubt if that failed theologian could point to the Loire Valley on a map..no doubt – like so any of our transatlantic friends – thinking it somewhere beyond Cooba.
The predictions in question were made much nearer to home..by the climate alarmist/modellers from the UK Met Office. I will be seeing a few at a lecture ext week and will pass on your thoughts that they are not ‘real’ scientists.
Stay tooned (as I believe the expression is) for their gratitude-filled replies.
You have yet to show that you know anything. That all you are doing is complaining about others knowledge probably because it is so far evolved above yours that you appear a chimpanzee in comparison.
Let me guess – you don’t know a thing about weather? TODAY in the San Francisco bay area the temperature swing from morning until 4 pm will be from 36 degrees to 80 degrees.
Give some more of your deep knowledge obtained from the Guardian.
I could go through a great deal of effort to explain how the ground temperature monitoring since the end of the civil war has been deeply flawed. Moreover we could discuss how NASA was using ground temperature data from several sites around the world where there WERE NO GROUND STATIONS. But this is rather pointless. The True Believers here have their Church of the Global Warming and intend on staying their course.
Dr. Roy Spencer who was NASA director for the weather satellite program that started in 1979 make the point – there has been NO WARMING other than the normal chaotic weather patterns since the satellites were launched.
It’s odd that you dismiss DeSmogBlog as a “smear site” while linking to Popular Technology.
Why is that odd. At least Popular Technology is honest even if it targets a less educated market. DeSmogBlog is pure propaganda.
If you think that Popular Technology is an honest broker and not the politically-overdetermined bottom feeder it so obviously is, then you lack basic critical thinking skills.
I really dont read Popular Technology so I have no opinion on your assessment. DeSmogBlog on the other hand is definitely propaganda.
All of these references show that climate change is a hoax.
https://thsresearch.files.wordpress.com/2017/05/ef-gast-data-research-report-062717.pdf
https://cyclintom.wordpress.com/2016/06/17/climate-change-for-scientists/
https://stevengoddard.wordpress.com/2014/01/25/ir-expert-speaks-out-after-40-years-of-silence-its-the-water-vapor-stupid-and-not-the-co2/
As for honest temperture monitoring: If you look at
http://www.surfacestations.org/ you will discover almost no monitoring sites that didn’t have large errors.
http://principia-scientific.org/another-new-paper-slays-co2-greenhouse-gas-thought-experiment/
I could go on but the True Believers here can’t understand these papers so going into finer detail isn’t going to achieve anything.
I would like to meet you. I think that you and I could rapidly come to an understanding of what you know and what you do not.
I have looked at Popular Technology and DeSmogBlog.
Firstly, Popular Technology is extremely accurate. They don’t say that there isn’t climate change – they make the point that if there IS climate change it is small and manageable. And that man is unlikely to be the source of these small changes. That the 97% paper was written by Cook et al. in Australia and was purposely written in such a way as to mislead people.
DeSmogBlog: This is a looney Church of Global Warming advocates. They throw around key words that they think that they have taught people to fear; Big Oil, Brexit is bad, Anti-Wind (I own stock in PG&E and have access to their financial statements and wind and solar cost 10 times as much energy as they EVER develop), and get this one “Study: Babies With Low Birth Weights More Likely Near Pennsylvania Fracking Sites” What is fracking? Simply the pumping of WATER into the oil wells that causes the cracking of the rocks around the well and releases the addition petroleum and natural gas – this isn’t POSSIBLE to affect human birth.
“UK Government Won’t Say Why Theresa May’s Special Advisors Met with a Koch-Founded Think Tank” Another shot at demeaning “big business” and the pretense that somehow AGW has been caused and maintained by big business.
It would not be possible to detect a larger disparity between the honesty of Popular Technology and the crackpot scheming of DeSmogBlog.
I designed and programmed the digital portion of the automation of the Polymerase Chain Reaction chemistry that we used to identify the HIV virus that was in the world’s blood banking system. This gave Dr. Kary Mullis a Nobel Prize in Chemistry. Later I expanded it to be a 16 axis instrument for analyzing DNA. The Project Leader, Dr. Michael McCown became lecturer in chemistry in a major university. I later designed both gas and liquid chromatography instrument requiring full knowledge of spectroscopy. I programmed the poison gas detector used by the military to discover those weapons of mass destruction that so many liberals claimed didn’t exist. I designed and programmed communications boards used in the initial International Space Station. I designed and programmed instruments used to detect various forms of cancer. Automated syringe pumps and many other things requiring advanced knowledge of many sciences. You could take my word that the idea of AGW is a hoax but I’m sure you won’t because it’s something that you want to believe is true.
While I am sure that your personal achievements in the physical sciences are quite solid, you have demonstrated no knowledge or competence whatsoever on the subject at hand, which is based on atmospheric physics. Your citation below of numerous science-denial sites below, including notably Tony Heller, further underscores this fact.
You are free to discount my abilities all you like. Though I am curious as to why you don’t cite any of your own from which point to judge. Tony Heller has a Bachelors of Science in geology and a Masters in Engineering which most likely puts him miles above you in scientific knowledge and the ability to research things correctly. So if you have any equal training in scientific method by all means let us know.
Tony Heller is a liar, incompetent when it comes to climate science, and a mentally unbalanced conspiracy theorist. He is so off the deep end that he has been banned from WUWT.
Engineering is not a degree that automatically conveys competence or fluency in the natural sciences. For one thing, engineers are often flummoxed by the concept of scientific uncertainty.
NO education automatically gives you competency in anything. That is why 80% of all college graduate never work in their major. But I have followed Heller’s work and he is more than competent.
We haven’t heard from you what your field of competency is in. As for “conspiracy” – that is a FACT and not a fiction.
https://thsresearch.files.wordpress.com/2017/05/ef-gast-data-research-report-062717.pdf
That is a published and peer reviewed paper that SHOWS that NASA doctored raw data. The peer reviewers were from THE EPA and agree with the findings.
So I suggest you go crawl back into the hole you came from and take your own incompetence with you.
“I have followed Heller’s work and he is more than competent”
—Simply, LOL.
The is not peer-reviewed paper. It was never published in a peer-reviewed publications. And having a bunch of non-experts agree with its conclusions is not how peer review works. Wallace, d’Aleo, and Idso are all fringe figures and science-deniers. The citations in the paper are all to the work of skeptics and AGW deniers, some of which wasn’t peer reviewed, others of which have been refuted.
Still waiting for your credentials. You show one point – you are oblivious to the fact that MOST scientific papers are not peer reviewed. Now where was it that you gain all this scientific expertise that you’ve so far failed to demonstrate?
I never claimed to be an expert, though my claim to science literacy comes from having taken some atmospheric physics in college and following the issue of climate in the journals for the last 30 years. But I do listen to those who are, and I generally find that people who are actually engaged in first-hand research are more reliable than people who like Heller who cherry-pick, conspiracy theorize, and make assertions about “fraudulent data” based on utterly ignorant misconceptions about how leading science agencies collect, process, and analyze data.
So you don’t know anything about spectroscopy but think that a class you took 30 years ago qualifies you to identify fact from fiction.
You believe in peer review and I JUST gave you a paper that was peer reviewed by EPA scientists that AGREED that NASA had counterfeited the raw temperature records. But Heller is a wild-eyed cherry picker for saying nothing more than that paper written by mathematicians, without a bone to pick, did.
https://stevengoddard.wordpress.com/2014/01/25/ir-expert-speaks-out-after-40-years-of-silence-its-the-water-vapor-stupid-and-not-the-co2/
That isn’t “cherry picked”. It is an article written by an IR Astronomer who said that he was forced to keep his mouth shut to keep his job.
I think that there is something wrong with you. You admit you know nothing about this and are plainly a True Believer in the Church of Global Warming. Your religious experiences are of no value so please don’t go on about them as if you could convert people that have worked in science for decades.
You keep circling back to Tony Heller.
It’s hilarious.
No, actually I keep circling back to someone that is incompetent to judge the intelligence of anyone else.
It is true. Tony Heller is incompetent to judge the intelligence of anyone else.
Well tell you what – lets see what happens to Michael Mann since you’re such a great believer in the Church of Global Warming.
Why? Is he on trial or under indictment or in danger of losing his job?
I get the impression that you view the greenhouse effect as a fraud.
Firstly you don’t seem to understand what it would do to a so-called scientist’s reputation to be shown to have committed scientific fraud. He was ordered to show his data by the court and he did not. When the court reconvenes he will be found at the very least guilty of contempt of court. And very likely ordered by the court again to make his data available to the public.
You get the impression? I have shown that NASA has committed fraud, that the chart that Michael Mann made called the hockey stick did not show either the Medieval Warm Period or even the little ice age. Both of these things were a blatant attempt to imply that the temperature on this planet is not controlled by the Sun but by components of the atmosphere that are here in such dramatically low amounts that they could have no effect since the energy in their spectroscopic absorption ranges has been in saturation from before any warming events. If there even IS a warming event and not just recovery from the little ice age.
Greenland’s glaciers have not retreated to the levels they were at before the little ice age. And present satellite measurements show that ice is being deposited on Greenland’s glaciers at a faster rate than it is melting off of the base which is at a lower altitude.
Perhaps you are perfectly willing to bow at the altar of the Church of Global Warming but no one that knows science would be.
Mann’s data is publicly available online and always has been. It is ridiculous to claim that he did not show or that he withheld his data. There will be no contempt of court ruling.
You failed in your attempt to show that NASA has committed fraud.
There have been at least 3 dozen paleoclimate reconstructions by scholars all around the world. Every one of them is a hockey stick. The claim that Mann “did not show” the MWP or LIA is nonsense.
The issue is that neither the MWP nor LIA was synchronously warmer than temperatures today.
Your attempt to disprove the greenhouse effect is rather hilarious.
Do you dispute the existence of greenhouse gases (or that CO2 is one of them), as Dr. Ball does?
It always amazes me that those who know the least are those who scream the loudest: http://principia-scientific.org/breaking-fatal-courtroom-act-ruins-michael-hockey-stick-mann/
I know spectroscopy and CO2 only contributed to a small amount of warming up to levels of about 250 parts per million. This put the single absorption line that isn’t totally covered by H2O into total saturation meaning NO increases in CO2 would have any measurable effects.
Moreover, because of the density of the atmosphere in the troposphere virtually ALL heat transport is accomplished not via radiation but from conduction and convection. This means that CO2 is no different from any other gas. In fact since CO2 has a lower specific heat it actually is a coolant rather than a heater.
Tell you what – describe the entire existence of this article and Dr. Mann’s lawsuit IF as you say all his data is already published. I’m waiting.
1. This article exists because it is one of the purposes of CFACT to lie about climate science and smear mainstream scientists.
2. The source of the CFACT article’s claims is Principia-Scientific International, an amateur science denial blog run by a non-scientist lawyer friend of Tim Ball, who is either the blog’s sole author or the author of more than 90% of its context.
3. The obvious purpose of the article is to whitewash Ball and intensify the smears on Mann, including defending Ball’s smears of Mann as somehow credible
You seem to have not bothered to learn critical reading in college.
Let me guess – you like classical music as a break from your job as a carnival clown?
It was Dr. Michael Mann who brought the lawsuit because he knows what is going to happen to him when it is proven that Dr. Ball is correct. Instead of simply paying Mann off to simply avoid the time and effort to fight a lawsuit Ball called Mann’s bluff. Mann answered completely wide-eyed and freaking out by asking for time to develop his case. The DEFENSE agreed on the stipulation that Mann supply his data.
Since Mann BROUGHT the suit he should have had a case to begin with. He obviously didn’t. His data would have proven Dr. Ball 100% correct and Mann would then be finished – he would be immediately fired by Pennsylvania State University and couldn’t be hired at Taco Bell thereafter.
That IS the case – Coming back from recess where Mann is screaming in agony over what is coming to him he WILL be found in contempt of court because the only stipulation to his recess was the handing over of his data. Because he will be found in contempt his case WILL be thrown out of court.
You can make any lame charges about someone or another making “false claims” (this after your lame “his data is all on-line) and that is not going to make any difference in the case.
The law is clear cut and that line is even more clear in Canada.
You have an avid fantasy life. You apparently never noticed that the trial is not about the science or any data at all. It is about defamation, of which Ball is obviously guilty.
If Mann’s data is so obviously fraudulent and hidden how come
a) his data is freely available from his Penn State website
b) Penn State hasn’t fired him yet
c) how does he continue to get published in the leading science journals
d) how come the doctoral program he supervises hasn’t lost its accreditation
e) how come Yale hasn’t been discredited for awarding a PhD to him.
A) Why didn’t you offer a link then? On the off chance that you had a clue I went to both Penn State and Michael Mann’s sites and neither showed any data. Here’s a clue – A CHART IS NOT THE RAW DATA.
B) Until he loses a court case of this type the University will continue to back him since he used to represent research grant money. Now that Trump has stopped government grants for research into global warming his value has greatly diminished.
C) You will have to give me a link there as well since I couldn’t find one iota of scientific research published by Dr. Mann. The last paper he has his name on with another couple of nuts has a conclusion that the extreme weather event are increasing more than previously suspected and that they should use a form of calculus that is based on personal expectations. Seems like your sort of paper. Oh yeah, it wasn’t peer reviewed. (Psst – extreme weather events would drop in a warming world since weather is caused by temperature differences from the tropics of Cancer and Capricorn and their related polar regions)
D) See B above.
E) My how your imagination does fly. What exactly does Yale have to do with acts done by their past students?
Why do you think that it is a good thing for the US government to cease funding of climate change research?
Do you think state governments and international governments should be pressured to follow suit?
You, CML, are a bare-faced, stupid ignorant liar.
I hereby challenge you to a public debate on the subject of CAGW: Catastrophic Anthropogenic Global Warming, preferably recorded for youtube.
:)
Put up or shut up, blowhard.
You seem stupid, and not a little unhinged.
No recorded debate, then, sh1te-for-brains?
Just like Al Gore would rather run a televised marathon in his skivvies than face Lord Monckton in debate: you’re all mouth, no backup.
Why do you think “potty peer” Chris Monckton has any credibility on this issue? Is it because he has a British accent? Is it because he also disputes the theory of evolution? Or is it because he is a conservative?
Your Al Gore obsession is duly noted.
Lord Mockton = You’ve been duped by another con-man (shill)
To see how he does it, please watch:
Monckton Bunkum Part 1 – Global cooling and melting ice https://www.youtube.com/watch?v=fbW-aHvjOgM&list=PL82yk73N8eoX-Xobr_TfHsWPfAIyI7VAP&index=17
Which is why Monckton thrashed Gore in a Brit court of law?
Covered in all 3 books I ref. above.
Judge got bored at 9 lies, called it a day.
Gores’ lies can’t be spread in Brit schools without a 70 page booklet of facts.
There is a total of 35 lies.
Count exaggerations & misleading statements, that racks up to 60.
Gore is still repeating the same lies: he’s a fraud.
More Monckton caught lying again
Monckton Bunkum Part 2 – Sensitivity https://www.youtube.com/watch?v=PTY3FnsFZ7Q&list=PL82yk73N8eoX-Xobr_TfHsWPfAIyI7VAP&index=18
No debate then, thicko?
http://www.sciencemag.org/news/2017/02/great-greenland-meltdown
https://www.nasa.gov/feature/jpl/nasa-discovers-a-new-mode-of-ice-loss-in-greenland
https://www.skepticalscience.com/Greenland-lost-fraction-of-ice-mass.htm
As a last comment to you I will explain this but since you aren’t here to learn anything but to attempt to disturb the conversation it won’t make any difference:
As you can see by looking at the pictures of the lower half of the Greenland glacier – it is black from volcanic soot from a far distant past eruption. This is causing the lower part of the glacier to melt. The glacier is none-the-less growing faster than the lower part is melting.
https://www.climate.gov/news-features/understanding-climate/greenland-ice-sheets-2017-weigh-suggests-small-increase-ice-mass
Furthermore the ice record is only 38 years long meaning that we have no idea what the melts are caused by and melts like our present on also occurred in three previous years widely spaced.
Quite frankly I don’t care what you believe. All of your crying isn’t going to help Dr. Michael Mann get out from under the mess he has buried himself in.
Did you even read your link? It does not support your views. It makes it very clear that this year is an anomaly.
Sensible people ignore Steve Goddard.
There is also the fact that Tony Heller (Steve Goddard is his internet name) routinely presents US temperature data as if it is a stand-in for global temperature data. This is not only dishonest; it is dumb .
Who Is Tony Heller? https://tonyhellerakastevengoddard.com/who-is-tony-heller/
In case you are unaware of it – the IPCC based ALL of their claims based on a study of 600 papers from American scientists using US temperature data. And 400 of those 600 authors have now said that they were either misrepresented as positive when they were neutral or that their papers were presented as positive when they were strongly negative. Can you tell us what your credentials are? No man who criticizes other without presenting their own knowledge of the subject is worthy of even noticing.
Hoo boy, are you ever stupid. Show us all the citations used in IPCC 5th report.
So what you’re saying is that you don’t know how to look it up yourself and need your hand held while you’re calling someone else stupid?
No idiot. I am saying that if you were to post all the citations of the IPCC report, everyone would see either what a liar you are or how stupid you are.
If you don’t believe me show me wrong or shut up. Jackasses that want everyone to prove that their 2nd grade teacher was right and scream “stooopid” without one single ounce of their own knowledge are a real scream.
#facepalm You conspiracy nuts.
Do you not even know where to find that? Did Heller not tell you.
LOL Who told you “the IPCC based ALL of their claims on a study of 600 papers from American scientists using US temperature data”?
Go here, pick a chapter, download the citation file. Do that for all chapters for each WG.
and you have been in science for 40 years ?
LOL
…but you throw a hissy-fit like a 14 year old spoiled British School Brat.
oh, and here is that lets-Pretend we are a scientist for 40 years….throwing another temper tantrum……..
POOR POOR PITIFUL YOU !
“In case you are unaware of it – the IPCC based ALL of their claims on a study of 600 papers from American scientists using US temperature data.”
I think the IPCC would be surprised by that. What we can learn from your statement, assuming honesty on your part:
– you haven’t looked at the IPCC reports directly.
– you have relied on a third party source that is patently unreliable.
So what was your source for your claim?
Tell us Sam – are you aware that the IPCC has had 5 Assessment papers? Tell me what the difference was between the first, the second, the third, the fourth and the fifth or please do not tell me anything that shows that you didn’t actually read any of them.
Are you suggesting the IPCC is wrong because its view has evolved in line with newer evidence?
First off you haven’t followed the conversation and jumping in with some dumb statement isn’t putting you in a particularly good light. Secondly what do YOU PERSONALLY know about the IPCC? Name the 2500 “scientists” that have their names on the 5th assessment.
Why did you put scientists in scare quotes?
That is SIMPLY NOT TRUE….I have READ many many studies used as IPCC basis….scientists from all over the world, studies from all over the world
“….More than 830 Authors and Review Editors from over 80 countries were selected to form the Author teams that produced the Fifth Assessment Report (AR5).They in turn drew on the work of over 1,000 Contributing Authors and about 2,000 expert reviewers who provided over 140,000 review comments.
See the complete list of AR5 Authors and Review Editors. For statistics and regional coverage among the author teams see the AR5 page.
For the Fourth Assessment Report (AR4) released in 2007, over 3,500 experts coming from more than 130 countries contributed to the report (+450 Lead Authors, +800 Contributing Authors, and +2,500 expert reviewers providing over 90,000 review comments). …”
Doesn’t it embarrass you people to not read what is written and to retort things that weren’t said? I said THE FIRST IPCC assessment. After the political structure saw that it could obtain power; and the investment structure saw that they could earn money by investing in carbon credits you simply could not keep a job in climate science without requesting research funding to prove that it existed whether it did or not.
https://www.bing.com/videos/search?q=youtube+michael+savage+climate+change&&view=detail&mid=55D9288B902F0F42030A55D9288B902F0F42030A&&FORM=VDRVRV
I have worked in science for over 40 years and I have worked closely in spectroscopy. No one can debate me on CO2 and the preposterous charge that it can make any changes in atmospheric conditions. Moreover as a yachtsman and member of one of the oldest yacht clubs in America I can verify that sea levels certainly haven’t changed measurably in the last 70 years that I’ve lived on the San Francisco bay.
What’s more a peer reviewed study SHOWS that NASA has manufactured data making absolutely false data. No scientist could make any accurate studies when NASA management was destroying the true data.
https://thsresearch.files.wordpress.com/2017/05/ef-gast-data-research-report-062717.pdf
Climate change isn’t just a hoax – it is a criminal act that is designed to give politicians and governments more power and investment companies and HUGE new source investment profits.
So, what you are saying (if I may interject) is that your experience in spectroscopy tells you that CO2 cannot be a greenhouse effect (“the preposterous charge that it can make any changes in atmospheric conditions”).
If that is the case, how do you explain that nearly every widely used atmospheric physics textbook discusses a greenhouse effect from CO2 and that none other than Carl Sagan attributed the fact that Venus has a warmer surface than Mercury to a runaway greenhouse effect.
An early example of a colorimetric analysis is Nessler’s method for ammonia, which was introduced in 1856. Nessler found that adding an alkaline solution of HgI2 and KI to a dilute solution of ammonia produces a yellow to reddish brown colloid, with the colloid’s color depending on the concentration of ammonia.
By visually comparing the color of a sample to the colors of a series of standards, Nessler was able to determine the concentration of ammonia. Colorimetry, in which a sample absorbs visible light, is one example of a spectroscopic method of analysis.
At the end of the nineteenth century, spectroscopy was limited to the absorption, emission, and scattering of visible, ultraviolet, and infrared electromagnetic radiation.
Since its introduction, spectroscopy has expanded to include other forms of electromagnetic radiation
—such as X-rays, microwaves, and radio waves
—and other energetic particles
—such as electrons and ions
Does your cut and paste supposed to show that you know anything?
We were discussing Global Warming.
..
Not my base of Knowledge
or
YOUR LACK OF UNIVERSITY TRAINING !
Leading
Scientists
Questioned
Green House Gas effects in our atmosphere:
So,
In 1970,
NASA launched the IRIS satellite measuring infrared spectra.
.
Google: Iris Satellite Research Abstract
.
In 1996,
the Japanese Space Agency launched the IMG satellite
which recorded similar observations.
Google: IMG Satellite Research Abstract
.
Both sets of data were compared to discern any changes
in escaping radiation levels over the 26 year period
Google (Harries 2001 research abstract)
.
What they found was a drop in Escaping Infra Red radiation
at the PRECISE wavelength bands that greenhouse gases
such as CO2 with H2O, CFC’s, Ozone,
Nitrous Oxides, and methane (CH4) absorb energy.
The change in DECREASE IN ESCAPING I.R. radiation was consistent
with theoretical Expectations / Predictions.
.
This research & paper found
“direct experimental evidence for a significant increase
in the Earth’s greenhouse effect” and Warming on Earth.
.
This result has been confirmed by subsequent research & papers using data from later satellites
Google (Griggs 2004 Research Abstract)
Google (Chen 2007 Research Astract )
.
Figure 2: Change in spectrum from 1970 to 1996 due to trace gases.
‘Brightness temperature’ indicates equivalent blackbody temperature
Google (Harries 2001 Research Abstract)
When greenhouse gases absorb infrared radiation,
the energy heats the atmosphere which in turn
re-radiates infrared radiation in all directions.
.
Some makes its way back to the earth’s surface.
Therefor
we
Expect/Predict
to find more infrared radiation heading downwards.
.
Surface measurements from 1973 to 2008 find an increasing trend of infrared radiation returning to earth
Google (Wang 2009 Research Abstract)
Right on. :)
“….the IPCC based ALL of their claims on a study of 600 papers from American scientists using US temperature data….”
PROVE IT !
I have googled a random sample from all of the reports and they are widely distributed all over the world…and relatively current statements of each are supportive or even MORE worried about man made Global Climate Change.
Would it be tooooo much to ask for some verification of that statement.
I have read a great many studies referenced by the IPCC reports 1-5…as I transitioned to an understanding of Global Warming….
I have looked at MANY of the authors…who are from all over the world…as are MANY of the Researchers>
I suggest you simply watch this video. It’s an hour and a quarter but it covers a lot of ground. https://www.youtube.com/watch?v=DJBDI7jVMqM
I know spectroscopy and know that the CO2 stuff is BS.
I prefer the original research with references.
A regional study over the central Alps found that
downward infrared radiation is increasing due to the
enhanced greenhouse effect
.
Google (Philipona 2004 research abstract).
.
Taking this a step further, an analysis of high resolution spectral data allowed scientists to quantitatively attribute the increase in downward radiation to each of several greenhouse gases
.
Google (Evans 2006 Research abstract)
.
The results lead the authors to conclude that
*
*** “this experimental data should effectively end the argument by skeptics that no experimental evidence exists for the connection between greenhouse gas increases in the atmosphere and Climate Changes caused by global warming.”
.
Figure 3:
Spectrum of the greenhouse radiation measured at the surface. Greenhouse effect from water vapor is filtered out,
showing the contributions of other greenhouse gases
Google (Evans 2006 Research Abstract)
.
This Entire planet is accumulating heat
.
Proving, perhaps that there’s no shortage of charlatans willing to produce crap for a dollar, or a pound or a mark or a buck, or that there’s no shortage of snake oil salesmen to misrepresent decent science and advocate said crap.
Yes, this means you, birdseye. :)
Is there really a consensus on global warming?
.
Michael Barnard, Low-carbon Innovation Strategist
Updated Apr 26, 2017
.
“Depending on the method, the many studies on this subject show that from
97.1% to 99.99% of climate scientists — defined as researchers publishing
in peer-reviewed journals — accept that the climate is rapidly changing
due to human actions. The degree of severity they ascribe to impacts of
climate change varies according to their specific areas of study and their models,
but those ranges are captured in the IPCC 5 scenarios,
all of which show not only warming but significant negative impacts.
The high end and very recent study shows 99.99% consensus.
.
James L. Powell, director of the National Physical Sciences Consortium,
did the most recent of several peer-reviewed,
published studies showing the overwhelming consensus by climate scientists
on anthropogenic climate change.
.
Here’s what he says:
If the consensus were 97%, then to find 3 peer-reviewed articles that reject AGW,
one would need to read, on average, 100 articles.
Instead, to find even a single rejecting article,
one must read nearly 5,000 articles.
The true consensus on AGW cannot be as low as 97%.
[…]
The only sound and practical way to judge the extent of a scientific consensus
is to search for articles that reject the prevailing theory. For 2013 and 2014,
I found that only 5 of 24,210 articles
and
4 of 69,406 authors rejected anthropogenic global warming.
Home Page
His full paper is linked from that site.
Also very recently, Benestad et al published a paper in the journal
Theoretical Applied Climatology in July 2015.
They spread an even wider net than Powell, looking at every significant paper
ever published in a peer-reviewed journal that denied anthropogenic climate change.
They found 38 papers.
A common denominator seems to be missing contextual information or
ignoring information that does not fit the conclusions,
be it other relevant work or related geophysical data. In many cases,
short-comings are due to insufficient model evaluation,
leading to results that are not universally valid
but rather are an artifact of a particular experimental setup.
Other typical weaknesses include false dichotomies, inappropriate statistical methods,
or
basing conclusions on misconceived or incomplete physics.
[…]
We also note that several of these papers involved the same authors
and that the different cases were not independent even if they involved different
shortcomings. Some of the cases also implied interpretations that were
incompatible with some of the other cases, such as pronounced
externally induced geophysical cycles and a dominant role of long-term
persistence (LTP); slow stochastic fluctuations associated with
LTP make the detection of meaningful cycles from solar forcing difficult
if they shape the dominant character in the geophysical record.
Page on springer.com
It other words, the papers don’t agree with one another,
they are written in fairly obvious ignorance of reasonably well known
science and modelling basics and there are a handful of authors
who keep writing stuff that’s in denial, not a large number of them.
The authors of this paper — disclosure:
I’ve communicated with Lewandowsky, one of the authors, many times
— bend over backward to avoid saying the obvious about the authors,
instead treating them with respect and suggesting reasons why they might,
possibly, maybe have just been accidentally ignorant.
But what about that 97%?
.
Multiple studies published in peer-reviewed scientific journals
show that 97 percent or more of actively publishing climate scientists agree:
Climate-warming trends over the past century are very likely due to human activities.
In addition, most of the leading scientific organizations worldwide
have issued public statements endorsing this position. The following
is a partial list of these organizations,
along with links to their published statements and a selection of related resources.
.
Scientific consensus:
Earth’s climate is warming
.
Here are the five major papers that arrived at 97%:
J. Cook, et al, “Quantifying the consensus on anthropogenic global warming
in the scientific literature,” Environmental Research Letters
Vol. 8 No. 2, (June 2013); DOI:10.1088/1748-9326/8/2/024024
Quotation from page 3: “Among abstracts that expressed a position on AGW
[Anthropogenic, or human-cause, Global Warming], 97.1% endorsed the
scientific consensus. Among scientists who expressed a position on AGW
in their abstract, 98.4% endorsed the consensus.”
W. R. L. Anderegg, “Expert Credibility in Climate Change,”
Proceedings of the National Academy of Sciences Vol. 107 No. 27, 12107-12109
(21 June 2010); DOI: 10.1073/pnas.1003187107.
P. T. Doran & M. K. Zimmerman,
“Examining the Scientific Consensus on Climate Change,”
Eos Transactions American Geophysical Union Vol. 90 Issue 3 (2009), 22;
DOI: 10.1029/2009EO030002.
N. Oreskes, “Beyond the Ivory Tower:
The Scientific Consensus on Climate Change,” Science Vol. 306 no. 5702, p. 1686
(3 December 2004); DOI: 10.1126/science.1103618.
So we have seven peer-reviewed and published papers which use different techniques,
published from 2004 to 2015, which show that the consensus among
climate science papers is in excess of 97% and that there are a
tiny number of dissenters who are making obviously incorrect statements.
You can argue with one paper which has not been reproduced.
It’s harder to argue with a paper whose results have been reproduced.
And it’s much harder to argue with multiple different methodologies
which arrive at the same result.
In the case of climate scientists having a very strong consensus on the
basics of anthropogenic climate change, consilience is extremely high.
Consensus is politics, not science, you long-winded fool.
https://www.sott.net/image/s18/367222/large/Adjustments_vs_CO2.gif
This graph shows temp adjustments versus atmospheric concentration of CO2 . The relationship is almost linear with an R**2 of .98
This shows that the USHCN temperature adjustments are a deliberate attempt to make the temperature vary with CO2 concentration. With an R**2 of .98, this shows deliberate fraud.
READING your comments clearly shows NO higher education.
Name Calling Juvenile is more accurate.
HAHAHAHAHAHA. Your ignorance, arrogance, stupidity, lack of scientific contribution & plethora of insults is fecking hilarious. duncebrain.
Regarding your link: https://www.snopes.com/climatology-fraud-global-warming/
SNOPES??? You are quoting a site run by past members of the Democrat Party Election Committee??? Not to mention they aren’t even TALKING about the same paper! You are indeed a moron!
A masters in Electrical Engineering HARDLY QUALIFIES him to rewire my laundry room.
“Tony Heller”
(AKA Steven Goddard)
(Makes you wonder How many other Identities he has)
“He has had some articles published in The Register
a British technology news and opinion website.
“Searching his name at The Reg gives links to just 5 opinion pieces all from about four years ago.
“One of his pieces posted on Friday 15th August 2008 called
‘ “Arctic ice refuses to melt as ordered:
There’s something rotten north of Denmark”
he (willfully) attacked the National Snow and Ice Data Center.
((LONG known around the world for its scientific Integrity))
But after being contacted by Dr. Walt Meier at NSIDC he was forced to issue a retraction;
Steven Goddard writes:
“Dr. Walt Meier at NSIDC has convinced me this week that their ice extent numbers are solid….
It is clear that the NSIDC graph is correct,
and
that 2008 Arctic ice is barely 10% above last year
– just as NSIDC had stated.”
(( THAT IS CALLED EATING CROW ! ))
.
Unfortunately, this original error of HIS raced around the world on the the blogosphere and in many cases remains uncorrected.
….
Mr Goddard has previously popped up with numerous and inventive “sea ice updates” at Anthony Watts’ WTFUWT
blog.
This should be a clear warning to any WATTS followers as to the awful standard permissible for posting there, and some embarrassing back tracking has also happened as this post shows;
“Arctic Ice Graphing LessonIncreasing Bt 50,000 km2 per year”.
“Goddard’s ignorance on sea ice has also made HIM a topic.!)
Mr Goddard (HELLER?) has also contributed to to the Science and Public Policy Institute‘s never-ending stream of climate denier propaganda joining the ranks of the truly potty with Viscount (ordered to remove the word LORD)
Christopher Monckton of Brenchley now as a peer.
A good over view of his standard of scientific rigour at SPPI can be found at sciblogs;….”
Tell you what – why don’t you volunteer for Obama’s science adviser. He likes people like you that agree with him.
You sure get angry when your God is about to get his comeuppance.
AUH2O for ever DEARIE !
Dr.s CHRISTY, SPENCER & Denial
In the late 1990’s,
deniers/skeptics Dr.s Christy and Spencer
declared confidently to a Heartland Institute crowd,
that GLOBAL WARMING will cease to exist around 2000
as earth’s natural cycle returns to a
gradual cooling into our next glaciation….Ice Age.
(has that started yet?)
And then those two DENIERS released thousands of press releases
announcing a “GLOBAL WARMING PAUSE”
(in private describing it, not as a literal pause/stop
…but really a slowing in the warming process)
WITH that came hundreds of PAID interviews, 100’s of PAID articles etc.
.
AND
then those two DENIERS released thousands MORE press releases announcing a
“Global Warming Hiatus”…
(in private, again, describing it, not as a literal pause/stop
…but really a slowing in the warming process)
WITH that came hundreds MORE PAID Interviews, 100’s of PAID articles etc.
and then there was a “GLOBAL COOLING”
same ol’, same ol’.
((( Feel free to follow the money from THOSE interviews to THEIR Pockets)))
Then came all kinds of conflicting evidence from OTHER satellite systems
NOT CONTROLLED BY CHRISTY AND SPENCER..
&
Then came all kinds of conflicting evidence from NOAA & NASA 2000+
digital ground stations, and thousands of weather balloons.
…THEN,
news media drew millions of data from over 30,000 “privately” owned & operated
DIGITAL WEATHER GROUND STATIONS .. near every CITY & TOWN around the world.
.
and those Digital Stations Agreed with NOAA & NASA
….down to the thousandth of a degree.
..
then the TRUTH FROM SKEPTIC CHRISTY & SPENCER
….Guess What ? …there is global warming ! IT’s unanimous!
“formulaic ERRORS”
accounted for much of the
” cooling ” they reported
or
” Less Warming ” they reported in ALL of those PRESS RELEASES !
…
THEN:
“….In fact, for those who live in reality, as opposed to in denial,
satellite data, ground-based weather stations, sea-based buoys,
and even weather balloons all reveal a steady long-term Warming trend.
Let’s start with the UAH data,
which show a stunning 1.5°F (0.83°C) warming in February 2016
compared to the historical (1981–2010) average for the lower troposphere
(the lowest part of the atmosphere):
The lower tropospheric temperature (LT) anomaly, via UAH scientist
Dr.s Christy & Roy Spencer.
How amazing is this temperature jump?
.
First off,
remember that the 1981–2010 baseline used by the UAH is itself some 0.8°F
(0.45°C) hotter than pre-industrial levels
—so you can add that to all of the numbers here.
Second,
February was more than half a degree Fahrenheit
—?0.52°F (0.29°C)
—?warmer than January, which itself was “the warmest January in satellite record.”
Third,
it was so hot last month that
Dr. Roy Spencer of the UAH reports,
“Incredibly, land areas outside the tropics in the Northern Hemisphere
were a ‘whopping’ 1.46 degrees C above average, 0.5 degrees
above any previous monthly anomaly.”
This is a 2.6°F warming above the 1981–2010 average
—topping the previous anomaly by 0.9°F.
Lower atmospheric warming over land outside of the tropics
(vs. the 1981–2020 average)
via UAH scientist Roy Spencer.
Fourth,
it was so hot last month that Spencer
—one of country’s leading climate science deniers
—told the Washington Post:
“I’ve always cautioned fellow skeptics that it’s dangerous to claim no warming. ”
“There has been warming. ”
“The question is how much warming there’s been and how does that compare
to what’s expected and what’s predicted.”
Now we know there has been a lot of warming,
it’s consistent with what scientists predicted,
and,
most worrisome of all, scientists now predict it will keep speeding up!
Maybe we should start listening to them.
***
FROM THOSE LEADING
CLIMATE CHANGE DENIERS.
.
A STUNNING ADMISSION:
The UAH’s Spencer and Dr. John Christy?
—?both leading deniers?
—?reported just last month that the UAH data shows a
“Global climate trend since Nov. 16, 1978 [of] +0.12 C [0.22F] per decade.”
NO PAUSE !
NO HIATUS !
sure as hell,
NO COOLING !
SPENCER:
“my UAH cohort & boss John Christy, who does the detailed matching
between satellites, is pretty convinced that the RSS data is
undergoing spurious cooling because RSS is still using the old NOAA-15
satellite which has a decaying orbit…”
and they were taking readings of the MUCH COOLER STRATOSPHERE !.
OOOOOOPS!
” HE DID IT !
I never touched the cookie jar, mommy ! ! “
Why did Dr. Mann need time to prepare a case? Since he was supposedly the injured party he should have had a case BEFORE he opened a law suit against Dr. Ball.
Properly averaged using the data from Dr. Spencer’s satellites the temperature is falling after a 10 year hiatus of no changing.
Look, I am not particularly religious but if you want to be a member of the True Believers in the Church of Global Warming by all means have at it.
Throughout the history of this planet the temperature has almost always been much hotter than it presently is. We are in an interglacial period of an ice age.
And you believe that an ice age is normal.
Even with NASA’s manufacturer data the temperature is:
https://www.ncdc.noaa.gov/sotc/global/201313
But even the best scientists cannot make proper research when confronted by NASA inventing entire strings of data;
https://thsresearch.files.wordpress.com/2017/05/ef-gast-data-research-report-062717.pdf
This study is peer reviewed by members of the EPA who could find no errors.
The Oregon Petition has been signed by over 31,000 degreed scientist over 9,000 of whom are PhDs. all of whom do not believe in man-made global warming.
As I said, believe whatever you like. This comment string has wondered far off of the subject of what is about to happen to Dr. Michael Mann for committing contempt of court.
YOU SAY:
“Why did Dr. Mann need time to prepare a case? Since he was supposedly
the injured party he should have had a case BEFORE he opened a law suit
against Dr. Ball.”
*
who the hell cares…the attorney needs to prepare.
statements by BALL had to be collected.
Mann has repeatedly been sued by RABID RIGHT WINGERS like you…perhaps he needed to relax, vacation….
****************
YOU SAY:
“Properly averaged using the data from Dr. Spencer’s satellites the temperature is falling after a 10 year hiatus of no changing.”
*
What an absolutely asinine comment !
…YOU CLAIM to be in the science field
….DID YOU NOT KNOW THAT BOTH CHRISTY and SPENCER …..admitted repeated errors that showed a slower rate of Global Warming.
..THEY INCREASED THEIR TEMPERATURE READINGS !!!
OOOOOP !
NEVER WAS A PAUSE !
….NEVER WAS A HIATUS !
…..SURE AS HELL THERE NEVER WAS A COOLING
***************
YOU SAY:
“Throughout the history of this planet the temperature has almost always been much hotter than it presently is.
We are in an interglacial period *of an ice age”
*
GOOD GOD !
Ice Ages average about 100,000 years (google Milankovitch cycles)
80% of the time IS a GLACIATION while 20% is this inter glacial warm period.
YOUR STATEMENT
that the earth as nearly always been warmer…is jet another ASININE COMMENT that belies your CLAIMED Science background ! !
THIS Holocene INTER GLACIAL WARM PERIOD peaked
in temperatures around 8000 years ago !
LOOK:
http://www.realclimate.org/images//Marcott.png
LOOK at the graph !
ABOVE!
….note that temperatures have been falling as we enter the NEW GLACIATION….
….the reason the Medieval warming is remembered, is not because it was so damn hot.
..but because it was a period IN CONTRAST TO THE FALLING TEMPERATURES before…and after that Medieval period.
.
HELL, much of the last 1000 years is CALLED the LITTLE ICE AGE.
ICE AGE because of the temperatures
LITTLE because it ended !
.
And the end was highly noticed by thinkers and scientists of the day.
Direct observations ! !
1799
Alexander von Humboldt studied, worried and postulated that
Human Activities would CAUSE CLIMATE CHANGE!
1799
Thomas Jefferson also penned a paper
on observed changes in climate which he stated was
probably caused by man.
.
….CO2 is rising sharply due to human activity.
.
Satellite & surface, Digital Balloon Launches & Aircraft, Spectroscopic Observatory measurements find less energy is escaping to space at CO2 absorption wavelengths…working WITH H2O to enhance each others effect on the Atmosphere and our climate.
.
Ocean and surface temperature measurements are rising !
**** These Research studies find the planet
**** continues to accumulate heat. Year after year.
.
…..TODAY, while the EARTH ORBIT pulls us away from the sun
(a cause of glaciations)
.
……TODAY, while the EARTH AXIS tilts the world away from the sun,
(a cause of glaciations)
.
…….TODAY, Temperatures are rising
….
Around 1750-1780 temperatures STOPPED FALLING !
Shortly there after, temps. started in spits and spurts to climb !
.
WHAT POWER ON EARTH OR IN THE HEAVENS terminated
EARTH’S MOST POWERFUL NATURAL CYCLE ? ? ? ? ? ? ?
Little fat fraud Mikey Mann tried to wipe out the MWP , Medieval Warm Period & LIA, Little Ice Age, you liar, with his incompetent “Hockey Stick” graph. HAHAHAHAHA
You aren’t really bright are you? The very definition of a “warm period” is that it is colder before and after it. The Maunder Minimum and it’s extreme hanging on the edge of entering into a real ice age is something entirely different and it wasn’t that cold for the last 5000 years at a minimum. Can you explain to us why it is so important that global warming be real that you are willing to make any possible charges against anyone in the world to keep it so?
“who the hell cares” – that is your entire belief system in a nutshell. Nothing that assaults your religion is applicanble.
https://thsresearch.files.wordpress.com/2017/05/ef-gast-data-research-report-062717.pdf
That paper is in response to your silly straight up line.
You are a myopic fool.
Distraction is what the Trolls intend.
Michael Mann is a stone FRAUD. :)
Only his sentence now is uncertain.
You’re a long-winded liar. :) Debate me. :)
He cannot debate you because he doesn’t understand anything about AGM theories other than “it’s all the corporations fault” while at the same time saying “NASA is stone cold honest”.
The “truly potty” LORD CHRISTOPHER MONCKTON, 3rd Viscount Brenchley completely disgraced the gross liar & fraudster Al Gore in a Brit court of law.
The judge got fed up after Monckton exposed 9 lies in Gore’s film “An Innconvenient Truth”. Judge called them “errors of fact”. I’ll stick to lies, thanks, I’m partial to old-fashioned plain English, not legalese.
In fact there are 35 lies in Gore’s disgraceful climate scare porn film. If you count exaggerations etc, there are 60 “errors” in Gore’s scare porn.
You can get this on YouTube. :)
YOUR
description of the Judge’s rendering in this matter
IS
GROTESQUELY INACCURATE !
“….Gore’s climate film has scientific errors – judge
· Court rules documentary can be shown in schools
· Presentation is ‘broadly accurate’ but lacks balance
David Adam, environment correspondent
Thu 11 Oct ‘07 10.28 EDT
Al Gore’s Oscar-winning documentary on global warming, An Inconvenient Truth, was yesterday criticised by a high court judge who highlighted what he said were “nine scientific errors” in the film.
Mr Justice Barton yesterday said that while the film was “broadly accurate” in its presentation of climate change, he identified nine significant errors in the film, some of which, he said, had arisen in “the context of alarmism and exaggeration” to support the former US vice-president’s views on climate change.
The film was broadly welcomed by environmental campaigners and scientists on its release last year,
and
*while they did point out that it contained mistakes,
these were relatively small and did not detract from the film’s central message
– that global warming was a real problem and humans had the technology to do something about it….”
BULLSH1TE. Judge mandated film could only be shown in Brit schools after a 70 page booklet demonstrating its frauds. Liar.
I can find NO SUCH comment or ruling from the bench…
PROVE IT…..reference a Legit. source for that comment.
If you have the truth on your side…why do you find in necessary to cuss at a fellow American and a Goldwater Conservative?
The judge in question actually stated that it was largely accurate from a scientific viewpoint.
Please take the trouble to look up his actual decision before spouting off further.
UK courtJudge, Justice Burton ruled…”it is a political film…”
The judge identifyed 9 scientific errors…none of which Gore has corrected.
Dr. Tim Ball’s book: Human Caused Global Warming the biggest deception in history.
Lovely little book, only 121 pages, lots of pretty colour graphs & diagrams.
Mann has lost his defamation case to Tim Ball. Only the verdict remains.
Mann tried to wipe out Medieval Warm Period MWP & Little Ice Age.
What a little fat imitation Stalin, the CNUT. HAHAHAHA.
Court OK’s Distribution of Gore film for schools
with explanation/balance for 9 out of 80+ climate claims.
“An Inconvenient Verdict for Al Gore – ABC News
abcnews.go.com/US/TenWays/story?id=3719791
“Oct 12, 2007 – One day before Friday’s announcement that he was a co-winner of the Nobel Peace Prize, a British High Court judge ruled that Gore’s global warming film, “An Inconvenient Truth,” while “broadly accurate,” contained nine significant errors.”
*****
Dr. Michael Mann has already beaten 2 suits by Rabid Right Republicans who were wishing to MUZZLE legitimate Science on CLIMATE CHANGE and Global Warming.
.
In Canada, the press reports on Dr. Mann’s defamation case against Dr. Timothy Ball….reports VERY favorably
for Dr. Mann’s position.
…
Mann never attempted to wipe out the MEDIEVAL WARM Period….
….Dr. Mann’s charting/graphing 10,000 years of
Proxy Temperatures with Human Measures of temperatures…CLEARLY SHOWED that The medieval Warm Period may have been as warm as the mid 20th century….was not as warm as temps. have sky rocketed to, today…….
Subsequently, 35 separate RESEARCH TEAMS have verified the accuracy of the HOCKEY STICK GRAPH
……after a decade of VERBAL AND WRITTEN ABUSE….most notably BY DR. TIMOTHY BALL…..who accused MANN of fudging the numbers and the data…..
THAT is Called FRAUD.
….and that was the subject of the 2 court suits which MANN won.
…..against the Attorney General of Virginia……..
….
HERE IS ONE OF THE ADDITIONAL STUDIES WHICH AFFIRMS MANN’S HOCKEY STICK GRAPH…..using largely alternative readings and proxy measures….
LOOK:
http://www.realclimate.org/images//Marcott.png
You are a completely incompetent LIAR:
1) Mann’s graph showed ONLY the last 1000 years, 1000AD to 2000AD.
2) It DID try to wipe out Medieval Warm Period & Little Ice Age.
3) It used tree-ring data from ONE LONE PINE TREE to portray GLOBAL TEMPERATURES, ( when said tree rings actually showed moisture levels, HAHAHAHAHA), then spliced on modern instrument temperatures to show an “unprecedented” modern warming.
Completely fraudulent & unscientific.
4) The little fat fraud then claimed his scam was “his intellectual property” though the US taxpayer had funded it. What a sphincter.
5) The LFF then refused to show his workings, as any “scientist” seeking to validate his “work” would.
6) The LFF’s refusal to show his work in Canadian Court led to him losing his defamation case by default.
7) Only the verdict is awaited.
8) Even the fraud factory IPCC has dropped Mann’s ludicrous “Hockey Stick” graph, which it featured heavily in its 2001 report.
The laughter became unbearable. :)
9) McIntyre & McKitrick demolished Manns’ fraudulent statistics.
10) The US House Energy and Commerce Committee appointed an eminent team of statisticians led by Dr. Edward Wegman to investigate.
11) Statements of Wegman Committee:
” the sharing of research materials, data and results was haphazardly and grudgingly done.”
“Overall, our committee believes that Dr. Mann’s assessments that the decade of the 1990s was the hottest decade of the millennium and that 1998 was the hottest year of the millennium cannot be supported by his analysis.”
12) The report finds that:
a) The cycle of the MWPeriod & LI Age disappeared from Mann et al…
b) 42 other authors formed a closed coterie in collusion to pal-review each others work perverting the peer-review process.
13) A National Academy of Sciences report also shows extensive criticism of the methodology of Mann et al…
14) Wegman also criticised Mann’s incompetent statistical work.
15) Mann, incredibly, claims he was vindicated. What a sphincter.
There are many peer-reviewed papers illuminating this most disgusting fraud in the History chapter of Prof Ian Plimer’s book: Heaven and Earth.
This criminal episode is also dealt with in Tim Ball’s great little book: Human Caused Global Warming the biggest deception in history.
Your introduction of the laughably fraudulent Marcott graph just shows your incompetence: it purports to show the last 9000 years, not the last 1000 years & thus is a useless (& false) comparison.
For true comparisons, over 1,000, 10,000, whatever years go to http://www.c3headlines.com & click on graphs & charts.
Click on Quotes if you want to see the Anti-industrial, anti-human & anti-democracy & pro One World Totalitarian Govt agendas behind the climate scam.
Best, :)
John Doran.
1.
typo corrected.
2.
it accurately depicted many years fluctuations….Marcott graph I gave you is much more accurate graph , using many other proxy measures.
3.
There was NO attempt to wipe out those 2 events but rather there was a conscious attempt to represent what the proxy measures reflected…there have been dozens of studies by real scientists
…(not to be confused with your wild-ass-allegations)
that verify Mann’s graph.
“completely fraudulent & unscientific”
….your mouthy-wild-ass-conclusions….
…
YOU CLAIM HE LOST IN CANADA….and
YOU KNOW THAT YOU JUST LIED…….
THERE HAS BEEN NO DECISIONS IN CANADA !
” Michael Mann’s lawyer Roger McConchie
(who is an expert in defamation/libel/slander law in Canada)
Contrary to the nonsensical allegations made by John O’Sullivan
in his July 4 posted on climatechangedispatch.com and elsewhere,
plaintiff Michael Mann has fully complied with all of his
disclosure obligations to the defendant Tim Ball relating to data and other documents.
No judge has made any order or given any direction, however minor or inconsequential,
that Michael Mann surrender any data or any documents to Tim Ball for any purpose.
Accordingly it should be plain and obvious to anyone with a
modicum of common sense that Mann could not possibly be in contempt of court.
Just to be clear:
Mann is not defying any judge.
He is not in breach of any judgment.
He is not, repeat not, in contempt of court.
He is not in breach of any discovery obligations to Ball…..”
In this context, O’Sullivan’s suggestion that Ball
“is expected to instruct his British Columbia attorneys to trigger
mandatory punitive court sanctions” against Mann is simply divorced from reality.
***
I can find NO LEGIT PEER REVIEWED STUDIES that DISPROVE MANN’S REPRESENTATION OF PROXY DATA or his HOCKEY STICK GRAPH !
& here is Little Fat Fraud Mikey Mann’s actual graph, which you are desperately NOT showing, wan*er, because it clearly shows the t*sser’s attempt to wipe out MWP & LIA:
enwikipedia.org/wiki//File:T_comp_61-90.pdf
plenty of nothing
http://www.en.wikipedia.org/wiki/File:T_comp_61-90.pdf
http://www.notrickszone.com
Put Hockey Stick Graph in Search Box.
Many articles to give you indegestion, fool.
http://www.bom.gov.au/climate/current/annual/aus/2015/20150106_global_Tmean_plot.png
http://berkeleyearth.org/wp-content/uploads/2015/03/land-and-ocean-sea-ice-comparison-large.png
https://en.wikipedia.org/wiki/Effects_of_global_warming#/media/File:2000_Year_Temperature_Comparison.png
http://www.woodfortrees.org/plot/gistemp/from:1980/plot/gistemp/from:1980/trend/plot/gistemp/from:1997/plot/gistemp/from:1997/trend
Temperatures are RISING !
No matter how you graph them,
No matter how you chart them
or
No matter how you quantify them.
Every NATION on Earth, save 1, has recorded the temperatures since 2000 as record breaking temperatures.
THOSE are not models for you to hallucinate
and
hyperventilate about
………they are men and women reading thermometers …….
Every NATION on Earth has reported SNOW/ICE SHEETS and GLACIERS melting
all the while you are peeing and moaning about
some outlier appointed by a political ideologue claiming that
.
” Overall, our (political) committee believes that Dr. Mann’s assessments that the decade of the 1990s was the hottest decade of the millennium and that 1998 was the hottest year of the millennium cannot be supported by his analysis.”
https://en.wikipedia.org/wiki/Effects_of_global_warming#/media/File:2000_Year_Temperature_Comparison.png
http://www.woodfortrees.org/plot/gistemp/from:1980/plot/gistemp/from:1980/trend/plot/gistemp/from:1997/plot/gistemp/from:1997/trend
…
https://wattsupwiththat.files.wordpress.com/2014/11/clip_image0042.png
Google the Holocene optimum
note the slow and steady, spit by spurt, reduction in temperatures for 8000 years….
Note the dramatic stop of those temp. drops in the 1700’s.
Note, while temperatures from then-on show a steady rise in temperatures ( in spits and spurts) …
ALL the CAUSES of GLACIATIONS for tens of millions of years have continued to “CAUSE GLACIATION”….but
temperatures ARE NOT LISTENING and ARE NOT OBEYING……
WHAT CAUSED EARTH’S MOST POWERFUL NATURAL CYCLE to Terminate in the mid to late 1700’s ?
Could Thomas Jefferson and Alexander von Humboldt been right in 1799 ?
….that mankind’s activities are causing
“Climate Changes”….???
:”You can get this on YouTube”
—surely a much better source for science than peer-reviewed journals, scientific experts, the judge’s ruling, or the transcript of the actual movie
He could also find topics for discussion on YouTube that are less than a dozen years old: https://www.youtube.com/watch?v=huX1bmfdkyA
But then he wouldn’t have a decade’s worth of attack material to cut-and-paste from, so he’d need to think critically himself – and he’s likely not up to the challenge.
http://b50ym1n8ryw31pmkr4671ui1c64.wpengine.netdna-cdn.com/wp-content/blogs.dir/11/files/2014/05/climate-graph.png
Anonymous fraud graph showing LIA extending to 1930s which were the hottest years of 20th century: the dustbowl years of “The Grapes of Wrath” when farmers emigrated to California.
For sheer incompetence KooKoo, you win the prize. :)
In fact CO2 increases AFTER warming, on a timelag of about 800+-200 years. 57% approx of CO2 in atmosphere comes from outgassing from tropical oceans. Man’s contribution to CO2 is less than 4%.
http://www.c3headlines.com
Click on Charts: get all the honest graphs you want, KooKoo brain.
The hottest years of the 20th century
….. IN THE UNITED STATES !
not globally !
Since Climate Changed for millions of years ARE Caused by the Milankovitch CYCLES….not by CO2…and CO2 (rise & fall)
in the atmosphere is cu
Incoherent rant.
Global climate is driven by redistribution of Sun’s heat from Tropics to Poles. CO2 is plant food & has NEVER been shown to have significant effect on temps.
CO2 LAGS: It’s an effect, dummy, not a cause of heating. :) :)
CO2 LAGS….DUH! Tell us something New….
for millions of years, Milankovitch cycles controlled
GLACIATIONS…..and Inter Glacial Warm periods.
As the Earth Warms, plants grow, animals copulate etc….
As the Earth Cools, plants die, animals die off etc….
And CO2, Methane, etc increase or decrease AS PART OF THAT Natural Cycle…..they LAG as effects of the Glaciation process and the INTER glacial warm periods.
This Holocene Inter Glacial PEAKED in temps 8000-9000 years ago.
Since then temps have been falling in spits and spurts toward our NEXT GLACIATION.
THAT was TERMINATED in the mid to late 1700’s.
Look: http://www.realclimate.org/images//Marcott.png
WHAT TERMINATED earth’s most powerful natural cycle?
.
CLUE: What happened 4 millions years ago or 20,000 years ago is NO LONGER RELEVANT !
HINT: CO2 & Temperature Marriage:
https://www.bing.com/images/search?view=detailV2&ccid=%2f%2bt8mfVF&id=8999BA373F3B7B4F391B144E98514B474B7894CF&thid=OIP._-t8mfVFvINxHRaKkITjvAHaFT&mediaurl=http%3a%2f%2fzfacts.com%2fmetaPage%2flib%2fzFacts-CO2-Temp.gif&exph=377&expw=526&q=graph+co2+and+world+temperature+rise&simid=608046613771259242&selectedIndex=0&ajaxhist=0
CO2 does have beneficial effects in reasonable quantities.
for
over 800,000 years the GOLDI LOCKS levels for CO2…
has ranged from 180PPM to 280PPM !
TODAY, humans have raised that level well over 400PPM
…like taking an aspirin
….a little goes a long way
….a lot can kill.
…
“Police: Carbon dioxide led to death in McDonald’s bathroom
September 14, 2011 1:38 p.m. EDT
STORY HIGHLIGHTS
The carbon dioxide built up to toxic levels in the bathroom
An 80-year-old woman died after the incident September 7
lethal dose of carbon dioxide, authorities said Wednesday….”
…
“One person, recounting the fate of eight men and one woman who walked into a basement area where the gas had accumulated, said they “fell down DEAD
as if they had been shot.”
…
As plants have had a slight increase in growth rates from increased CO2 along with the resulting rise in temperatures….
Staple Grains that the world is dependent upon….have experience
dramatic
Loss of Nutrients.
LESS protein
LESS iron
LESS zinc
http://www.biocab.org/Carbon_Dioxide_Geological_Timescale.html
Useful graphs & article: “increases in CO2 beneficial to life on Earth.”
Going back ~600 million years, NEVER any correlation between CO2 & temps.
You’re flogging a dead horse, KOOKOO brain. :)
You need to go back to High School…
of course there WAS a intimate relationship between
Atmospheric Gas levels and Climate Changes…into and out of Glaciations.
Google the Milankovitch Cycles and learn something.
CO2 & Temperature Marriage:
https://www.bing.com/images/search?view=detailV2&ccid=%2f%2bt8mfVF&id=8999BA373F3B7B4F391B144E98514B474B7894CF&thid=OIP._-t8mfVFvINxHRaKkITjvAHaFT&mediaurl=http%3a%2f%2fzfacts.com%2fmetaPage%2flib%2fzFacts-CO2-Temp.gif&exph=377&expw=526&q=graph+co2+and+world+temperature+rise&simid=608046613771259242&selectedIndex=0&ajaxhist=0
Which factor is swiftly changing the earth’s climate?
Vaughan Pratt, Professor (Emeritus since 2000) at Stanford University (1981-present)
Dec 22, 2017
Which factor is swiftly changing the earths climate?
Well,
one often-mentioned factor is CO2.
.
“Over the past millennium this graph, most of which is obtained from Antarctic ice cores, shows CO2 holding steady at 280 ± 5 ppm up to 1800, when global population was about a billion people and sailing ships and the horse-and-buggy were the most advanced forms of transportation,
consuming relatively little energy per capita compared with today.
.
Since then Earths’ population has grown to seven billion people, each consuming an order of magnitude more energy than back then, almost entirely by burning carbon-based fuels and releasing the resulting CO2 into the atmosphere as by far the most convenient place to put it.
.
* In the late 1700s Swiss polymath and alpinist Horace de Saussure was puzzled by why mountains were much colder at the top, despite being closer to the Sun and having less atmosphere between them and the Sun.
.
It was well known at the time that glass tended to trap heat from the Sun, so de Saussure speculated that the atmosphere was trapping heat the way glass does.
.
To confirm the heat-trapping ability of glass de Saussure
built a nested stack of boxes each with a glass window at top.
.
He found that successively deeper boxes were hotter,
with the innermost one hot enough to cook fruit.
In 1826
Joseph Fourier published a book in which he calculated that
without de Saussure’s heating mechanism as applied to the atmosphere there was not enough heat from the Sun to prevent the oceans from freezing over.
In the 1850s
Irish physicist John Tyndall invented this gadget.
It allowed him to measure the heat absorbing properties of gases placed in the long tube at top center.
He found that gases and vapors whose molecules had three or more atoms, such as water vapor and CO2,
absorbed much more of the thermal radiation passing through the tube than did two-atom molecules such as oxygen and nitrogen.
He concluded that the water vapor in the atmosphere was responsible for the heat trapping effect that de Saussure had guessed at and that Fourier had shown was necessary to keep the oceans from freezing over.
In 1878
American astronomer Samuel Langley, who later founded the Smithsonian Astrophysical Observatory, invented the bolometer, an extremely sensitive infrared thermometer that could detect the warmth of “a cow quarter of a mile away”.
In 1896
Swedish chemist and Nobel laureate Svante Arrhenius
used Langley’s bolometer to measure the heat from the Moon at various altitudes above the horizon in order to estimate the dependence of atmospheric heat trapping on amount of water vapor and CO2 along the line of sight to the Moon, a much longer path near the horizon than at 45 degrees.
Subtracting the expected influence of water vapor gave him that of CO2. From these measurements he concluded empirically that each doubling of CO2 trapped about the same amount of heat, though without offering any explanation of why the dependency on concentration
should be logarithmic as opposed to say the square root.
(Today we can see from the HITRAN tables for CO2 absorption lines that each doubling of CO2 brings 60–80 more lines into play, each line blocking about the same small amount of atmospheric window to space.)
But why CO2 and not water vapor?
.
Well, Arrhenius’s interest was in the much higher temperatures of a hundred million years ago that some geologists of the time were claiming.
.
Knowing that water vapor could not change much due to the Clausius-Clapeyron relation, he reasoned that the next candidate in line for significant heat trapping ability must be CO2 and that it must have been much higher back then.
.
His fellow Swede,
physicist Anders Ångström, disputed Arrhenius’s theory on the ground that the absorption bands would have saturated well before reaching that level, but what neither Swede knew back then was that CO2 had more than 30,000 absorption lines most at strengths insufficient to play any role until CO2 had reached far higher than the 6000 ppm of a hundred million years ago.
.
* * None of this history is in dispute today in scientific circles, other than by a very few scientists who reject the idea that if CO2 continues along the trajectory in the first graph above, by 2100 considerable damage will have been done both to the biosphere and to coastal real estate valuations.
***
https://www.bloomberg.com/graphics/2015-whats-warming-the-world/
CO2 & Temperature Marriage:
https://www.bing.com/images/search?view=detailV2&ccid=%2f%2bt8mfVF&id=8999BA373F3B7B4F391B144E98514B474B7894CF&thid=OIP._-t8mfVFvINxHRaKkITjvAHaFT&mediaurl=http%3a%2f%2fzfacts.com%2fmetaPage%2flib%2fzFacts-CO2-Temp.gif&exph=377&expw=526&q=graph+co2+and+world+temperature+rise&simid=608046613771259242&selectedIndex=0&ajaxhist=0
Complete garbage. The Earth is NOT surrounded by glass, dummy.
THE ONLY RELATIONSHIP EVER SHOWN BETWEEN CO2 & TEMPS IS CO2 LAGS TEMP RISE BY ~ 800 yrs + or _ 200 yrs, dummy.
95% + of greenhouse effect is H2O, water vapour.
< less than 4% is CO2.
Of the CO2 in the atmosphere 95% + is produced by nature.
< less than 4% is produced by man.
Sources of CO2 are 57% outgassed by warm tropical oceans, volcanoes & decaying vegetation etc.
Refer biocab graphs & articles: & Dr Tim's latest book:
Ordovician Ice Age occurred ~450 Million yrs ago with atmospheric CO2 above 4000 ppmv.
Science TAUGHT you that CO2 Trailed in past eras….because they were part of the Milankovich Cycles…
Google and LEARN !
Science TEACHES you today that those past events
do not apply TODAY !
Look:
CO2 & Temperature Marriage:
https://www.bing.com/images/search?view=detailV2&ccid=%2f%2bt8mfVF&id=8999BA373F3B7B4F391B144E98514B474B7894CF&thid=OIP._-t8mfVFvINxHRaKkITjvAHaFT&mediaurl=http%3a%2f%2fzfacts.com%2fmetaPage%2flib%2fzFacts-CO2-Temp.gif&exph=377&expw=526&q=graph+co2+and+world+temperature+rise&simid=608046613771259242&selectedIndex=0&ajaxhist=0
WITH the rise of CO2 to the extraordinary levels they are at today….we KNOW that nutrient levels in staple crops have disproportionately DECLINED…
CO2 increases MAY be beneficial TO PLANT LIFE on Earth….but you need to look in the mirror and realize that YOU ARE NOT A PLANT ! !
ALL animal life on earth creates CO2 as a waste product of digestion.
We exhale this waste
just as WE POOP away that waste
just as WE PEE away that waste.
WHY?
Because they are harmful to us….animals.
CO2 is Heavier than our atmosphere and settles in low levels, protected glades, sealed rooms, and basements.
Every large building on earth is required to have a fresh air recirculation system because of the buildup on CO2……
CO2 is a Poison…AND CO2 forces Oxygen out of the room and by this method can suffocate and KILL.
Yes, CO2 is used in greenhouses to prompt quick growth in seedlings….UNDER STRINGENT SAFETY PRECAUTIONS AND LIMITS FOR HUMANS…
WHY ?
“One person, recounting the fate of eight men and one woman who walked into a basement area where the gas had accumulated, said they “fell down DEAD as if they had been shot.”
*
**
“Police: Carbon dioxide led to death in McDonald’s bathroom
September 14, 2011 1:38 p.m. EDT
STORY HIGHLIGHTS
The carbon dioxide built up to toxic levels in the bathroom
An 80-year-old woman died after the incident September 7
lethal dose of carbon dioxide, authorities said Wednesday….”
***
*
“What is the LD50 value of carbon dioxide?
The LC50 (Lethal Concentration which kills 50% of the exposed animals in 1 hour)
is 4% for rats and 10% for humans.
CO2 is heavier than air,
so the concentration near the floor will be much higher,”
as well as protected glades, basements and sealed rooms.
Higher Concentrations of CO2 in the Atmosphere increases incidents of
threatening concentrations at ground levels and basements.
***
“Police: Carbon dioxide led to death in McDonald’s bathroom
September 14, 2011 1:38 p.m. EDT
STORY HIGHLIGHTS
The carbon dioxide built up to toxic levels in the bathroom
An 80-year-old woman died after the incident September 7
lethal dose of carbon dioxide, authorities said Wednesday….”
***
*
“What is the LD50 value of carbon dioxide?
The LC50 (Lethal Concentration which kills 50% of the exposed animals in 1 hour) is 4% for rats and 10% for humans. CO2 is heavier than air, so the concentration near the floor will be much higher,”as well as protected glades, basements and sealed rooms.Higher Concentrations of CO2 in the Atmosphere increases incidents of threatening concentrations at ground levels and basements.”
***
Carbon Monoxide (CO) is a poison. Boiler exhausts etc.
Carbon Dioxide (CO2) is plant food.
“Commercial greenhouses use 1200 ppmv concentrations of CO2, which was the average of the last 300 million years, because plants function best at that level.
The IPCC says present CO2 levels are 400 ppmv.
Al Gore says it’s the highest ever. Actually, it’s the lowest for 600 million years.”
I paraphrase from top climatologist Dr. Tim Ball’s latest lovely little book, page 28: Human Caused Global Warming the biggest deception in history.
If CO2 levels drop to 200 ppmv, plants die.
Gore is a liar & you are a moron?
YOU are a liar !
YOU ARE GROTESQUELY irresponsible with this comment !
Carbon Dioxide is a POISON and an Asphyxiant.
1.
Being Heavier than air…it settles in sealed rooms, protected glades, and basements…depriving animals of life.
2.
“…severe carbon monoxide poisoning causes confusion, unconsciousness, chest pain, shortness of breath, and coma.”
***
“”One person, recounting the fate of eight men & one woman who walked into a basement area where the gas had accumulated, said they “fell down DEAD as if they had been shot.”
***
Commercial Green Houses do use CO2 and human exposure to those high levels of this GAS are strictly limited for health reasons.
***
HUMANS have never existed with CO2 LEVELS this high.
..Through out our entire existence on earth, CO2 levels have been between 180 PPM and 280 PPM.
*
TODAY humans have raised these levels over 410PPM.
*
EVERY large building on earth has been forced to install
Fresh Air Recirculation Systems in order to fight off the symptoms of CO2 poisoning:
“…headache, nausea, vomiting, drowsiness,
poor coordination confusion, unconsciousness, chest pain, shortness of breath, and coma….”
******
*****
YES, CO2 does stimulate Plant Growth….more so weed growth.
RISING CO2 levels have led to NUTRIENT LOSS in the world’s staple grains:
LESS PROTEIN
LESS ZINC
LESS IRON
etc.
CLEARLY the goldilocks levels for Human Life is where
CO2 levels have been throughout every step man has taken on earth…..180 PPM to 280PPM.
HUMANS and all animals EXHALE CO2 as a WASTE PRODUCT….just like PEE and POOP….a poison !
TRY EATING VEGITABLES fertilized with PEE and POOP and send flowers to your grave.
” Carbon Dioxide Intoxication and Carbon Dioxide Poisoning
As the concentration of carbon dioxide increases, people start to experience carbon dioxide intoxication, which may progress to carbon dioxide poisoning and sometimes death. Elevated blood and tissue levels of carbon dioxide are termed hypercapnia and hypercarbia.
.
Carbon Dioxide Poisoning Treatment
.
Treatment of carbon dioxide intoxication or carbon dioxide poisoning involves getting carbon dioxide levels back to normal in the patient’s bloodstream and tissues. A person suffering from mild carbon dioxide intoxication typically can recover simply by breathing normal air. However, it is important to communicate a suspicion of carbon dioxide intoxication in case the symptoms worsen so that proper medical treatment may be administered. If multiple or serious symptoms are seen, call for emergency medical help. The best treatment is prevention and education so that conditions of high CO2 levels are avoided and so you know what to watch for if you suspect the levels may be too high.
Reference: EIGA (European Industrial Gases Association, “Carbon Dioxide Physiological Hazards – Not Just an Asphyxiant”, retrieved 01/09/2012.
Carbon Dioxide Poisoning | Causes of Carbon Dioxide Poisoning or Hypercapnia
So if I climb a mountain and get closer to the sun I will get warmer????
As part of the Milankovitch cycles which causes Ice Ages & Ends Ice ages….CO2 does indeed lag a bit … less that a century ….but is intimately involved in Earth Warming and Earth Cooling.
THE FACT THAT YOU NEVER READ OVER 200 YEARS of research shows clearly you are not qualified to comment .
1856
“…the work of Eunice Foote, who three years prior to the start of Tyndall’s laboratory research, conducted similar experiments on absorption of radiant energy by atmospheric gases, such as CO2 and water vapor.
.
The presentation of her report at a major scientific convention in 1856 was accompanied by postulation that even modest increases in the concentration of CO2 could result in significant atmospheric warming.”
http://www.searchanddiscovery.com/..
.
CO2 is rising sharply due to human activity.
.
Satellite & surface measurements find less energy is
escaping to space at CO2/H2O (& other Green House Gasses) absorption wavelengths.
http://www.woodfortrees.org/plot/gistemp/from:1980/plot/gistemp/from:1980/trend/plot/gistemp/from:1997/plot/gistemp/from:1997/trend
POPPYCOCK, as Dr David Bellamy said, before the BBC sacked him.
Aerosols & Greenhouse gases drive global warming??????
Such CRAP. HAHAHAJAHA
Dr. Bellamy HAS NO Climate, Physics, Chemistry training to make the STATEMENTS he made on the BBC…..
He is a botanist.
By and large, Aerosols cool the planet…
“Aerosols and Clouds (Indirect Effects) Whereas aerosols can influence climate by scattering light and changing Earth’s reflectivity, they can also alter the climate via clouds. On a global scale, these aerosol “indirect effects” typically work in opposition to greenhouse gases and cause cooling.
Aerosols: Tiny Particles, Big Impact : Feature Articles
https://earthobservatory.nasa.gov/Features/Aerosols/page4.php”
CO2 & Temperature Marriage:
https://www.bing.com/images/search?view=detailV2&ccid=%2f%2bt8mfVF&id=8999BA373F3B7B4F391B144E98514B474B7894CF&thid=OIP._-t8mfVFvINxHRaKkITjvAHaFT&mediaurl=http%3a%2f%2fzfacts.com%2fmetaPage%2flib%2fzFacts-CO2-Temp.gif&exph=377&expw=526&q=graph+co2+and+world+temperature+rise&simid=608046613771259242&selectedIndex=0&ajaxhist=0
https://en.wikipedia.org/wiki/Effects_of_global_warming#/media/File:2000_Year_Temperature_Comparison.png
http://www.woodfortrees.org/plot/gistemp/from:1980/plot/gistemp/from:1980/trend/plot/gistemp/from:1997/plot/gistemp/from:1997/trend
Trying to say a man is not qualified to comment is a Fascist attitude.
Suck on that HitlerKoo.
TELL that to your next doctor when you ask your local garbage collector to examine your FATAL wound.
QUALIFICATIONS DON’T COUNT !
https://www.bloomberg.com/graphics/2015-whats-warming-the-world/
Abstract
http://advances.sciencemag.org/content/3/3/e1601545.full
CO2 and temperature link
LOOK:
https://www.bing.com/images/search?view=detailV2&ccid=%2f%2bt8mfVF&id=8999BA373F3B7B4F391B144E98514B474B7894CF&thid=OIP._-t8mfVFvINxHRaKkITjvAHaFT&mediaurl=http%3a%2f%2fzfacts.com%2fmetaPage%2flib%2fzFacts-CO2-Temp.gif&exph=377&expw=526&q=graph+co2+and+world+temperature+rise&simid=608046613771259242&selectedIndex=0&ajaxhist=0
1880 to 2000? What a pathetic little segment of Earth’s 4,500 MILLION years to focus on. A shame that defective little graph fails to show ~ 20 years no warming. :)
A slightly longer perspective. NO CORRELATION EVER, long term, CO2 & TEMPS. Apart from Vostok ice cores : CO2 rises AFTER temps on 800 + – 200 year time lag. :) This graph is NOT cherry-picked to start at the end of the LIA, Little Ice Age, KOOKOO brain.
http://www.biocab.org/Carbon_Dioxide_Geological_Timescale.html
For more honest graphs/chatrs, if by any weird chance you’re interested in honesty, :), http://www.c3headlines.com
Click on Quotes if you’re maybe interested in the agendas/people pushing the scam.
US HEAT WAVES in the 30’s
or
CHINESE HEAT WAVES in the 21st century
are not proof of or disproof of GLOBAL WARMING
SEE that word “GLOBAL”
THAT means from all around the world at the same time…averaged out over decades, centuries, millennia.
Got the concept ? ? ? ?
Book: Heaven and Earth global warming: the missing science, by geologist Prof. Ian Plimer.
Proof that the MWP (Medieval Warm Period) was both global & warmer than the present (stalled for ~20 yrs) warming.
The Roman & Minoan warm periods were also warmer than now.
Well before human produced CO2 became a POSSIBLE influence on global climate round about 1950s.
You’re a loser KOOKOO.
WHERE IS THE LINK ???
101 responses to Ian Plimer’s climate questions
The Australian Department of Climate Change and Energy Efficiency have put together a handy and recommended resource: Accurate Answers to Professor Plimer’s 101 Climate Change Science Questions. This is in response to Plimer’s book How To Get Expelled From School, a compilation of climate misinformation targeted at school children. One section of the book features 101 questions that he suggests children ask their teachers. The DCCEE summarise it well:
“Many of the questions and answers in Professor Plimer’s book are misleading and are based on inaccurate or selective interpretation of the science. The answers and comments provided in this document are intended to provide clear and accurate answers to Professor Plimer’s questions. The answers are based on up-to-date peer reviewed science, and have been reviewed by a number of Australian climate scientists.”
The Medieval Warm Period roughly comparable to the temps…mid 20th century
No where near todays temperatures.
In Science, it is clear that this Holocene Inter Glacial Period reached its peak temperatures 8000-9000 years ago…
and
Temperatures have been falling in spits and spurts since then.
LOOK:
http://www.realclimate.org/images//Marcott.png
Fake graph.
Medieval, Roman & Minoan periods were all warmer than now. ALL within modern Holocene warm period since coming out of Pleistocene Ice Age approx 15,000 years ago.
20th century warming is NOT exceptional.
Warmth brings better crops & more & cheaper food.
If you’re afraid of a little warmth, go live in Antarctica, fool.
The 3 last interglacials, approx every 100,000 years were all warmer than now, meathead. The present warmth, now declining toward a coming cool period, is entirely within the limits of past natural variations.
drtimball.com
His latest booklet, with lots of very simple graphs for non-scientists:
Human Caused Global Warming The Biggest Deception In History
I much recommend this.
http://www.c3headlines.com
Many great Charts & Graphs & Articles
Click on Quotes for the Depopulation, Deindustrialisation & One World Nazi Govt Agenda behind the scam.
CO2 & Temperature Marriage:
https://www.bing.com/images/search?view=detailV2&ccid=%2f%2bt8mfVF&id=8999BA373F3B7B4F391B144E98514B474B7894CF&thid=OIP._-t8mfVFvINxHRaKkITjvAHaFT&mediaurl=http%3a%2f%2fzfacts.com%2fmetaPage%2flib%2fzFacts-CO2-Temp.gif&exph=377&expw=526&q=graph+co2+and+world+temperature+rise&simid=608046613771259242&selectedIndex=0&ajaxhist=0
***
Killer COAL ELECTRIC GENERATION:
.
Thanks to Trump’s economic / ideological agenda…
.
Profits still go to the BILLIONAIRE ENERGY MONOPLIES..
..
Killer coal increases AUTOMATION
…to forestall the need to hire employee back.
but
the thousands of open air, Earth-Lined, TOXIC, pits & ponds & old mine shafts are used to store these TOXIC WASTES, with out standards or supervision !
.
BILLIONS & BILLIONS of gallons of TOXIC COAL ASH WASTE !
.
Dumping Toxic Waste !
Every year !
.
EACH OF the nation’s coal electric plants produces
140 million tons of coal ash pollution per year the toxic by-product that is left over after the coal is burned.
To date nearly 2000 DUMP sites in 47 states.
.
All that ash has to go somewhere, so it’s dumped in the backyards of power plants across the nation —into earth lined open-air pits & precarious surface-waste ponds.
.
Many/most of these sites lack any adequate safeguards, leaving nearby communities at risk from potential large-scale disasters like the massive coal ash spill in Tennessee in 2008
&
from gradual yet equally dangerous contamination as coal ash toxins seep into drinking water sources
or
are blown into nearby communities.
.
Coal ash pollution contains high levels of toxic heavy metals such as
arsenic,
lead,
selenium,
and other cancer-causing agents.
.
The public health hazards and environmental threats to nearby communities from unsafe coal ash dumping have been known for many years, including increased risk of cancer, learning disabilities,
neurological disorders, birth defects, reproductive failure, asthma (1 million new cases/yr.), and other illnesses.
.
Coal ash is not subject to federal protections, and state laws
governing coal combustion waste disposal are weak or nonexistent.
.
The result:
Millions of tons of TOXIC coal ash are being stored in
ponds,
pits,
landfills, &
abandoned mines.
.
Many of these sites lack any, let alone adequate safeguards, leaving nearby communities at risk from potential large scale disasters like the .
December 22, 2008,
TVA disaster in Tennessee in which a EARTHEN dike holding back decades’ worth of coal ash failed at the Kingston Fossil Plant,
flooding the surrounding residential area with more than one billion gallons of toxic coal ash —enough to flood more than 3,000 acres one foot deep.
.
While dramatic events like the coal ash spills in Tennessee
garner national media attention, dangerous contaminants are
quietly seeping from coal ash dumps into groundwater supplies across the country or blowing into the air of communities, exposing people and wildlife to toxic substances.
…data indicates
that at least 535 (nearly 2000 in 47 states by other estimates)
coal ash ponds
KNOWN to operate without a simple liner to prevent dangerous chemicals and heavy metals from reaching drinking water sources.
.
The Hazards of Coal Ash Living near a wet coal ash storage pond is significantly more dangerous than smoking a pack of cigarettes a day, according to a risk assessment done by the EPA.
.
The toxins found in coal ash have been linked to organ disease, cancer, respiratory illness, neurological damage, and developmental problems.
.
People living within one mile of unlined coal ash ponds can have a 1 in 50 risk of cancer—more than 2,000 times higher than what the EPA considers acceptable.
.
Coal ash contains arsenic, lead, mercury, and selenium, as well as aluminum, barium, boron, and chlorine.
All can be toxic.
Particularly where there is prolonged exposure,
these toxins can
cause cancer,
heart damage,
lung disease,
respiratory distress,
kidney disease,
reproductive problems,
gastrointestinal illness,
birth defects,
impaired bone growth in children, and behavioral problems.
.
In short, coal ash toxics have the potential to injure all of the major organ systems in adults (including pregnant women) and children.
Exposure to toxic coal ash can lower birth rates, cause tissue disease, slow development,
and
even kill plants and animals, leading to changes in wildlife concentrations and disruptions to entire ecosystems.
.
The toxic pollution from coal ash builds up in exposed animals and plants, causing the pollution to make its way up the food chain when they are eaten.
.
Children are more susceptible to the health impacts of coal ash
—and according to the EPA,
1.54 million children live near coal ash storage sites.
.
Not only is coal ash toxic, it is also likely to grow increasingly dangerous.
.
Air pollution control technologies, like scrubbers, selective catalytic reduction, and activated carbon injection, capture mercury and other hazardous air pollutants and are able to stop increasing amounts of toxic pollution from going up the smokestacks.
.
THERE IS NO SUCH THING AS CLEAN COAL !…Just a little cleaner coal, that’s all.
.
However,
when those pollutants are captured they are shifted from the air to the coal ash.
.
Mercury and other pollutants that previously contributed to air pollution
are now becoming solid wastes—and when they leach into water, their toxicity is carried into the water as well.
.
Unfortunately, one toxic environmental problem is being traded for another.
Book: Merchants of despair, radical environmentalists, criminal pseudo scientists, & the fatal cult of antihumanism.
By nuclear PhD engineer Robert Zubrin, with 9 patents to his name or pending.
Nuclear power is by far the cleanest & safest reliable power source.
Wind & Solar are both ridiculously expensive & ridiculously unreliable.
Get a brain & do some research KOOKOO.
So you now agree that CO2 and Temps are rising and we need to move to Nuclear, Hydro, Solar, Wind etc.
https://blogs.scientificamerican.com/plugged-in/wind-energy-is-one-of-the-cheapest-sources-of-electricity-and-its-getting-cheaper/
Plugged In
.
Wind Energy Is One of the Cheapest Sources of Electricity, and It’s Getting Cheaper
A comprehensive survey of the wind industry shows wind energy is routinely
purchased in bulk for just two cents per kilowatt-hour—and turbines
are only getting cheaper, bigger, and better
By Robert Fares on August 28, 2017
.
Wind Energy Is One of the Cheapest Sources of Electricity,
PLUS
It’s Getting Cheaper
Credit: Richard Hawley Flickr (CC BY-ND 2.0)
Earlier this month, the U.S. Department of Energy (DOE) released
the latest iteration of its annual Wind Technologies Market Report,
which pulls together a wealth of data to track trends
in the cost, performance, and growth of wind energy.
.
Wind & Solar as well as Nat. Gas have led to dramatically lower
electric rates in TEXAS as it undercuts the Killer Coal
Monopolie’s hammer lock on pricing.
Science Told You that CO2 was intimately involved in Climate changes millions of years ago…..
Science tells you today, that this era is different.
CO2 was part of the Milankovitch cycle then ! !
CO2 today is COUNTERING the Milankovitch cycles ! !
This Holocene Inter Glacial Era peaked in temperatures when the Earth in orbit was close to the sun….7000-8000 years ago.
Since then temps have been falling in spits and spurts.
To THIS DAY, Earth is still being pulled AWAY from the sun
To THIS DAY, Earth’s Axial Tilt is AWAY from the sun.
We should still be heading toward a Glaciation.
Hell, much of the last 1000 years ago has been called the LITTLE ICE AGE.
…
ICE AGE because of the cooler temps.
LITTLE because it ended.
LOOK: http://www.realclimate.org/images//Marcott.png
http://notrickszone.com/wp-content/uploads/2017/02/CO2-Emissions-GtC-1900-2016.jpg
You are a scientific illiterate, a moron.
Milankovitch cycles deal with the variable Sun-Earth relationships of orbit, axis tilt & precession. These affect Earth’s climate on cycles of ~ 100,000 yrs, ~21,000 yrs & 41,000 yrs.
They have NAFF ALL to do with CO2, idiot.
CO2 rises AFTER oceans warm, dope.
The Earth’s axis tilt gives us the seasons: Northern Hemisphere tilts toward the Sun = Summer in the N. Hemisphere & Winter in the South.
Your ignorance is so total, you no longer merit any reply, sphintcer.
So, dear girl…explain WHY
Earth’s Orbit is still pulling the Earth away from the Sun….yet our 7000-8000 year descent in temperatures toward the next Glaciation.
…HAVE CEASED…
indeed, temps are rising in conflict with Milankovitch cycle.
.
Earth Axial Tilt is still away from the Sun….yet
our 7000-8000 year descent in temperatures toward the next Glaciation..
…HAVE CEASED
etc. etc.
SEE?
http://www.realclimate.org/images//Marcott.png
..HINT:
CO2 & Temperature Marriage:
https://www.bing.com/images/search?view=detailV2&ccid=%2f%2bt8mfVF&id=8999BA373F3B7B4F391B144E98514B474B7894CF&thid=OIP._-t8mfVFvINxHRaKkITjvAHaFT&mediaurl=http%3a%2f%2fzfacts.com%2fmetaPage%2flib%2fzFacts-CO2-Temp.gif&exph=377&expw=526&q=graph+co2+and+world+temperature+rise&simid=608046613771259242&selectedIndex=0&ajaxhist=0
When one is as ignorant as you, perhaps avoid name calling next time.
Eras Ago….there was some accuracy to what you say about CO2 and the dozens of other Green House gases have over powered EARTH’S most powerful natural Cycle…..Glaciations
Out of 70-80 claims in “inconvenient truth” were accurate.
9 were inaccurate…the judge allowed the movie to be shown in Schools across the UK with those minor corrections….
3 of those 9 errors, BECAME errors by research result after the movie was released.
“LORD” Monckton has been ordered by parliament, a decade or more ago, to stop calling himself a ‘LORD’ when he is NOT a ‘LORD’ !
…
Speaking of liars…..the court pointed to 9 “errors”….3 of which were believed accurate when the Movie was released, but current research disproved….
AND
the court OK’ed release to schools for education.
.
THERE were around 80 claims in the movie that science vindicates.
The liar Gore, who runs a mile from debating Lord Monckton, is still repeating the 9 “errors of fact” identified by Judge Burton in his fraud factory 2006 scare porn film. In fact there are 35 “errors” in total.
Counting exaggerations etc there are 60 “errors”
The chances of 60 “errors” in a row are billions to one against.
Lord Monckton can be found on youtube debunking Gores’ frauds.
WHAT ABILITIES??
“You could take my word that the idea of AGW is a hoax but I’m sure you won’t because it’s something that you want to believe is true.”
What an absurd assumption. And what arrogance. You could present verifiable facts and data with references to their sources and try to convince us that you know something we do not. Instead you spam the thread with long-discredited drivel from denialist sites.
I have presented varifiable facts and WHAT have you presented? SNOPES talking about something else.
SNOPES talking about your misrepresentations.
https://www.bing.com/videos/search?q=youtube+why+I+left+greenpeace&view=detail&mid=38C867C7E9F9E3299DC538C867C7E9F9E3299DC5&FORM=VIRE
https://www.bing.com/videos/search?q=youtube+why+I+left+greenpeace&view=detail&mid=4776AD69D8E53A56E1BC4776AD69D8E53A56E1BC&FORM=VIRE
People that know what they’re talking about are speaking out. And morons like LTJ feel that it threatens their religion.
And once again personal insults and imbeciles presented as experts. Will you never learn a new trick, old dog?
Those “imbeciles” that have degrees in natural science and started Greenpeace which is where “climate change” crap came from. What did you say your credentials were?
What credentials are required here beyond basic literacy?
The Greenpeace wiki will inform you that the beginnings of the organization had nothing to do with climate change, Greenpeace was wholely concerned with nuclear testing.
The same wiki links you to information on Patrick Moore, who has a biology/ecology background and no expertise whatsoever in climate science.
Trump just stopped government research into climate change. So I guess that NASA is going to have to start telling the truth again.
So I guess your religion is dying out. Too bad you didn’t watch that talk by those ex-Greenpeacers but then that would have been a sin in your religion.
A temporary and rather pyrrhic victory.
And I’m afraid the religion that is dying out is that of dinosaurs such as yourself. The demographics suggest that the young know the truth already, whether NASA is lobotomized or not: http://www.pewinternet.org/2015/07/01/americans-politics-and-science-issues/pi_2015-07-01_science-and-politics_2-03/
I’m not going anywhere. And while my lifespan will no doubt be over 100 years the Millennials have a severely limited lifespan since you believe exercise to be playing a video game.
And I absolutely love your idea that science is nothing more than agreement from untrained people that have been propagandized by people who intend to make money off of them.
I’m headed back out to finish shovelling eight inches of snow off my sixty foot long doublewide driveway. What did you do for exercise today?
I just passed 4,000 miles of riding my bicycle for the year despite losing 3 of the prime riding months. I have over 100,000 feet – more than three Mt. Everests – of climbing in that time.
Nice. That’s about four times the cycling I managed to get in.
By the way stupid – tell us what University offers a “degree in climate science”?
There is no such thing. It is entirely self identified as you yourself prove by attempting to use your entire lack of scientific knowledge and yet tell us all about global warming.
Which of the natural sciences do you regard as pseudoscience?
It must be your refusal to watch those videos that has you so confused as to the subject of conversation.
I am probably nearly twice your age. I will probably live to be at least 100. On one side of my family we are mostly genius IQ. The word “slave” comes from the name of our race.
On the other an Austrian aristocrat who married my Irish grandmother whose gg-parents had been sold off of auction blocks as slaves in Haiti by the British.
You see, I have a dog in this fight. It’s called a free country. The Constitution was written not to protect us from people like you who I could drop with one single punch, but from a government whose lust for power would GLADLY turn this into a dictatorship in one moment as Obama attempted to do.
You whimpering little cowards who want a dictator to protect you from the world around you have lost for the last time. You will NEVER win again.
You’re probably not close to twice my age. But since you’re so proud of yours, perhaps you could use a bit of perspective: https://www.vox.com/2017/12/20/16772670/baby-boomers-millennials-congress-debt
Congrats….so you know jack about climate.
By all means let see your intellectual abilities: define “climate”.
Since you do not have the knowledge to judge either site why are you telling us that you favor one over the other?
“Since you do not have the knowledge…”
You presume many things that are untrue.
Your comments about those two sites plainly shows that you don’t have the slightest scientific knowledge. You simply like the whacko DeSmogBlog and that alone gives us all the knowledge we need about you.
If you’re so offended, then start calling for public debate. Mikey Mann won’t debate or answer questions on his position papers. Science is all about debate and asking questions. AGW is not Science.
Charles – no scientist would debate this – they know that it’s a hoax and has been from the start. We can even trace the date at which NASA started counterfeiting the data:
https://thsresearch.files.wordpress.com/2017/05/ef-gast-data-research-report-062717.pdf
This isn’t a case of debate – this should be a case of arrest, trial and prison.
Which 10 scientists would you like to see arrested, put on trial and imprisoned first?
What are the scientific credentials of the proprietor of PopTech?
Do you even know his last name?
It is ironic that you cite PopTech–known as the sleaziest smear site in the business–in order to call DeSmogBlog a smear sie.
I dont have to rely upon Popular Technology to know that DeSmogBlog is a smear site. All you have to do is read some of the articles there.
I would highly recommend wattsupwiththat.com for a scientific approach to climate.
Wattsupwiththat–a site run by a college dropout–is actually a science-denial and conspiracy theory site that is openly hostile to mainstream research scientists.
Much better is Realclimate.org.
Just go to both sites are read 2-3 articles.
Then let me know which one is science and which one is BS.
wattsupwiththat.com
Realclimate.org
Why should I do your work for you?
I’ll save you the trouble.
You will find that WUWT is science because all the articles support the skeptic point of view and because they claim that climate scientists are just in it for the money and the fraud. It also is very pro-Trump.
On the other hand, you will find that realclimate.org is BS because it is written for by leading climatologists, including Michael Mann and Gavin Schmidt and because it links to peer-reviewed science papers, which Anthony Watts at WUWT has told are always instances of pure BS
You don’t have any Science, dropping links is not Science.
Providing your sources might not be science, strictly speaking, but it is good form for those engaged in an intelligent debate.
If I drop a link. You’ll spend a month defecating all over it. Most of my statements are general knowledge.
How does a TRACE gas hold sway over global temp?
Can you on your own answer my question?
You and your little link will never be worthy of a month of my time – and since I doubt you could be made to understand the topic in any less time, I won’t bother with you any further.
Typical Brown SHIRT Propagandist reply. You refuse to address my question on how does a trace gas can influence global temp.
CO2 actually doesn’t do any green house crap.
If it did or does it negates Moles, Molarity, and disproves Avocado’s number.
Exactly WHAT science do you have on “your side”? What credentials do you have as a scientist? Only True Believers in the Church of Global Warming repeat idiotic ideas like you and your kind do. The IPCC report was based upon a NASA report that claimed that 600 papers all claimed positive climate change. After those papers were made public the authors of 400 of those papers were aghast and publicly claimed that their papers were either taken completely out of context or outright lied about. And that they DID NOT support man-made climate change. Of those “97% of ALL scientists support AGW” is included the American Medical Association and the Boy Scouts of America. Now there is a perfect example of the sort of “scientists” compose that 97%. And what does LTJ do? He tells us that the Oregon Petition is meaningless. That must be because he has such vast and well know credentials as a scientist himself.
How does CO2 @ 400 ppm hold any sway over the climate?
If I understand you correctly you are citing an article in a popular magazine written by a woman with a degree in Theater Arts?
You might think for one second about the Oregon Petition which has over 31,000 signatures including over 9,000 PhD’s including at least three Nobel laureates one of whom is Edward Teller – arguably the smartest man in the world since the death of Einstein – all of whom DENY that there is man-made global warming. Of these people includes past directors of NASA climate projects.
But you woman reporter with a degree in Theater Arts most surely trumps them.
BTW – the IPCC report was backed by a NASA report from only 600 scientists. Since that report was made public fully 400 of that 600 have claimed that their papers were taken out of context or completely misrepresented and that they DO NOT believe in AGW.
What we need more of is you people claiming knowledge through the use of articles from Popular Science. It demonstrates a real search for knowledge.
Claims that a man retired 40 years and dead for 14 supports your nonsense is rather difficult to verify.
Then by all means DON’T accept Edward Teller. Try and explain away the other 31,486 signatures, 9,028 PhD’s including the head of NASA’s weather satellite program, Dr. Roy Spenser. And by the way, what do you have to say about the study showing that NASA has counterfeited the temperature data that has been peer reviewed by top members of the EPA? https://thsresearch.files.wordpress.com/2017/05/ef-gast-data-research-report-062717.pdf
Perhaps you can join the boy scouts since they are PART of that 97% of “all scientists” who agree that there is Anthropogenic Global Warming. Another group that NASA provides as part of that 97% is the American Medical Association. I must say that those are certainly two groups with a lot of climate science to support NASA with.
It is no wonder that you provide a picture of a mosquito with your postings. Blood suckers normally hang together.
THERE is no evidence that 9000 PhD’s even signed the the petition since NO VERIFICATION PROCESS WAS used…and at least 5 PhD’s OBJECTED VEHEMENTLY to their names being used, demanded that their names be removed…and removal was DENIED by the Petition project.
“….The Oregon Petition was later criticized heavily on several grounds, to the point where the
National Academy of Sciences disavowed the petition,
despite the petition being spearheaded by its former president, Fred Seitz.
The vast majority of the verifiable signatories lacked any expertise in climate science; pranksters who submitted names like “Charles Darwin” and Star Wars characters got on the list because there was no process to authenticate the identities of the signatories; the petition was accompanied by a non-peer reviewed article from the non-indexed “Journal of American Physicians and Surgeons”, which is published by the very organization that organized the petition.
Whaaaaaaaaah, your CAN’T PROVE IT YOU CAN’T PROVE IT.
Tell us you moronic half wit – how can you prove NASA’s data? You yourself know absolutely NOTHING about science save perhaps pouring vinegar over baking soda.
More childish name-calling and silly use of CAPS. Makes you look so powerful and impressive!
Please stop lazily citing the silly Oregon Petition project…organized and coordinated by Art Robinson – hasn’t published a single peer-reviewed article on climate science. Robinson was president of the Oregon Institute of Science and Medicine a political advocacy group. He has extreme views on climate change, AIDS, homosexuality and evolution. The Oregon Petition is unreliable, thoroughly debunked rubbish.
Scientific American refuses to answer questions regarding AGW. That makes Scientific American a propaganda spreader. You can’t use S.A. links since S.A. refuses to answer those questions.
As I noted elsewhere – if they accept supposedly scientific articles from the pens of non-scientists who are because of their ineptitude with science open to all sorts of errors, they are neither Scientific nor American unless they publish disclaimers up front. Surely most scientific studies are too complex for a non-scientist to understand (for instance – many explanations of calculus use the name of a mathematician who invented a particular pattern. This would mean absolutely nothing to a non-mathematics specialist) and so it behooves a popular magazine to write more carefully explained abstracts so that their audience understands it. But if you write articles on very controversial subjects you have to be EXTREMELY accurate and that article absolutely was not.
…yet it seems you are unable to dispute the contents of the article in question, and instead are reduced to innuendo and questioning the credentials of the author.
I can dispute ANYTHING you have to say about AGW.
Denial is not debate.
This enters a particularly tricky area. Scientific American PUBLISHES articles and are not (strictly speaking) responsible for their content other than to try to avoid purposeful propaganda. I do not believe that the author of that article was purposely propagandizing people. She herself has been propagandized and having no science background, is unable to detect absolute bunkum.
I read every iussue of Scientific American for many years. There was always a leftward taint on several topics but much more science than politics.
The last issue that I read was on Global Warming. An entire issue devoted to the subject. There wasn’t even a chapter devoted to the sun or oceans or clouds. Just the usual CO2 bullshit.
Another decent publication destroyed by the science hating left.
Incapable of discussing the actual article in question once again, I see. Yet again simply dismissing a venerable decades-old source (while favoring bullshit from blog sites).
SciAmer has become political propaganda and dropped all pretense of science.
Decades ago it was venerable. Today it is BS.
As for your article, it states that there is a 1 in 20 chance of a 5C increase in temp and a 1 in 2 chance of a 4C increase in temp with business as usual. The rest of the article is horror stories about what they claim would happen with these temp increases.
There is absolutely zero discussion of how this result was arrived at. There is zero science in the SciAm article and lots of propaganda.
This temp prediction disagrees with IPCC AR5 which puts the temp increase at 1.5C to 4.5C. This is the same range that the IPCC quoted 30 years ago before $50 billion was spent on climate research. Usually research reduces the range of the estimate.
Well, this took 5 seconds to find: https://scripps.ucsd.edu/news/new-climate-risk-classification-created-account-potential-existential-threats
And I had specifically mentioned the actuarial perspective, most simplistically represented by this statement: “To put in perspective, how many of us would choose to buckle our
grandchildren to an airplane seat if we knew there was as much as a 1 in
20 chance of the plane crashing? With
climate change that can pose existential threats, we have already put
them in that plane.”
Care to discuss it?
If it took you 5 seconds to find it, why didn’t you quote it rather than the SciAm propaganda?
I hate to break it to you but this article is no different than your previous article. There is no discussion of why the temp will increase by 5C, 4C, or any other amount. There is just a lot of discussion of how bad it will be without any justification for that conclusion.
If you have an article backing up your claim of 1 in 5 chance of 5C increase, why dont you quote it?
You still haven’t specified which of the 8 points in my post that you disagree with so that it will be possible to have a discussion on a specific topic.
Maybe you object to this
“2) Greenland ice core data shows stable temperature for 10,000 years varying between 14-16C. The alarmist scare is based upon the thermometer temperature record that covers only 150 years or part of the current warm period that is unremarkable relative to the last 10,000 years. “
ROTFLMAO!!!
Once again you ignore the subject at hand. Once again you prove to be not only scientifically illiterate, but very basically so.
And once again you return to your eight points of idiocy, which span a gamut from utterly irrelevant to solved in seconds by simple google search.
Do it yourself. And then take your time and read carefully.
ROTFLMAO!!!
Once again you ignore the subject at hand. Once again you prove to be not only scientifically illiterate, but very basically so.
And once again you return to name calling.
I did read your garbage and once again it failed to provide any argument in favor of its conclusion.
You have no interest in a debate because all you have is hot air.
Read more carefully – much more carefully. The answers you want are there if you do. But when you rush through you get confused – as above, where somehow a 1-in-20 chance became 1-in-5 in your head.
So when are you going to ‘add a little science to the discussion’?
All you’ve added so far are some laughable unsupported junk-science claims you probably got from some blog
Typical global warming alarmist. All name calling, no facts.
Please pick one and tell me why you disagree with it. Then we can have a debate about the science without any name calling required.
Where is your science? What is your credential for talking about it?
May I ask what “science” you’ve added to the discussion other than telling other they don’t know what they’re talking about? That isn’t science you know – it’s 5th grade trash talk.
That 1.4 temp increase over a 100 years is within the margin of error.
Considering that we don’t have a good hold on long term patterns of weather, you are pretty close to correct. You most certainly aren’t proving anything if like Dr. Michael Mann you purposely leave out the Medieval Warm Period and the Little Ice Age which would show that our present warming trend is far less deviant than the past.
1.19 C in about 100 years.
1 C in about 7500 years by natural cycles
Do you see the significant difference ?
1C decrease in the last 7,500 years but many changes in between.
4C increase between 12,000 and 10,000 years ago.
1C increase between 8,100 and 7,800 years ago.
2C decrease between 6,400 and 6,000 ya.
1.3C increase between 5,000 and 4,500 ya.
1.5C decrease between 4,500 and 3,500 ya.
.9C increase between 3,300 and 3,000 ya.
1.7C decrease from 3,000 to 2,500 ya.
1.9C increase between 2,500 and 2100 ya.
1C decrease between 2,100 and 1,500 ya.
.7C increase between 1,500 and 1,100 ya.
1.3C decrease between 1,100 and 500 ya.
1.3C increase between 500 ya and today.
I don’t see any significant difference.
http://www.fortitudeenergyconsultants.rocks/climate-change-a-geological-perspective/
Absolute nonsense….little boy
Absolute nonsense….little boy
FRAUD ALERT!
THERE IS NO RECORD of these remarkably LARGE temperature changes.
NOR do those dates match known changes in temp.
This Inter Glacial Warm Period known as
the Holocene….peaked in temperatures about 8000 years ago…
From then for about 7500 years temperatures Gradually decreased
LOOK:
https://en.wikipedia.org/wiki/Effects_of_global_warming#/media/File:2000_Year_Temperature_Comparison.png
FRAUD ALERT
Marcott, your data, is based upon tree rings, that are notoriously inaccurate and subject to manipulation. Ice core data has been taken from several sites in Greenland and Antarctica and validate accuracy thru similar results.
Here is 10,000 years of the GISP2 ice core temperature record from Greenland.
https://wattsupwiththat.files.wordpress.com/2013/03/gisp2-ice-core-temperatures.jpg
Here is 25,000 years of the GISP2 ice core temperature record from Greenland.
https://wattsupwiththat.files.wordpress.com/2011/01/easterbrook_gisp2_fig1.png
Here is 400,000 years of the Vostok ice core temperature record from Antartica.
http://www.thelivingmoon.com/47brotherthebig/04images/Antarctica/415k-year-temp-graph.jpg
YOU SAY:
1) Every year the temperature swings about 60 degrees F. We are
supposedly in a crisis because the temp rose 1.4F (.8C) over 100 years.
.
* Those temperature Swings you speak of are ALL regional, not world wide….
* Natural Cycles, world wide, change temperatures 1C in 7500 yrs.
* Human agriculture / industry has driven temps up 1.19C in 100 yrs.
* Do you see the difference between 7500 years of natural adaptable changes versus 100 years?
.
2)
Greenland ice core data shows stable temperature for 10,000 years
varying between 14-16C. The alarmist scare is based upon the thermometer temperature record that covers only 150 years or part of the current warm period that is unremarkable relative to the last 10,000 years.
.
* We have over 800,000 years of dramatically accurate records of climate on earth…even your diversionary talk about thermometers is inaccurate…since we have centuries of thermometer readings…and hundreds of thousands of fossil records to compare.
* This is the Holocene inter glacial warm period. It peaked in temperatures about 8,000 years ago…and temps have been falling since then…as we descended into the next ice age…which suddenely terminated about 1750-1780.
LOOK:
http://www.realclimate.org/images//Marcott.png
.
* You choose to use Regional
( GREENLAND & only 1 core sample location at that )
to claim NO GLOBAL warming.
MANY, MANY ICE CORE SAMPLES around the world and on GREENLAND are significantly different than YOUR IDEOLOGICAL STATEMENT.
More over fossils, stalagmite cross sections, deep sea soil cores etc are always compared to verify accuracy.
.
3)
Water vapor accounts for 75% of the greenhouse effect, CO2 for 19%.
Man made CO2 emissions account for 1-2% of CO2 emissions.
* CO2 works WITH H2O which enhances EACH GAS ABILITY to capture and re-radiate Earth’s emissions of Low Energy Infra Red Heat Radiation back toward Earth.
(emitting I.R. Radiation is a cooling process…earth disposes of heat to the cold of space)
Interfere with this cooling process and what do you expect you will get…warming, of course.
4) The greenhouse effect of CO2 is exponentially reducing. From 0 to 20 ppm it is 1.5C. From 380 to 400 ppm, it is less than .05C.
* You are discussing Saturation.. a 75 year old THEORY that has been disproven, repeatedly ! !
Should Atmospheric gases threaten to saturate the atmosphere….the atmosphere merely raises its altitude…which in fact is a GLOBAL WARMING PROOF and the altitude of the Troposphere has been increasing….geometrically increasing the Cubic Miles of the troposphere.
.
5) From 1960 to today, CO2 ppm has increased steadily. From 1960 to 1980 temp decreased, from 1980 – 2000 temp increased, from 2000 – today temp has been stable.
* I have no idea where you got that mathematical WHIMSY from !
* Earth is VERY LARGE…and OCEANS/LAKES cover 71% of the surface and are miles deep….there is no one-to-one relationship…no rationale to believe that temps would rise in unison like the N.Y.C. Rockettes doing a Kick.
LOOK FOR YOUR SELF:
http://www.bom.gov.au/climate/current/annual/aus/2015/20150106_global_Tmean_plot.png
.
http://berkeleyearth.org/wp-content/uploads/2015/03/land-and-ocean-sea-ice-comparison-large.png
.
6) Temperature predictions made by the global climate models are wrong and getting worse with every passing year.
.
* ALL of the temperature readings have FALLEN well within the projections of IPCC for decades !
.
.7)
Sea level increased 8 inches in the 19th and 20th century. It is likely
to do the same in the 21st.
Even if the Arctic melts, it is only 2% of the ice and it wont increase sea level because it is floating.
* ..THAT 2% figure is nonsense.
* The Arctic is a VAST STORE HOUSE OF ICE, FAR greater than Antarctica.
AND
* We are not simply talking about Arctic ICE melting…there are 11,000 glaciers in ALASKA…and all but 3 valley glaciers are melting.
and the goes for mountain glaciers around the world.
* MUCH of ARCTIC ice is NOT floating but on many islands and greenland, Canada, Alaska, Siberia, Norway etc…
*
Antarctica with 90% (THAT IS JUST A LIE !) of the global ice is adding 8 inches of ice per year. During WW2 some airplanes crash landed in Greenland, recently they were found under 268 feet of ice.
* It is reasonable to think that snow would compact into ice in many regions quickly….that is why science is very careful about taking ice cores FROM OLD ICE.
.
* You speak of 8″ of sea level rise, seems to indicate this is from the 19th century thru today.
That 8″ of sea level rise from about 1880 to 2000…with the vast majority of that occurring during JUST THE LAST 25 YEARS.
…during the 1st half of the 20th century sea levels were rising 1.1 mm per year.
At the beginning of the 21st century we had increased sea level rise to 3 mm per year.
By 2016 THAT had increased to 3.7mm per year.
.
8) 150 years ago at 280 ppm CO2, we were dangerously close to a mass extinction (plants start to die at 180 ppm).
The increase in CO2 to 400 ppm has led to increased food production and the greening of the planet.
* Humans and nearly ALL LIFE ON EARTH has never existed at the level of atmospheric GASES AS HIGH as we have TODAY….let alone where we are headed.
* The GOLDILOCKS LEVEL of CO2 is between 180ppm to 280ppm.
THIS IS THE LEVEL we have maintained for over 800,000 years.
THIS IS THE LEVEL human beings and nearly every animal and plant has grown under.
THAT NONSENSE about “plants start to die”
is just that ……NONSENSE.
We have hit 180ppm and WE ARE STILL HERE !
.
WE are NOT heading toward TOO LITTLE CO2…we ARE heading in the opposite direction.
Google: AIP history of global warming
There has been extensive Study on all of the issues you raise…over the last 220 years….ALL ARE ERRONEOUS
Lets stick to one issue at a time.
“6) Temperature predictions made by the global climate models are wrong and getting worse with every passing year.
.
* ALL of the temperature readings have FALLEN well within the projections of IPCC for decades !”
https://wattsupwiththat.files.wordpress.com/2015/05/michaels-102-ipcc-models-vs-reality.jpg
IPCC Predictions: Then Versus Now | Climate Central
http://www.climatecentral.org/news/ipcc-predictions-then-versus-now-15340
Dec 11, 2012 – IPCC emission scenarios underestimated global CO2 emission rates, which means temperature rates were underestimated too.
*****
http://davidappell.blogspot.co.uk/2017/01/how-are-climate-models-doing-with.html
****
The most accurate temperature record is satellite based.
Your reference is based upon HADCRUT4 “a blend of near surface air temperatures and sea surface temperatures over the oceans.” The sea surface temperatures were determined by dropping a bucket over the side of the ship and measuring the temp using a thermometer. The dataset has huge areas where there are no readings so temperatures from a thousand miles away are used. The raw data is massaged over and over and homogenized and then someone lost the original data and no one can verify the adjustments.
The graph that I referenced compares the IPCC computer model estimates of temperature with the satellite temperature record. It shows that the computer model are much too hot and getting more inaccurate every year.
97% of the computer models agree that the temperature observations are wrong. Alarmists keep the computer models and throw out the data. Scientists keep the data and throw out the models.
“….At present there are three principal groups that
operationally derive global surface temperature from
this piecemeal historical record. These include the
National Oceanic and Atmospheric Administration
(NOAA) National Climatic Data Center (NCDC),
the National Aeronautics and Space Administration
(NASA) Goddard Institute for Space Studies (GISS;
Hansen et al. 2010), and the joint venture by the Met
Office Hadley Centre and the Climatic Research Unit
(HadCRUT; Brohan et al. 2006).
(Note that the Japan Meteorological Agency now has a global dataset, and land-only products are available from other groups, such as the Berkeley Earth Surface Temperature project.) In general, each group uses somewhat different input data and substantially different approaches.
For instance, GISS makes extensive use of satellite
data,
NCDC only uses satellite data in a limited
capacity, and
HadCRUT uses no satellite data at all.
Likewise, GISS and NCDC provide temperature estimates over unsampled areas whereas HadCRUT does
not.
Despite these underlying differences, however, the groups produce roughly comparable estimates of the long-term trend…”
https://www.ncdc.noaa.gov/sites/default/files/attachments/2012.bams_.vose_.mlost_.pdf
****
http://berkeleyearth.org/wp-content/uploads/2015/03/land-and-ocean-sea-ice-comparison-large.png
“97% of the computer models agree that the temperature observations are wrong”
Even for you,
that is a remarkably ignorant comment !
ALL MODELS use temperature OBSERVATIONS
(( millions of them)) upon which projections
(forecast & hindcast)) are based.
Satellite DATA is largely in line with Model Projections….now that Dr. John Christy and Dr. Roy Spencer have been forced to ADMIT REPEATED ERRORS……which went undetected since they agreed WITH THE IDEOLOGY of the Dr.s in charge…
Indeed, these 2 PREDICTED in the late 90’s to rousing applause of HEARTLAND INSTITUTE always Skeptical and frequently DENIAL….that Global Warming would End around 2000
as the EARTH would fall back into its natural slide into the next glaciation….which started 8000 years ago with the Holocene Optimum.
That prediction didn’t work out for them very well at all….
Since 17 of the 18 HOTTEST YEARS in recorded history
have occurred since THAT 2000.
Similarly,
those two sent out thousands of PRESS Releases
announcing a GLOBAL WARMING ” PAUSE ”
and later, thousands more…
.
announcing a GLOBAL WARMING ” HIATUS ”
and
then a GLOBAL COOLING
and now they have spent
much of the last 2 years
EATING CROW and
ADJUSTING FORMULAIC ERRORS in their satellite
readings…and ERRORS in Satellite Drift Corrections.
http://berkeleyearth.org/wp-content/uploads/2015/03/land-and-ocean-sea-ice-comparison-large.png
stephen – a few corrections:
1. Increasing mean global temperature can be nothing more than a longer summer caused by the Milankovich Cycles. Meaning that this doesn’t represent any increasing temperatures but that it simply has more warm days.
2. Thermometer records started in 1724 or so when Fahrenheit established a real scale. That would put temperature measurement records at about 300 years. But it took perhaps 60 or so years to become widely enough used for useable temperature records. But you can also use things like coral reef growth and geological records as well as tree ring records to give you several thousands of pretty accurate temperature records.
3. CO2 simply does NOT account for much energy absorption. On a worldwide scale water in the atmosphere in its three phases accounts for 4% of the atmosphere. This is 100 times more than CO2. More importantly, CO2 generation is almost ALWAYS around water sources such as rivers and oceans. This means that these CO2 sources are areas with far greater humidity. CO2 as three major absorption lines and two of them are blanked out completely with H2O in the atmosphere while the third is at a point in the spectrum where there is very little energy. After you get about 250 ppm or so you have near total absorption of the available energy. My estimate was that total absorption of ALL of the lines of low IR occurred within a foot or two of the ground though another study I read estimated 10 feet. This is important because once absorbed by gases the heat transfers from near the surface to the stratosphere via conduction and convection. And most gases are nearly identical. CO2 has slightly less heat capacity so it tends to conduct heat faster so it is in fact a coolant in this phase.
4. I’m not sure what you meant here but adding CO2 makes the change from radiation to conduction occur more rapidly.
5. I believe the middle 20th century pause started in 1940.
6. Strangely enough we are seeing back-peddling where they will CHANGE the model and then claim that it is accurate. This stuff has been published so how they believe they can get away with this is puzzling. But even with the changes to the models they won’t even work accurately trying to predict past temperatures.
7. There are NO accurate records of sea level rises. Antarctic and Greenland land ice is actually increasing. There is significant reduction of Arctic Ocean ice but we only have accurate records of that for some 40 years. We do know that the nuclear submarine USS Skate surfaced at the North Pole in open water in 1959 and the following year so did the USS Nautilus. In 1660 a Portuguese Captain sailed his ship from Japan to Portugal through the Northwest Passage. Navigation in those days was minimal so he had to have taken a pretty straight route through the Arctic Ocean meaning that there had to be a lot of open water at that time.
8. You are square on here. The increased CO2 has caused a world wide increase in agricultural produce. The large amount of plant life on the planet is plankton. This has increased to the point where sea life is growing at huge rates. Krill feed on plankton and filter feeders on krill. There is now more Blue Whales in just the Pacific coastal pods than were previously thought to exist in the entire world. Humpbacks and Grey Whales along the Pacific coast are in huge numbers. Even 40 years ago it was a novelty to see whales. Now they’re so common that Whale Sightseeing trips are an established business.
What is happening is that the more knowledge we get the more this “climate change” looks like nothing more than the normal cyclic weather variations we have via direct information. I have noted on several occasions that you cannot use ice cores to accurately demonstrate past CO2 levels because 1. CO2 moves though water/ice rather freely and 2. The Antarctic continent is the driest desert in the world. Ice there is formed by the slow accumulation of frost over centuries. Slowly packing the frost down by sheer weight. Plant Stomata research shows another story altogether – CO2 is a great deal more volatile with rather large and rapid changes. http://www.geocraft.com/WVFossils/stomata.html
Noting that disinformation professional Steve Goreham has no climate science credentials whatsoever. Hasn’t published a single peer-reviewed journal article.Nothing.
Gorebull Warming is not science, it is a PR campaign. As such the alarmists are never willing to debate the science, they just wage smear campaigns against anyone that they disagree with.
This is the tactic of the totalitarian Left across most issues. The Left is completely bankrupt in terms of ideas and all they can do is call people names.
“they just wage smear campaigns against anyone that they disagree with”
>> Instead of repeating the silly talking points of disinformation professionals why not educate yourself about the science, evidence and implications of climate change:
https://climate.nasa.gov/evidence/
Then come back and tell us what you have learned.
Gorebull Warming is not science, it is a Public Relations campaign to justify looting the government and the poor for crony capitalists who profit from unreliables.
Rupert Darwall has written an excellent history of the Green movement “Green Tyranny: Exposing the Totalitarian Roots of the Climate Industrial Complex”.
https://www.amazon.com/Green-Tyranny-Exposing-Totalitarian-Industrial/dp/1594039356/
It traces Green history from the Nazis to Sweden (first climate change conference in Stockholm) to the New Left takeover of Germany in the 70′ and 80’s and their alliance with the Greens to the
IPCC to the American Foundations and Silicon Valley billionaires.
Rupert Darwall is not a scientist. He is a wonderfully lucid historian of intellectual and political movements, who explains what has been inflicted on us over the past 30 years or so in the name of saving the planet.
Great interview of Darwall at
https://www.youtube.com/watch?v=nnXatjSeWWE&feature=youtu.be
Ideologue Rupert Darwall who has no scientific background whatsoever. Hasn’t published a single scientific journal article. Nothing.
You said -“Rupert Darwall who has no scientific background”
I said – “Rupert Darwall has written an excellent history of the Green movement” and “Rupert Darwall is not a scientist. He is a wonderfully lucid historian of intellectual and political movements”
Since the Green Movement is anti science, real scientists are often baffled when they try to deal with it. A historian of intellectual and political movements on the other hand can shine a very bright light upon the Greens.
Ah, yes. “Mike’s Nature trick”. Time to revive those emails.
Climategate…the gift that gives on giving!
“In February 2010, the Pennsylvania State University released an Inquiry Report that investigated any ‘Climategate’ emails involving Dr Michael Mann, a Professor of Penn State’s Department of Meteorology. They found that “there exists no credible evidence that Dr. Mann had or has ever engaged in, or participated in, directly or indirectly, any actions with an intent to suppress or to falsify data”. On “Mike’s Nature trick”, they concluded “The so-called “trick”1 was nothing more than a statistical method used to bring two or more different kinds of data sets together in a legitimate fashion by a technique that has been reviewed by a broad array of peers in the field.”
Remember what article has started this discussion – if Dr. Mann had no intentions of deceiving and was using a statistical trick to combine data sets he would not risk contempt of court to hide his data.
One of the worst sites possible is Skeptical Science which has forgiven the worst actions people pushing global warming while wildly attacking those who catch them in the act.
Sorry. Burning at the stake is prohibited under climate change legislation.
But it’s OK for theologian Al and thespian Leo to burn ginormous quantities of fossil fuels touring the world to tell us little people how BAD we are and how we must mend our ways.
The stench of establishment hypocrisy is nauseating.
“What the science says…
Since the hockey stick paper in 1998, there have been a number of proxy studies analysing a variety of different sources including corals, stalagmites, tree rings, boreholes and ice cores. They all confirm the original hockey stick conclusion: the 20th century is the warmest in the last 1000 years and that warming was most dramatic after 1920.”
https://www.skepticalscience.com/broken-hockey-stick.htm
The “warmest in the last 1,000 years” means little since we have warmer periods than present every 1,000 years. The one’s we have documentation of are the Mycenaean, the Roman and the Medieval. Not only did our present start right on schedule but it was LONG before man had the population or capacity to effect anything.
“While the Medieval Warm Period saw unusually warm temperatures in some regions, globally the planet was cooler than current conditions.”
https://www.skepticalscience.com/medieval-warm-period.htm
HAHAHAHAHAHAHA.
Literally hundreds of peer-reviewed papers & thousands of contemporary documents expose this as YET ANOTHER lie, tosser.
“Literally hundreds”
Cite two.
Read Prof. Ian Plimer’s great book: Heaven and Earth global warming: the missing science,
There are 2,200 + refs to peer-reviewed papers etc. Take your pick.
Apart from those papers, we have written histories from Greek & Roman times, respectively cool & warm periods. Before the Medieval Warm Period
During the Medieval Warm Period, we have King William the Conqueror’s DOMESDAY BOOK which recorded grapes growing as far north as Hadrian’s wall, which present day warmth does not permit. In addition there are literally thousands of ships’ logs, estates’ tax records, the Popes’ records to verify, along with global histories that the Medieval Warm Period was global & warmer than now.
Likewise, the Little Ice Age, colder than now & global.
MWP ~1000AD to 1400AD. LIA ~ 1400AD to 1850AD.
And little fat fraud Mikey Mann tried to wipe out recorded history. HAHAHA
And the dumb as dogsh1te IPCC went for it gangbusters. HAHAHAHAHA
This is all well covered in the first, history, chapter of Plimer’s book .
What are you & Mikey Mann?
Some kind of Stalinists you want to wipe out history & facts?
A second-hand reference to a list of references in a book is not an answer to my question. I asked you to cite two of the references, so we can check whether your claim that they are peer-reviewed and refute
You also appear to be confused by the distinction between local and global and about what global average temperature is.
Mann never “tried to wipe out recorded history,” nor are the scientists whose work was used for the IPCC reports “dumb as dogshite”
As for Plimer, he is somewhat lacking in credibility.
https://en.wikipedia.org/wiki/Ian_Plimer
https://www.theguardian.com/environment/georgemonbiot/2009/dec/16/ian-plimer-versus-george-monbiot
Plimer’s Heaven and Earth: ‘History’ chapter = 366 refs; ‘Sun’ chapter = 293 refs; ‘Earth’ chapter = 484 refs; ‘Ice’ chapter = 320 refs; ‘Water’ chapter = = 384 refs; ‘Air’ chapter = 297 refs.
Total refs in book, 2311. Pick any 2 from hundreds, moron.
You can stick with the easy-to-read narrative, or you can dive as deep into the science as your moron brain can master. :)
“97% of climate experts agree humans are causing global warming.”
https://www.skepticalscience.com/global-warming-scientific-consensus.htm
That 97% consensus turned out to be 75 people, yet another lie.
Go to http://www.wattsupwiththat.com & put 97% consensus in search box.
Many articles. I like UN IPCC lead author Richard Tol’s.
You should be ashamed of yourself promulgating such a well-debunked lie from skeptical, the site that posts ONLY lies.
“Abstract
Although preliminary estimates from published literature and expert surveys suggest striking agreement among climate scientists on the tenets of anthropogenic climate change (ACC), the American public expresses substantial doubt about both the anthropogenic cause and the level of scientific agreement underpinning ACC. A broad analysis of the climate scientist community itself, the distribution of credibility of dissenting researchers relative to agreeing researchers, and the level of agreement among top climate experts has not been conducted and would inform future ACC discussions. Here, we use an extensive dataset of 1,372 climate researchers and their publication and citation data to show that (i) 97–98% of the climate researchers most actively publishing in the field surveyed here support the tenets of ACC outlined by the Intergovernmental Panel on Climate Change, and (ii) the relative climate expertise and scientific prominence of the researchers unconvinced of ACC are substantially below that of the convinced researchers.”
http://www.pnas.org/content/107/27/12107.abstract
Anyone who “believes” in CAGW, Catastrophic Anthropogenic Global Warming is a moron who hasn’t done the research.
Anyone who publicly preaches the crap is a moron squared, or a paid moron, or a Troll. A peer-reviewed paper:
http://www.wattsupwiththat.com/?s=Trolls
” Anyone who publicly preaches the crap is a moron squared, or a paid moron, or a Troll”
Someone obviously threw your dummy out of your pram!
Peer reviewed paper. L.O.L..
I follow the science.
97% of scientists.
36 separate studies, peer reviewed and published….all verify the MANN Hockey Stick.
http://www.realclimate.org/images//Marcott.png
Peers?!! Hahaha….a bunch of hockey pucks living on government grants. What do you expect their findings to be when their funding depended on reinforcing Obama’s anti-science fraud(s) global warming and climate change. Government funding for such clap trap has been cut or halted altogether by President Trump. We’re going back to funding real science. The kind of science that produced the greatest scientific and technological advances the world had ever seen.
ALL CRAP.
At least 36 peer reviewed, published and replicated studies support that HOCKEY STICK you so willingly critique….not knowing for an instant how foolish you sound.
LOOK:
Years later, based on other data
http://www.realclimate.org/images//Marcott.png
The clean air acts introduced in Europe and North America reduced emissions of sulphate aerosols. As levels fell in the atmosphere, their cooling effect was soon outweighed by the warming effect of the steadily rising levels of greenhouse gases. The mid-century cooling can be seen in this NASA/GISS animation, which shows temperature variation from the annual mean for the period from 1880 through 2006. The warmest temperatures are in red.
Climate models that take into account only natural factors, such as solar activity and volcanic eruptions, do not reproduce 20th century temperatures very well. If, however, the models include human emissions, including greenhouse gases and aerosols, they accurately reproduce the 1940 to 1970 dip in temperatures.
How aerosols will influence the climate over the coming century isunclear. While aerosol emissions have fallen in Europe and the US (and in the former Soviet Union after 1991), they are now rising rapidly in China and India.
The clean air acts introduced in Europe and North America reduced emissions of sulphate aerosols. As levels fell in the atmosphere, their cooling effect was soon outweighed by the warming effect of the steadily rising levels of greenhouse gases. The mid-century cooling can be seen in this NASA/GISS animation, which shows temperature variation from the annual mean for the period from 1880 through 2006. The warmest temperatures are in red.
Climate models that take into account only natural factors, such as solar activity and volcanic eruptions, do not reproduce 20th century temperatures very well. If, however, the models include human emissions, including greenhouse gases and aerosols, they accurately reproduce the 1940 to 1970 dip in temperatures.
How aerosols will influence the climate over the coming century is unclear. While aerosol emissions have fallen in Europe and the US (and in the former Soviet Union after 1991), they are now rising rapidly in China and India.
Taken from the NEW SCIENTIST in 2007 by Catherine Brahic.
REPEAT YOUSELF MUCH????
Aeorsol pollution is under attack in China & India.
..
something about seeing bodies floating down a river has a way of concentrating one’s attention on the CAUSE
….
this is one primary reason
(along with riots)
that the Governments are spending FAR MORE MONEY on SOLAR and WIND Energy production.
…but then,
CHINA and INDIA do not have a privileged CLASS of ENERGY MONOPOLY BILLIONAIRES spending hundreds of millions of dollars fighting .
.. what is commonly understood all around the world.
…. Killer COAL Electric Generation is damaging the health of the citizenry and the climate.
“….Are Aerosols Still Bad for the Ozone Layer? – Scientific …
https://www.scientificamerican.com/article/are-aerosols-still-bad/
“If so, what is now used as a propellant? Are aerosols still bad for the ozone layer? … All consumer and most other aerosol products made or sold in the U.S. now use propellants—such as hydrocarbons and compressed gases like nitrous oxide—that do not deplete the ozone layer.”
****
**
“Climate Change: Vital Signs of the Planet: Just 5 questions: Aerosols
https://climate.nasa.gov/news/215/just-5-questions-aerosols/
“Dec 7, 2009 – The word “aerosol” is used by scientists to mean “atmospheric particulate”. But it was used a lot by the media during the 1980s and 1990s to refer to the spray cans that released chlorofluorocarbons (CFCs) into the air, which damage the ozone layer and created the ozone hole.”
***
**
“Aerosols: Tiny Particles, Big Impact : Feature Articles
https://earthobservatory.nasa.gov/Features/Aerosols/page4.php
“On a global scale,
these aerosol “indirect effects” typically work in opposition to greenhouse gases and cause cooling. While greenhouse gases disperse widely and have a fairly consistent impact from region to region, aerosol effects are less consistent, partly because of how the particles affect clouds. Most elementary …”
Do you also believe in Santa Clause and the Easter Bunny?
Is that you, dear sweet prometheus11, submissively urinating?
How the Philippines’ Mount Pinatubo Volcano Hid the Acceleration of Sea Level Rise
By John UptonAugust 12 2016 12:00 AM EDTClimate Central
Study: Sea Level Rise Accelerating
Meteorologist Danielle Banks discusses a new Climate Central report that claims sea level rise is occurring much faster that originally thought.
Mount Pinatubo put tens of millions of tons of Sulphur Dioxide into the stratosphere in 1991 Here’s what scientists at NASA had to say about that in 1992.
NASA and Japan launched satellite missions to measure sea levels. Pouring over the data from the satellites could lead to the conclusion that global warming is causing seas to rise at a slightly slowing rate of a little more an inch every decade. (But then they state below that they expect seas to rise two feet in the next 100 years instead of the 1inch every decade they stated earlier)
Modeling-based research published Wednesday in Scientific Reports showed the problem of rising seas is far more pressing than that, with sea level rise caused by greenhouse gas pollution continuing to accelerate.
“Pinatubo decreased the apparent starting point of sea level,” said John Fasullo, a climate scientist with the National Center for Atmospheric Research and the University of Colorado who led the new study.
Warm waters expand, which is a major cause of sea-level rise, and the researchers concluded that sea levels would have been about a quarter of an inch higher in 1992 had the volcano not erupted one year prior.
In addition to revealing a fascinating effect of one of the most powerful volcanic eruptions in recent history, the findings are a reminder that worsening climate-changing pollution will continue to take a heavier toll on coastal neighborhoods and roads and other infrastructure.
Even the best-case scenarios published by scientists in recent years suggest seas will rise 1 to 2 feet this century, though 4 feet or even more is possible, which would cripple many coastal regions.
“This continued rise is exactly what you’d expect as the greenhouse gas concentration keeps on rising,” Slangen said.
The findings generally confirmed those from previous research, which has used longer-running tide gauges and other sources of data to show that seas are rising at an accelerating clip because of industrial activities.
“When you talk about sea level, there are many factors associated with it,” said Rutgers University professor Ben Horton, who wasn’t involvedwith the research. “The effect of Pinatubo has been quite long lasting.”
The research helped to precisely quantify how the eruption masked an acceleration in sea level rise that has been caused by fossil fuel burning, deforestation and farming during the two decades since satellite measurements began.
“The first decade of the satellite record shows a larger rate of change than the second decade,” said Aimée Slangen, a sea level change scientist at Utrecht University who was not involved with the new study.
“If you keep in mind that the rate in the first decade is larger than itwould have been in the absence of Pinatubo,” Slangen said, “what this (study) means, really, is that there has not been a slowing of sea level rise in the second decade.”
*Sea levels rise and fall over the long arc of time. The Laurentide Ice Sheet on North America had mostly retreated from North America by 6,000 years ago leaving behind only the alpine ice sheets.
As these large ice sheets and their albedo potential was removed, the rate of absorbance of incoming solar radiation was likely to have contributed to further warming and increased temperatures of seawater. Thus, geoscientists are increasingly confident in the two primary factors that have contributed to the sea level rise rate prior to human influences. The primary cause is thought to be tied to thermal expansion of seawater. The second is the role of melting glaciers and increased volumes of land-ice being moved to the oceans. We can debate relative roles of each factor, but the outcome regardless was higher sea levels.
*From Penn State Case Study: 11,000 Years of Sea Level Change.
Major ice ages occur every 18000 years. Over the next 2000 years we will enter the next major ice age.
Q. Since the seas have risen 120 meters since the last ice age, will the seas begin to fall as we enter the next major ice age?
Climate, temperature, sea levels, seasons, atmospheric conditions, etc. all change with Earth’s cycles. The 18000 year cycle, 26000 year wobble cycle, or the 60,000 year K2 cycle, which is determined by the position of our solar system in our Galaxy.
Q. Would you agree that position or tilt of the Earth in relation to the Sun, during the Perihelion and Aphelion, is causal?
& what conclusion(s) are YOU drawing from this dissertation ?
***************
*******
***
SKEPTICS / DENIERS Predictions are REMARKABLY WRONG, again!
“….Jon Austin October 9, 2015
“…One of the world’s leading climate change experts claims to have discovered ‘ mathematical ‘ anomalies which effectively ‘ DISPROVE ’ global warming.
.
Dr David Evans, a former climate modeler for the Government’s Australian Greenhouse Office, says global warming predictions have been vastly exaggerated in error.
The academic, from Perth, Australia, who has passed ‘ six degrees ‘ in applied mathematics, has analysed complex mathematical assumptions widely used to predict climate change
and
HE is predicting world temperature will ‘ stagnate ‘ until 2017 before cooling, with a ‘mini ice age’ by 2030.
1.
Dr. Evans is not a climatologist
but rather a
2.
PHD in Electrical Engineering, with a Math undergraduate degree.
3.
He has no training in climatology.
4.
He has DONE no research in climatology.
(( THIS PRECISE Prediction was made in the 70’s by SKEPTIC Scientists & DENIERS ))
.
(( THIS PRECISE Prediction was made in the 90’s by
SKEPTIC Scientists & DENIERS Dr.s CHRISTY & SPENCER ))
Now here it is again…..IN 2015 temperatures are supposed to stagnate and then decline. (?)
1.
2014 was EARTH’S Warmest year in recorded history…
until
2.
2015 was EARTH’S Warmest year in recorded history…
until
3.
2016 was EARTH’S Warmest year in recorded history…
and
4.
2017 is right behind 2016 in record RISING temperatures…
*******
“….TEMPERATURES UP! ”
((This trend is far more apparent, the farther North or South you go.
Alaska, Canada, Russian Siberia…all HAVE ALREADY WARMED for decades at TWICE the world atmospheric temperature increase.))
*******
“There’s a heat wave in Australia and it’s killing …
http://www.cnn.com/2018/01/10/weather/flying-foxes-heat-wave-australia-trnd
Jan 10, 2018 · While the US begins to recover from record low temperatures, Australia is facing a deadly heat wave that is killing thousands of large bats, called flying …”
****
“Insane Heat Wave in Alaska Put Temperatures Higher Than in …
https://www.ecowatch.com/insane-heat-wave-in-alaska-put…
Insane Heat Wave in Alaska Put Temperatures Higher Than in Arizona … Insane heat in Alaska–90 deg temps near Fairbanks, … As we close out 2017,***
“
Well, let’s be a little careful there. I am quite sure that Dr. Mann STARTED his paper in good faith. But it was so dramatically incorrect that he face professional suicide without some sort of excuses and that’s what he did – he simply screwed with the data until it appeared the way he wanted it to appear.
Amen. True true
READING RIGHT WING OPINION PIECES in SUSPECT MEDIA… like DAILY CALLER, BREITBART, New AMERICAN is not research.
It actually is akin to wallowing in hog slop.
Your errant assumption that I follow ANY politically motivated media is as errant as your politically motivated position on CAGW. But, please, feel free to oink your disagreement.
Exactly right.
Deformation of character is politics not science.
And when he says, in a witless misrepresentation of what he replies to, (so politics again there of course, NOT science) “I would also like to see Tim Balls data that includes the Medieval Warming and the Little Ice Age data”….. he utterly denies/ignores the (above again stated) fact that Balls data for his graph WAS published.
The Deniers of science are the ‘Giaists’. And as it follows logically…. well yes of course, they would be wouldn’t they!
Insane Heat Wave in Alaska Put Temperatures Higher Than in …
https://www.ecowatch.com/insane-heat-wave-in-alaska-put…
Insane Heat Wave in Alaska Put Temperatures Higher Than in Arizona … Insane heat in Alaska–90 deg temps near Fairbanks, … As we close out 2017,
Ian is so uneducated, uninformed and ignorant that he’ll believe anything these global warming, carbon emission and climate change scientist have to say even if the skies falling tomorrow! When did you graduate high school? How old are you?
“Did you know that if you do not agree with climate change, carbon emissions or global warming you will not be funded as a scientist anymore?”
>> Silly rubbish talking point of the misinformation industry.
How old are you? When did you graduate from high school?
You are uneducated, uninformed and ignorant. It is not misinformation in the industry my friend facts are facts and fiction is fiction. About 10 years ago I studied and researched for eight months global warming, climate change and carbon emissions. I found 75 different scientists and reasons why the Al gore philosophy is a complete hoax and BS. But if I go to try and find those 75 reasons today they’ve been eliminated from the Internet because they were true and factual. If you want to get taxed and lose all your wealth just because you think that there is global warming, carbon emissions and climate change then you should do that but if I don’t believe it and there’s facts that support what I believe then I shouldn’t have to pay for the bullshit.
Being called a moron is not name-calling it is a fact. If I wanted to name call you I would say something totally different but being called a moron is factual.
How old are you? When did you graduate from high school?
What constitutes “climate science credentials” that are important to this discussion — a weatherman or a solar scientist? The question is NOT if there is global warming, the question is: “does the burning of fossil fuels (by man) that release CO2 to the atmosphere cause significant additional global warming?” The start of this discussion was simply asking for Michael Mann’s data and how this data was used to support his conclusions (hockey stick). All basic requirements of science are to use the scientific method, which includes a given hypothesis, data, and analysis of the data to verify if it supports or does not support that hypothesis. Experiments need to be designed to test hypotheses. If one piece of data is contrary to the hypothesis, then that hypothesis is wrong and needs to be refined and start over. Nearly all valid data (including data by NOAA and NASA) disprove the >100 models that are being used to drive policy!
Therefore, it is entirely acceptable for any person who studies science to request the data generated by other scientists so that we can understand how it was generated and how those scientists decided that it supports the original hypothesis — manmade CO2 causes significant global warming. It should not matter if it is Michael Mann’s data or Tim Balls data; all should be made available to the general public, particularly if that data is being used to drive huge tax-payer’s outlay (admitted to be in the $T’s and as high as $100T this century!).
He has credentials enough to call out corruption. We all do.
“…I would also like to see Tim Balls data that includes the Medieval Warming and the Little Ice Age data”…”
This statements makes you seem incredibly ignorant.
The historical data for the MWP and LittleIceAge are everywhere to be found; and Prof Ball presented this to the court. He doesn’t claim (as Mann does) that it’s his own research, but he rightly points out that the science of weather and climate has multiple examples proving that these climatic periods existed, including historical records, artworks, geological data, tree-ring evidence, and ice-core data (from Greenland, Siberia and Antarctica).
The deliberate alterations (by NASA, NOAA, Mann & Co, etc) of the historical climate records is an open fact; and can be researched, as Tony Heller did:
Learn some science. It will open your eyes… and make life much more interesting
You can’t be serious. Tony Heller (also calls himself Steven Goddard) is a well known disinformation professional and has no climate science credentials whatsoever. Hasn’t published a single scientific article on climate science. Absolutely nothing. Why do you invest your trust in such an unqualified person?
“…Why do you invest your trust in such an unqualified person?…”
..because I’ve seen the evidence from the “qualified” Michael Mann; and his Hockey Stick obliterates real, recorded weather events from the record; and the “unqualified” Mr Heller has seen through the multiple, criminal fraud of Mann, NOAA, NASA and the IPCC.
Perhaps if you actually looked at the evidence, YOU might start doubting the truthfulness of the absurd claims or the Warmists – that’s assuming, of course, that you’d understand what you were looking at – not a guaranteed thing, from what I’ve seen of your attitude.
Perhaps you’ve not noticed that there’s been no temperature increase since around 1997?
While you’re studying this, you’ll notice that NOAA’s Mr Karl has fiddled the books, so to speak; and that both NOAA and NASA have cunningly changed history, by slowly altering the past measurements to create the illusion of warming, to fit their fraudulent narrative.
As for Tony Heller’s being a “well-known disinformation professional”, I suggest that you look honestly (if that’s possible) at his career and what he’s achieved in the world of mission-critical engineering.
He’s eminently qualified to study data for signs of accuracy, honesty or otherwise.
Then watch Freeman Dyson’s comments on the scam…
http://www.breitbart.com/big-government/2017/08/22/delingpole-global-warming-is-almost-entirely-natural-study-confirms/
Ian: But Mann has all the credentials, right? When he and the warmistas entered the realm of public policy they put themselves n the public arena. If it is too hot in the kitchen…
Little ice age data? they were ice skating on the Thames 1800’s
Apparently you are not familiar with the “peer-review” process Mann incorporated. Pal-review would be a more appropriate term.
A silly, unsubstantiated claim that favours your weak, narrow ideology over scientific enquiry.
There is NO SUCH THING as “climate credentials”. There is no such study. These “climate scientists” are all self identified. Climate science isn’t chemistry, astronomy, geophysics, geology, physics and so on and so forth but ALL of them. No one scientist can know much about it save by using data documented by NASA and NOAA who have already been caught with their pants down counterfeiting data.
“…using data documented by NASA and NOAA who have already been caught with their pants down counterfeiting data”
>> Complete rubbish. You can’t substantiate your outrageous statement
“Climate science isn’t chemistry, astronomy, geophysics, geology, physics and so on and so forth but ALL of them.”
>> Climate science is typically considered a branch of atmospheric sciences and a field of physical geography, which is one of the Earth sciences. It draws upon the science, evidence and expertise from multiple disciplines. The scientific evidence for warming of the planet’s climate system is unequivocal.
https://realclimatescience.com/all-temperature-adjustments-monotonically-increase/
This shows the change that NASA made to their RAW datasets. There is nothing worse than changing raw data.
I don’t know where you get the idea that “climate science” is some sort of specialty. Tell us all – what universities offer and PhD program in “climate science”?
Providing a link to Tony Heller’s (aka Steve Goddard) silly disinformation blog substantiates nothing.
Climatologists work in multiple disciplines including mathematics, atmospheric physics, meteorology, oceanography, physical chemistry, biology and ecology.
https://thsresearch.files.wordpress.com/2017/05/ef-gast-data-research-report-062717.pdf
Of course you’re free to disagree with the findings of statisticians and I’m sure you will. You are also free to disagree with seven other PhDs most of whom worked for the EPA. That’s what True Believers in the Church of Man-made Global Warming do.
By the way – what are your credentials? As for mine I’ve worked in science since I got back from Vietnam. My first job was at Physics International working in extreme high energy nuclear physics. I worked on the base station for the first west coast Internet. IBM’s supercomputer at this time could handle 3 simultaneous users, ours 100.. I could go on but the point is – where have you gotten any knowledge at all?
Tim Ball really has BALLS to make some of the comments he has made.
What credentials do you have? You yourself have NO ability to tell good and bad data. At the very least Steyn has an education at a private British school founded in the mid-1500’s showing that they do a damn good job of education. You do not even seem capable of knowing what Contempt of Court is in regards to Dr. Michael Mann.
Oh I see, someone attends a British grammar school and that somehow makes them qualified to make silly unsubstantiated comments that contradict the position of virtually every international and US scientific academy. And no, contrary to John O’Sullivan’s ridiculous allegations, Mann is not, nor has he ever been in contempt of court. Why do you continue to try to intentionally mislead readers?
I bet you reference the cartoonist who runs Skeptical Science
Would you mind telling us what credentials YOU have to judge anything including a dog and pony show? This is a serious matter – morons of your ilk seem to have no problems discrediting people who study subjects. I do not have a college education and yet have did the entire digital design and programming of a automation of a chemistry in which the chief chemist won a Nobel Prize. I also did the digital design and programming for a product that won the project leader an Emmy Award. If you go to a hospital with a heart attack you are very likely to be monitored by detectors I designed and programmed. I designed and programmed the communications boards for the original three section international space station. I worked at LBL and LLL.
So by all means tell us anything you have ever done of value besides moving out of your parent’s basement at 29 years old.
I made 2 factual statements:
* Mark Steyn has absolutely no climate science credentials whatsoever
* Dr. Ball hasn’t published any peer-reviewed climate science in over 25 years.
Your silly name-calling doesn’t change the above facts.
Wow, an Emmy Award…so important and powerful!
You have made more than a few factual errors.
1. Mark Steyn has a degree from King Edwards School and a very fine education it is. He has written at least 5 books and every one of them described the world the way it was and it is among one of the reasons that Donald Trump ran for office and won with an overwhelming majority of electoral votes. He wrote a book on climate change that has totally accurate descriptions including the real scientists who have proven you and your stupid, uneducated and hypocritical ilk not just incorrect but wrong about your entire lives.
2. Dr. Patrick Ball has spent his time communicating in an almost constant string since before 2007 on the Climate hoax. 3. Dr. Michael Mann has honor upon honor bestowed upon him up to this very year. He has written three books on the dangers of climate change. Not ONE SINGLE ONE of his predictions has come true. Not even close. Not even in the same Ballpark. His election as Fellow of the AAAS prompted me to quit my membership.
And you are so uneducated you don’t know the first thing about his science and have to repeat the leftist environmental rant like a parrot. I will say that it’s even funnier that you know nothing about the Emmy Awards and talk as if you did. It sort of matches the rest of your demeanor.
“Mark Steyn has a degree from King Edwards School”
>> No you are misinformed. King Edwards is not a degree-granting institution. It’s an independent school in Birmingham that offers A-level (similar to a high school diploma) and an International Baccalaureate diploma (advanced placement into some university degree programs). It is a good school but graduating from it does not provide its students (typically aged 11 to 18) with any climate science qualifications.
“Dr. Patrick [sic] Ball has spent his time communicating in an almost constant string since before 2007…”
>> As mentioned up-thread Dr. Tim Ball hasn’t published any peer-reviewed climate science in over 25 years. Communicating unsubstantiated nonsense is not the same as communicating science.
“you…have to repeat the leftist environmental rant like a parrot”.
>> Why do you consider my statement that “Tim Ball hasn’t published any peer-reviewed climate science in over 25 years” as a leftist environmental rant? If you think the statement is incorrect, provide some evidence instead of responding with intentionally dishonest rubbish.
And yet you need only look at their graduates:
Harry Boot, physicist, co-developer of the cavity magnetron.
Richard Ewen Borcherds, mathematician; winner of the 1998 Fields Medal for the proof of the Monstrous moonshine conjecture.
George Caird, New Testament scholar; Principal of Mansfield College, Oxford; Dean Ireland’s Professor of the Exigesis of Holy Scripture at Oxford University.
Henry Cary, translator of Dante.
John Hawthorne, philosopher, Waynflete Professor of Metaphysical Philosophy at Oxford University.
Alfred Hazel, Principal of Jesus College, Oxford.
Frank Horton FRS Professor of Physics at Royal Holloway College and Vice-Chancellor of the University of London 1939-45
Alfred Edward Housman, classicist and poet. Author of A Shropshire Lad and holder of Kennedy Professorship of Latin at Cambridge University.
J. S. Mitchell, Radiotherapist and Regius Professor of Physic, University of Cambridge 1957-1975
Alfred Radcliffe-Brown, social anthropologist.
Julian Roberts, librarian and bibliographer.
Thomas A. Shippey, medievalist scholar on the works of J. R. R. Tolkien, Professor of English at the University of Leeds.
J. R. R. Tolkien, Merton Professor of English Language and Literature; author of The Lord of the Rings and The Hobbit.
Sir John Vane, 1982 Nobel Laureate in Physiology or Medicine.
Maurice Wilkins, 1962 Nobel Laureate in Physiology or Medicine.
Sir Francis Galton, Victorian polymath
You haven’t told us what credentials you have to criticize a single thing that anyone has to say about warming. We’re still waiting for your hypocrisy to spring full blown upon the surface and not simply making your ignorant statements.
1) you claimed that “”Mark Steyn has a degree from King Edwards School”. Your statement is untrue yet you failed to admit that your statement was wrong and intentionally misleading. How dishonest of you.
2) Your list of KE graduates is completely irrelevant. None is the subject of the article. Again Steyn has no scientific qualifications whatsoever.
3) My own education and scientific qualifications do not change the above facts.
Let me ask this again: What qualification do you have whatsoever? Do you know Mark Steyn personally. Exactly WHERE do you get off judging anyone with your quite plain low IQ?
“Exactly WHERE do you get off judging anyone…”
>> Stop making stuff up. I am not judging anyone, just stating facts:
* Mark Steyn has no climate science credentials whatsoever.
* Tim Ball hasn’t published any peer-reviewed climate science in over 25 years.
* King Edwards school of Birmingham is not a degree-granting institution.
I have asked you several times what credentials you had that would have given you the ability to judge what anyone has to say about AGW and you have offered nothing but backtalk – ergo you are nothing but a mindless environmentalist flunky who merely follows you leader. Since you know nothing there isn’t any reason to answer your empty accusations of people 100 times your superior.
1) “your empty accusations”
>> No not accusations, just easily verifiable facts that you haven’t refuted, namely that:
* Mark Steyn has no climate science credentials whatsoever
* Dr. Ball hasn’t published any peer-reviewed climate science in over 25 years.
* King Edwards school of Birmingham is not a degree-granting institution.
2) “I have asked you several times what credentials…”
>> More than qualified to identify intentionally misleading rubbish and call out those that pretend to debate through weak and childish name-calling.
Still waiting for you to tell us your qualifications for talking about science.
https://www.youtube.com/watch?v=ICGal_8qI8c
posts link to silly rubbish video created by conspiracy theorist, Atlantis proponent and fiction writer rod (carl) martin…who has no climate science background whatsoever. Hasn’t published a single scientific article, ever.
Since you have given us no credentials we can only assume that you could not tell what was a conspiracy and what isn’t.
You are correct and I shouldn’t call names. But you should also either tell us what credentials you have for being able to understand any of these things or tell us directly that you have no credentials and are assuming that one person is correct and another not. That is called uneducated bias.
IP belongs to the University, but there is no record of any patent or other IP being filed, so I have no idea how he can not share the data. Sharing data once published is part of the agreement that all scientists make when they get a grant.
SIR !
Dr. Michael Mann’s research has been repeatedly published in scientific journals around the world.
The reason Congressman Smith’s subpoena was tossed was because
he was shown 2 such publications.
SORRY YOU MISSED IT !
You might have known that, if you read something more substantial and truthful than Breitbart and Daily caller etc.
RICHMOND, Va. — For nearly a year, Kenneth T. Cuccinelli II, Virginia’s crusading Republican attorney general, has waged a one-man war on the theory of man-made global warming. (and against Dr. Michael Mann, noted American Scientist)
Invoking his subpoena powers, he has sought to force the University of Virginia ( and Dr. Michael Mann) to turn over the files of a prominent climatology professor, asserting that his research may be marred by fraud.
The university is battling the move in the courts.
At the same time, Mr. Cuccinelli is suing the Environmental Protection Agency over its ruling that carbon dioxide and other global warming gases pose a threat to human health and welfare, describing the science behind the agency’s decision as “unreliable, unverifiable and doctored.”
**** The UNIVERSITY WON
******Dr. Michael Mann WON
………and the tax payers of Virginia lost MILLIONS OF DOLLARS Cuccinelli jousting at wind mills, literally !
It was a very easy decision….all of the data sought has been published in Scientific Journals and peer reviewed years before….
Dr. Michael Mann’s research for his Hockey Stick Graph (a joint research project)
but for which Mann has received
1.
MUCH abuse,
2.
threats on his life and
3.
TWO court suits by the REPUBLICAN Attorney General for Virginia
(both failed miserably)
…
Michael E. Mann — Penn State Meteorology and Atmospheric Science
http://www.met.psu.edu/people/mem45
Michael E. Mann. Distinguished Professor of Atmospheric Science; Joint Appointment with the Department of Geosciences; Director, Earth System Science Center … Dr. Mann is author of more than 200 peer-reviewed and edited publications, and has published three books including Dire Predictions: Understanding Climate …
…
36 Research Papers, peer reviewed and published, support Dr. Mann.
…
http://www.realclimate.org/images//Marcott.png
Mann is about to become an extinguished professor of atmospheric studies. That’s what happens when you make your numbers up as you go along.
and you are WRONG again….look what wonderful mates these are:
“Affidavits filed in the British Columbia Supreme Court libel litigation brought by climate scientist Dr. Michael Mann
against climate science denier Timothy Ball
reveal that Ball’s collaborator and self-styled “legal advisor” has misrepresented his credentials and endured some significant legal embarrassments of his own.
The affidavits also reveal that Tim Ball was “aware of the charges against John O’Sullivan almost from the start” and has tried to distance himself from his erstwhile advisor and writing partner.
The affidavits [1, 2] come from research of science and medical writer Andrew Skolnick, who documents O’Sullivan’s misrepresentations, backtracking and questionable behavior.
Tim Ball and John O’Sullivan had a close working relationship,
even before Mann sued Ball for libel in March 2011.
For example,
they co-authored the climate science denial book
‘Slaying the Sky Dragon: Death of the Greenhouse Gas Theory’, which was published in 2010.
Skolnick’s evidence shows that O’Sullivan made a series of false claims,
including:
** that he was an attorney with more than a decade of successful litigation in New York State and Federal courts;
** that he was employed by a major Victoria, B.C. (Canada) law firm that is representing Ball in the libel action;
** that he is a widely published writer, with credits in Forbes and the National Review;
** that he had received his law degree from the University College, Cork, Ireland and/or
from the University of Surrey (O’Sullivan’s actual legal accreditation,
apparently obtained after the Mann-Ball action commenced, comes from an online degree mill,
Hill University, which promises delivery in two weeks);
that he is a member of the American Bar Association.
One affidavit includes an online comment in which O’Sullivan says,
“For your information,
I am a retired academic and I have litigated personally or assisted others in pro se litigation at every level of court there is in New York State as well as Federal level, for over a decade and never lost.”
Although O’Sullivan admits in this particular comment that
he is not, in fact, licensed to practice law, in the U.S. or the U.K.,
he adds, “I’m just some Brit with a brain who can go live with his American wife in her country and kick ass big time around a courtroom.”
Certainly,
O’Sullivan was successful in winning an acquittal when he was personally charged in England as a high school teacher accused of sending lewd text messages and assaulting a 16-year-old female.
Given the acquittal,
it would not generally be appropriate to bring up this sordid and unproven bit of history, except that O’Sullivan himself went on to write an “erotic” “novel” with a startlingly similar storyline:
Vanilla Girl: a Fact-Based Crime Story of a Teacher’s Struggle to Control His Erotic Obsession with a Schoolgirl.
Although eager to present himself as a science researcher of accomplishment – certainly Tim Ball’s equal – Skolnick’s research found that O’Sullivan is
highly prone to error,
whether intentional or not.
For example,
O’Sullivan provided bogus contact information when registering as a member* with the New York County Lawyers’ Association, an organization that apparently does not vet its members’ qualifications (and does not, in any case, bestow the right to practice law).
While O’Sullivan claimed to be with a firm named “Principia Scientific International,” he provided the address of a construction company called Second Nature Construction; the phone number and fax number didn’t belong to O’Sullivan or anyone connected to “Principia,” either….”
Gee, I guess that Mann thinking that Ball didn’t have sufficient credentials is why he refused to follow the orders of the court and turn over the data. After all with no obvious credentials Ball wouldn’t be able to make heads or tails of the data.
Now we discover that the IPCC instead of being “The worlds best scientists” turns out to be nothing more than a frat house.
https://nofrakkingconsensus.files.wordpress.com/2011/10/delinquentteenager_sample.pdf
http://notrickszone.com/2018/01/01/150-non-global-warming-graphs-from-2017-pummel-claims-of-unusual-modern-warmth/#sthash.xOMSjuoT.1BNdFdyL.dpbs
Tell me, is it painful to be as stupid as you are?
Pity you have NO references TO RELIABLE SOURCES…
Local Temps and amateur graphs DO NOT UNDERMINE
Global Warming Science and 2 centuries of Research.
models accuracy !
http://4.bp.blogspot.com/-ojp3RLdTlTY/UnKsuZniXcI/AAAAAAAAdHw/gcqmQmPZeyo/s1600/climatemodel.png
****
CO2 & Temperature Marriage:
https://www.bing.com/images/search?view=detailV2&ccid=%2f%2bt8mfVF&id=8999BA373F3B7B4F391B144E98514B474B7894CF&thid=OIP._-t8mfVFvINxHRaKkITjvAHaFT&mediaurl=http%3a%2f%2fzfacts.com%2fmetaPage%2flib%2fzFacts-CO2-Temp.gif&exph=377&expw=526&q=graph+co2+and+world+temperature+rise&simid=608046613771259242&selectedIndex=0&ajaxhist=0
***
https://en.wikipedia.org/wiki/Effects_of_global_warming#/media/File:2000_Year_Temperature_Comparison.png
and look mommy….as global warming science has projected/predicted for over 200 years
….because of human activities
(deforestations, deep cultivation farm techniques, massive production of Green House Gases)
……
TEMPERATURES ARE RISING
HEAT WAVES are more severe, covering more Square miles
Dramatic increases is FLOODING EVENTS…or seasonal increases in SNOW events.
DROUGHTS are increasing and covering more Square miles.
Tumultuous changes in weather patterns.
What human activities 200 years ago started Globull Warming??
The burning of fossil fuels:
http://www.ucsusa.org/global_warming/global_warming_101
This media outlet is funded by companies which sell fossil fuels:
http://www.desmogblog.com/committee-constructive-tomorrow
Can you figure out why that gives them a conflict of interest in writing about global warming, Charlie?
CB – the fastest growth in relative CO2 was during WW II and up to 1960 or so but during that time we had cooling. There was NO significant CO2 growth prior to 1940. What’s more, there are no accurate studies to address this.
Exactly why are you seeing comments about how Dr. David Bell hasn’t published papers recently even though he published MANY videos etc. on AGW while The Union of Concerned Scientists is made up almost of scientists that have no atmospheric training whatsoever – an AGRONOMIST???
And then what in hell do you do? You use DeSmogBlog as some sort of authority? Fact check – that is entirely journalists. Most of whom with an ax to grind and you’re using your head as a sharpening stone.
Scientists do not write papers designed to be biased unless pressured to do so. Saying that part of the funding for a paper is proof of bias is a slap in the face. What proof do you have for that remarkable statement?
https://www.hoover.org/research/flawed-climate-models
What’s more if you had ever worked in science you would know that research grants are only from two sources – the government which supplies the vast majority. And commercial business who are generally looking into future problems their products might cause or to make plans to move into different products etc. You have just publicly insulted every single scientist that ever needed funding for his experiments. Funding from sources such as charitable organizations are made almost entirely to medical research or the like.
If NASA cannot be wrong why have more than 31,000 degreed scientists signed the Oregon Petition? Over 9,000 of them are PhD’s and 3 of them Nobel Laureates. This petition DENIES man-made global warming.
Who are the “scientists” at the IPCC – Of the 2,500 who supposedly wrote the paper on global warming a large part of them are politicians and most of the “scientists” are students or young graduates.
https://tinyurl.com/yboxbeo3
https://tinyurl.com/gtn5wpl
Exactly what does it take to convince you people who know nothing that they are wrong?
Clearly you are clueless to what creates a drought. Droughts are an indication of global cooling not warming.
►Lejeune, Seneviratne & Davin 2017: None of the analyzed models are able to represent deforestation parameters.
Lejeune, Seneviratne & Davin 2017: ”We find that none of the analyzed models are able to represent both the observed warming effect of deforestation during daytime in summer and its cooling effect during nighttime and, therefore, the resulting increase in DTR. … reveals some model deficiencies that need to be investigated in more detail, …”
Lejeune, Seneviratne & Davin 2017: Historical Land-Cover Change Impacts on Climate: Comparative Assessment of LUCID and CMIP5 Multimodel Experiments AMS
The 2010 HEAT WAVE in Russia, was that projected/predicted? Nope.
“Was there a basis for anticipating the 2010 Russian heat wave?.”
Dole 2011, evaluating 22 CMIP3 model simulations: ”In summary, the analysis of the observed 1880–2009 time series shows that no statistically significant long-term change is detected in either the mean or variability of western Russia July temperatures, implying that for this region an anthropogenic climate change signal has yet to emerge above the natural background variability.”
”Our analysis points to a primarily natural cause for the Russian heat wave. This event appears to be mainly due to internal atmospheric dynamical processes that produced and maintained an intense and long-lived blocking event.”
Dole, Randall, et al. 2011 “Was there a basis for anticipating the 2010 Russian heat wave?.” Geophysical Research Letters
The supposed “accuracy” in projecting temperatures is not from the strength of the models, but tweaks, and compensating errors. All this fuss over a supposed global surface temperature graph … when models botch everything else. Precipitation, sea-ice, droughts, major oceanic cycles like ENSO, AMO, PDO …. everything else.
… and as for your attempt to flush out graphs, because they were made by what you classify as “amateur” is laughable. Find problems with the DATA, not the authorship of the graph. Oh, you can’t.
How would you know…hundreds of models…the only ones your read about are preliminary…prior to Peer Review Publications etc.
Models v. Observations
http://davidappell.blogspot.com/2017/01/how-are-climate-models-doing-with.html
https://twitter.com/ed_hawkins/status/299161479268139009
https://www.climate-lab-book.ac.uk/files/2014/01/fig-nearterm_all_UPDATE_2017-panela-1-1024×525.png
Predictions by Global Warming Science, SPOT ON ACCURACY:
1. Surface weather station measurements CLEARLY register Warming for over a century & a half!
2. Satellite measurements show that the troposphere is warming
3. The stratosphere is cooling as predicted by anthropogenic global warming theory
(this cannot be explained by solar variability)
4. Temperatures at the ocean surface and at various ocean depths show warming as far down as 3000 meters
5. Sea level rise…at an increasing rate.
6. Gravitometric measurements of Greenland and Antarctica show net ice loss
7. Sea-ice loss in the Arctic is dramatically accelerating
8. Acceleration of glaciers in Greenland and Antarctica, particularly within the last few years.
9. The rise of the tropopause
10. Poleward migration of species
11. Increased intensity of hurricanes as expected from rising sea surface temperatures
12. Accelerating decline of glaciers throughout the world
13. Rise in temperatures at greater depths in the permafrost
14. Rapid expansion of thermokarst lakes throughout parts of Siberia, Canada and Alaska
15. Changes in ocean circulation as predicted by climate models, for example, with temperatures rising more quickly overland
16. Disintegration of permafrost coastlines in the arctic
17. Changes in the altitude of the stratosphere
18. An energy imbalance – the earth is receiving more energy than it emits (Google: Hansen 2005 abstract)
19. Poleward movement of the jet streams (Archer 2008, Seidel 2007, Fu 2006)
20. Widening of the tropical belt (Seidel 2007, Fu 2006)
Note – Some of the evidence listed above are unique to CO2 warming – the carbon “fingerprint”.
.
“Overlooked by modern researchers is the work of Eunice Foote, who,
three years prior to the start of Tyndall’s laboratory research,
conducted similar experiments on absorption of radiant energy by atmospheric gases,
such as CO2 and water vapor. The presentation of her report at a major scientific convention in 1856
was accompanied by postulation that even modest increases in the concentration of CO2 would result in significant atmospheric warming.”
http://www.searchanddiscovery.com/..
►Catto, Jacob & Nicholls 2015: The models have strongly compensating errors; the frequency is too high, the intensity is too low.
►Purich 2018: CMIP5 models do not simulate Antarctica sea surface cooling, and increase in sea ice, as seen in observations.”.
►Yin & Porporato 2017 Climate models screw up the diurnal timing of important peaks in actual cloud coverage
►Williams & Bodas-Salcedo 2017: Models simulate too little cloud cover, but clouds are simulated too bright, compensating errors.
►Brisson 2016: Models have compensating errors – an overestimation of the reflectivity of clouds.
►Hu, Duan & He 2017 lament the wide gap between observations, and the model simulations.
►Rosenthal 2017: Models do not accurately mimic the dynamic, wind-driven, ocean-atmosphere heat exchange.
►Kravtsov 2017: … models are not entirely based on first principles…” Parameterizations replace physics
►Cheung 2017: CMIP5 simulated spatial pattern and amplitude of the PMO, AMO, and NMO are inconsistent with observations.
►Ying & Huang 2016: Cloud–Radiation Feedback is the leading source of uncertainty in CMIP5 models
►Yamaguchi, Feingold & Larson 2017 Clouds are poorly represented in the models, adversely affecting estimation of cloud feedbacks
►Drews & Greatbatch 2017: Even without greenhouse gas forcing, or aerosol forcing, model “cold bias” is still a problem … in 2017…
►Alexander & Arblaster 2017: Models overestimate wet days and minimum temperature extremes.
►Lejeune, Seneviratne & Davin 2017: None of the analyzed models are able to represent deforestation parameters.
►Raghavan 2017: CMIP5 models are unable to reproduce the observed state of climate over S.E. Asia.
►Henderson, Maloney, & Son 2017: The models do terribly at simulating the Madden-Julian Oscillation.
►Famien 2017: The CMIP5 models screw up the African monsoon, and underestimate the precipitation.
►von Schuckmann 2016: Models fail recent solar variability and spectral variations, and their effects on radiative forcing.
►Siqueira & Kirtman 2016 document failure of the models and their simulation of oceanic mesoscale eddies
►Suzuki 2015: Models botch precipitation, relative to satellite observations, and form “too early rain formation”
►Dieppois, Rouault & New 2015: CMIP5 models, and ENSO history, are off by a factor of two.
►Donohoe 2014: The models do not simulate the “greenhouse effect” at all… they show shortwave sunshine warms, not “trapped infrared”
►Harrison 2015: The models are unable to reproduce the magnitude of changes in regional climates.
►Moise 2015 evaluates CMIP3 & CMIP5 Models over the Australian region and singles out poor performers, individually.
►Takahashi, Su & Jiang 2015, Jiang 2012: Upper tropospheric water vapor is one of the most poorly simulated quantities in climate models.
►Evan 2013; Martin 2014; Brown 2016; Yuan 2016 describe model failures on cloud and dust feedback
►Kay 2012 document the models’ flaws, showing they have insufficient low cloud cover in subtropical subsidence regions
►Li 2004, and Masunaga & L’Ecuyer 2010: a strange tropical rain band south of the equator, present in models, that is absent in reality
►Davis 2003, Dai & Trenberth 2004; Grabovski 2006 lament over the models’ premature onset of deep convection
►L’Ecuyer & Stephens 2007; Su & Jiang 2013: models underestimate the Walker circulation response to El Niño
►Qu, Hall, Klein & Caldwell 2014: models’ sensitivity to changes in Sea Surface Temperature simulates unrealistic marine low cloud cover.
►Yu & Mechoso 1999, as well as Dai 2003 discuss the models’ too-warm SST biases in the southeast Pacific
►Kushnir 2002; Eade 2014; Stockdale 2015; Siegert 2016 describe how the models fail to simulate SST and the North Atlantic Oscillation’s response
►Hoerling, Eischeid & Perlwitz 2010: observed multi-decadal SST variations botched in the models, because they are unforced natural variations
►Schubert 2009tells us of a false SST “inter-annual variability” that the models generate, associated with the internal dynamics of the models.
►Boé 2009 as well as English 2015: most climate models do not accurately simulate the complex Arctic feedbacks
►Strove 2007 and Strove 2012: The models failed to properly simulate variations in the Arctic ice
►Wyatt & Curry, 2014: The models flunked sea-ice dynamics
►Goossea, Rocheb, Mairessea, Bergerd 2013: The models failed to simulate the observed Antarctic sea-ice anomaly
►Ditlevsen & Johnsen 2010: Models botch reproducing the rapid transitions from a glacial climate, into another, such as the present climate
►Otto-Bliesner 2013: LIG-120 mean annual surface temperature simulation by the models, mismatches proxy data for temperature
►Schubert 2004b notes that the models differ from observations, regarding the USA ‘dust-bowl’ drought, by a factor of two
►Fyfe, Gillett & Zwiers 2013 describes how the models overestimated global warming over the past 20 year
►Wyatt 2012, Wyatt & Peters 2012, and Kravtsov 2014 detected major mismatches of 20th century’s multidecadal variability in CMIP5 models
►Icon 2000 found a whopping increase in the long-wave radiation, at high latitudes, in GCMs that used improved formulations.
►Flato 2013 states that most climate models show a lot larger trends of precipitable water vapour, than the satellite observations
►Mears 2007 & Flato 2013: Clausius–Clapeyron scaling over oceans is tightly constrained in all model simulations, but not observations
►Wagner 2006 studied the extratropics, and found the water vapour from satellites, and the surface temperature, showed no correlation
►In models’ climate simulations, O’Gorman & Muller 2010 show the Clausius–Clapeyron scaling has large spatial variability.
►Tian 2013a the CMIP5 models shows a drier lower troposphere, than real observations.
►Jiang 2012 shows that the CMIP5 models have a wetter upper troposphere, than real observations
►Bony 2013 shows the response to increased greenhouse gases to be clearly sensitive to model error
►Deser, Magnusdottir, Saravanan & Phillips 2004: The circulation response to changes in radiative forcing occurs indirectly, through eddy feedbacks
►Fedorov & Philander: Modelled ENSO variability is sensitive to the chosen climatology
►Shin & Sardeshmukh 2011: observed decrease in drought severity not captured by models
►Zona 2016: dry tundra late-season emissions of methane aren’t simulated by the models.
►Mauri 2014: ”…models underestimate the role of atmospheric circulation in recent climate change…”
►Zhai 2013: The South China Sea is a large source of CO2 to the atmosphere, that is not included in the models.
►li 2014: Falling snow, and its effects on radiation interaction are not included in most CMIP5 models
►Lin 2000, Yang & Slingo 2001, Tian 2004: The models have large errors in both the phase and amplitude of the diurnal cycle
►Ditlevsen 2014: None of the analyzed models reproduce the changes in the diurnal cycle.
►Michaels 1994: Computer models of the oceanic carbon cycle cannot give a full account of carbon dynamics.
►Søgaard 2010: Bacteria living in sea-ice cause the ice to be a significant absorber of carbon dioxide, yet none of the models knew that.
►Raymond 2014: Rivers and lakes are large net sources of CO2 to the atmosphere – and that isn’t accounted for in climate models.
►Wang 2014: Carbon-cycle sensitivity for most models is stronger than observed.
►Sun 2014: CO2 fertilization is botched by models, representing an inherent model structural deficiency.
►Frölicher 2014: The CMIP5 models underestimate the global anthropogenic carbon inventory by about 15%.
►Schwinger 2014: Models don’t implement a sensitivity of biological production to increasing carbon availability.
►Friedlingstein 2014: There is no overall agreement across models on even the sign of the land carbon sink.
►Wenzel 2014: Models have a wide spread in tropical land carbon storage; this is one of the key uncertainties in climate projections.
►Anav 2013: The multimodel ensemble mean does not reproduce twentieth-century terrestrial precipitation accurately.
►Ahlström, Schurgers, & Smith 201: Simulated carbon cycle contains substantial biases in comparison to historical climate records.
►Baldocchi 2001: Real carbon uptake by tropical and temperate forests exceed modelled estimates.
►Huntingford 2017: Modelled terrestrial CO2 respiration seems to be off by some 30%.
It seems blogs are all Mr. Wake can find. I’d suggest the people who actually run the satellites are slightly more reliable than random internet clowns who pretend they’ve gotten their information from those satellites:
climate.nasa.gov/system/internal_resources/details/original/87_Q10-temp-anomaly-740px.jpg
Agreed !
TO DATE THERE HAS BEEN NO COURT IN THE US OR IN CANADA THAT HAS ORDER DATA FROM DR. MANN…nor has there been any contempt citation against Dr. Mann.
You see how stupid you become when you only read crapolla like Daily Caller and Breitbart ? ?
“As the case unfolded, the BC Supreme Court directed Mann to turn over all data relating to his graph by Feb. 20, 2017. The deadline came and went without the data being handed over by Mann.”
Mann has also been stalling with another case he has in the DC courts and yet another elsewhere.
Exactly why Mann has put himself into this position is baffling because since his research was conducted with a US government grant ALL of the data is required to be in the public domain.
Dr. Mann is finished after these cases are brought before a judge and in the case of the SLAPP suit against Dr. Ball there will probably be criminal charges as well since he was ORDERED by the Canadian Supreme Court to turn over the data.
You can invent anything you like but the facts are known.
ONCE AGAIN, you are getting your POLITICAL SPIN from RABID RIGHT opinion web sites like Breitbart, NewAmerican, Daily Caller etc….
YOUR OPINIONS and THEIR OPINIONS
ARE NOT IN LINE WITH THE FACTS !
YOU LIE!
“Affidavits filed in the British Columbia Supreme Court libel litigation brought by climate scientist Michael Mann against climate science denier Timothy Ball reveal that Ball’s collaborator and self-styled “legal advisor” has misrepresented his credentials and endured some significant legal embarrassments of his own.
“The affidavits also reveal that Tim Ball was “aware of the charges against John O’Sullivan almost from the start” and has tried to distance himself from his erstwhile advisor and writing partner.
“The affidavits [1, 2] come from research of science and medical writer Andrew Skolnick, who documents O’Sullivan’s misrepresentations, backtracking and questionable behavior.
“Tim Ball and John O’Sullivan had a close working relationship, even before Mann sued Ball for libel in March 2011. For example, they co-authored the climate science denial book Slaying the Sky Dragon: Death of the Greenhouse Gas Theory, which was published in 2010.
“Skolnick’s evidence shows that O’Sullivan made a series of false claims, including:
“that he was an attorney with more than a decade of successful litigation in New York State and Federal courts;
that he was employed by a major Victoria, B.C. (Canada) law firm that is representing Ball in the libel action;
that he is a widely published writer, with credits in Forbes and the National Review;
that he had received his law degree from the University College, Cork, Ireland and/or from the University of Surrey (O’Sullivan’s actual legal accreditation, apparently obtained after the Mann-Ball action commenced, comes from an online degree mill, Hill University, which promises delivery in two weeks);
that he is a member of the American Bar Association.
“One affidavit includes an online comment in which O’Sullivan says, “For your information, I am a retired academic and I have litigated personally or assisted others in pro se litigation at every level of court there is in New York State as well as Federal level, for over a decade and never lost.”
“Although O’Sullivan admits in this particular comment that he is not, in fact, licensed to practice law, in the U.S. or the U.K., he adds, “I’m just some Brit with a brain who can go live with his American wife in her country and kick ass big time around a courtroom.”
“Certainly, O’Sullivan was successful in winning an acquittal when he was personally charged in England as a high school teacher accused of sending lewd text messages and assaulting a 16-year-old female. Given the acquittal, it would not generally be appropriate to bring up this sordid and unproven bit of history, except that O’Sullivan himself went on to write an “erotic” “novel” with a startlingly similar storyline: Vanilla Girl: a Fact-Based Crime Story of a Teacher’s Struggle to Control His Erotic Obsession with a Schoolgirl.
“Although eager to present himself as a science researcher of accomplishment – certainly Tim Ball’s equal – Skolnick’s research found that O’Sullivan is highly prone to error, whether intentional or not.
For example,
” O’Sullivan provided bogus contact information when registering as a member* with the New York County Lawyers’ Association, an organization that apparently does not vet its members’ qualifications (and does not, in any case, bestow the right to practice law). While O’Sullivan claimed to be with a firm named “Principia Scientific International,” he provided the address of a construction company called Second Nature Construction; the phone number and fax number didn’t belong to O’Sullivan or anyone connected to “Principia,” either.
“Principia certainly exists in some form. According to its website, O’Sullivan is its CEO, and Tim Ball is Chairman. Other members include climate deniers Paul Driessen, Paul Reiter and more. Principia notes that it operates as a “private association rather than a charitable foundation.
Make any inventions you like. Seems like there are tears running out of your eyes in stark denial when all you have to do is wait for the case to reconvene and your proof would be right in your hands. But you seem more intend on scream “NO SUCH THING” rather than awaiting the reconvening of the Court.
I am waiting for you to supply the slightest evidence that the BC court hasn’t order Mann to turn over his information. Exactly what do people like you who read extremist sites and actually believe them think you are going to achieve? Facts are facts and you are having nothing more than laughter thrown at you.
https://www.desmogblog.com/affidavits-michael-mann-libel-suit-reveal-astonishing-facts-about-tim-ball-associate-john-o-sullivan
I am absolutely not surprised that you attempt to use a website written by the most loony bunch of jackasses on Earth. That you would attach yourself to the group isn’t in the least surprising.
First,
you have to understand that the people who didn’t vote for Trump in ’16
don’t make up a huge monolithic bloc or live in a leftist,
anti-American mythical land called Utopia.
.
(Or, as the most aggressive of Trump supporters might put it, Libtardia.)
I can’t speak for every anti-Trump voter,
I can only speak for myself, although I’m sure that my reasons
for not voting from the current President
are not too different from other non-Trump voters.
.
Second,
understand this: Donald J. Trump is 71 years old
(as of December 11, 2017).
As such,
he is older than the late President Ronald W. Reagan
at this point in his first term.
People at that age simply do not change their personalities,
philosophies of life, political views, or their agendas.
These are pretty much set in stone and can’t easily be altered
unless a person is intelligent and self-aware enough to realize that he or she must change course.
As a 71-year-old man of
power
and
privilege,
President Trump is not a person who is capable of doing
what one might call a full one-eighty degree turn
as far as his view of the world is concerned.
He’s not smart enough to understand where he has gone wrong
as a newly-minted politician,
and he is certainly not honest enough to admit that
he made a “yuge” mistake in running for the Presidency.
And because he thrives on the loyalty and adulation of his fans
(the MAGA crowd, as I call them),
he would not dare incur their wrath by reversing course
on the following planks of the extreme right’s platform:
.
Repeal and replacement of the Affordable Care Act
.
The “wall on the Mexican border”
.
Refusing to participate in climate change-related accords
.
Lowering taxes for the wealthy
.
Fostering a jingoistic “America First” foreign policy
.
Tolerating and even encouraging
white supremacists and white nationalists
.
Supporting the “birther conspiracy” that claims, falsely,
that former President Barack Obama was not born in the U.S.
.
Undoing everything the 44th President accomplished in
his eight-years in the White House
Waging a war against traditional media outlets
and calling any reporting that he doesn’t like “fake news”
I didn’t vote against Trump because I am a Clinton loyalist.
I’m not.
She’s a remarkable woman
– a former First Lady who was the first member of that grand sorority
to run and win a seat in the Senate
(representing the great state of New York),
and later became President Obama’s first Secretary of State.
But rightly or wrongly,
she has a lot of detractors and can often come off
as just another ambitious politician with ideas
that many conservatives find unpalatable.
.
I also don’t believe any of the crazy conspiracies
that the Republicans invented about Mrs. Clinton
as long ago as the 1992 campaign,
but she doesn’t come across as America’s answer to Angela Merkel.
.
Nevertheless, I voted for Hillary Clinton not just
because I thought she was the better candidate,
but
because I don’t like Trump.
.
And when I say “I don’t like Trump,”
I am not just saying that I don’t like
his policies or his philosophy.
It goes farther than that.
I do not like him on any level.
So, let’s go over the list of the ways in which
I do not like Trump. You know, so there are no misunderstandings:
I do not like him as a public speaker.
I do not like him as a businessman.
I do not like him as a TV personality.
I do not like him as a candidate.
I do not like him as a President.
I do not like him as a human being.
Not one bit.
So,
basically,
to answer the question “For those who didn’t vote for Trump,
what would Trump have to do to get your vote in the 2020 election?”
I can only say this.
Nothing.
Nothing at all.
There’s no way on Earth that Trump can get my vote in the next election.
The Democrats have been financing their party with drug production in Afghanistan, Syria and Mexico as well as South American countries. They have done this through the CIA with the FBI under Obama looking directly the other way.
But to YOU Trump is a problem because he is actually making everyone involved accountable.
https://www.globalresearch.ca/a-conspiracy-theory-that-became-a-conspiracy-fact-the-cia-afghanistans-poppy-fields-and-americas-growing-heroin-epidemic/5533673
https://www.youtube.com/watch?v=MgydvjoftJY
George Soros, John McCain and others are under house arrest and there are at least 1,300 sealed indictments from the Federal Grand Jury mostly for Democrats. A Grand Jury is made up from men and women off of the street like any other jury. Evidence was presented for an indictment and they are sealed so that rats don’t escape the sinking ship.
Mueller, Comey and others in the FBI, CIA and NSA are in deep shit because their underlings who are honest men who wanted to work for their countries found someone honest enough to take action. Trump. No wonder you have such blazing hatred for him.
Take your KKK membership and argue that Planned Parenthood clinics aren’t placed in black neighborhoods almost exclusively not because the liberals want to wipe the blacks out of America completely but because they are the people most in need of abortion clinics because they are normally an immoral people.
Have a nice swim in Lake La La Land !
if you did YOUR homework and read some of the ICE AGE SCARE Newspaper HEADLINES of the 1970’s, you would be struck by the ‘ identical phrases ‘ used throughout….
3 scientists of the day plus 1 book
and
thousands of press releases promoting the idea about a new ICE AGE &/or a NEW WORLD COOLING, from the Fathers-of- Disinformation the COAL and OIL Monopolies.
.
( hence the identical phraseology from newspaper to radio announcer )
.
by the end of the 70’s, Public Relations Departments OIL & Coal Energy Monopolies were high fiving one another…since they had peddled a million new OIL FURNACES
and
had successful divert politicians from dealing with the scathing Research and Warning Reports given to the presidents
.
EISENHOWER in 1958
&
.
JOHNSON IN 1965
.
…about the DANGERS of CO2 Caused GLOBAL WARMING and its changes to the climate of the entire world.
EVEN
NATURE’S Warnings inflicted on the world in the form of
ACID RAIN and OZONE Depletion
have been ignored or ridiculed by the USUAL SUSPECTS.
***
and
then
we have the newer nearly identical PREDICTION
…in the 90’s by
Dr. Roy Spencer and Dr. John Christy
.
….Global Warming will cease to exist around 2000 as the Earth returns to its cyclical fall in temps. into the next ice age.
.
How’s that working out for them??
Well,
1st
THEY came with thousands of press releases about a GLOBAL WARMING PAUSE.
Kinda like filling in the blanks while waiting for the ice age to start ?
.
2nd
THEN THEY came with thousands of press releases about a GLOBAL WARMING HIATUS.
Kinda like filling in the blanks with NOTHING but a Name Change.
.
3rd
AND THEN THEY came with thousands of press releases about a GLOBAL COOLING.
…
and then
and then
Then they pronounce a SOLAR MINIMUM was about to hit in 2007-2009…
Look out snow in summer !
….except, of course, temperatures continued rising!
.
HMMMM ! Something smells rotten in Denmark.
…
Roughly every two years we’re treated to headlines repeating the myth
that Earth is headed for an imminent “mini ice age.”
It happened in 2013, 2015, and again just recently at the tail end of 2017.
This time around,
the myth appears to have been sparked by a Sky News interview
with Northumbria University mathematics professor Valentina Zharkova.
The story was quickly echoed by the Daily Mail, Daily Caller, Breitbart,
International Business Times, Sputnik News, Metro, Tru News, and others.
Zharkova was also behind the ‘mini ice age’ stories in 2015,
based on her research predicting that the sun will soon enter a quiet phase.
The most important takeaway point is that the scientific research is clear
– were one to occur,
a grand solar minimum would temporarily reduce global temperatures
by less than 0.3°C/decade, while humans are already causing 0.2°C warming per decade.
Now
we are hearing about a NEW SOLAR MINIMUM….
what’s the old cheer?
” We want another one just like the other one”
.
A new Solar minimum is coming.
…a new ice age,
….terrible cold
…. BOOOO !
and
now
they SHOW UP
EATING
CROW !
.
FROM
THOSE LEADING
CLIMATE CHANGE
DENIERS.
.
” A STUNNING ADMISSION:
.
“The UAH’s Dr. Roy Spencer & Dr. John Christy?
—both leading deniers?
—Both having predicted that Global Warming would End
around 2000 as the Earth would return to its falling temps.
as we enter the next Glaciation.
—reported just last month that the UAH data
shows a
“Global climate trend since Nov. 16, 1978 [of] +0.12 C [0.22F] per decade.”
.
Temperatures have been increasing all along !
1.
NO PAUSE !
2.
NO HIATUS !
3.
sure as hell,
> > NO COOLING !
.
Dr. SPENCER:
“my UAH cohort & boss John Christy, who does the detailed matching
between satellites, is pretty convinced that the RSS data is undergoing
” SPURIOUS COOLING ” because RSS is still using the old NOAA-15
satellite which has a decaying orbit…”
.
While every one else correct the errors in sat. data thru mathematics.
..
Spencer & Christ found it ” ideologically convenient ” to allow the
decay inaccuracies to support their previous fallacious predictions.
.
So
2014 was the hottest temperatures ever recorded
until
2015 was the hottest temperatures ever recorded
until
2016 was the hottest temperatures ever recorded
and
2017 was the hottest 2nd only to 2016 !
Tell you what – I actually contacted the BC supreme court and went through their records. There is no record of Mann’s present suit but that is because it is in recess and so there are no findings as of yet. But his OTHER records are interesting with what appear to be two nasty divorces and several auto wrecks with him either suing or being sued for several things. His previous suit of Dr. Bell was thrown out of court. That certainly doesn’t bode well for his present one. Tell us Kooi – how many times have you been in courts as a defendant?
Nice string of unsupported acusations. Kinda points to how at least this one denialist’s thinking works.
So you went to the BC Supreme Court records and can contradict me? What is truly sick is that some POS like yourself can’t wait for the actual results of the Court but instead tell us what it is going to be. Sorry stupid. You remind me of a T-shirt that my wife just gave me for Valentine’s Day: “The Universe is Made Up of Protons, Neutrons, Electrons and Morons.” I think we know what category you fit in.
Interesting that you think unsupported personal aacks actually chang the science.
Then attack and insult instead of documenting your assertions.
And try to foist oof your job on others.
in a nut shell, here is your argument slightly recast:
‘Wake doesn’t know what they’re talking about because they use pickled asperagus juice to condition their hair. ‘
Perhaps you are one of those morons that attacks someone and then tells me that I’m not playing fair when I return the favor. Mann is criticized in literally hundreds of places and his failure to turn over his data set is reported on dozens of places. If you wish to believe that Mann is your God and that He Exists by all means do so. When the case reconvenes we will observe what happens.
” one of those morons”
“Mann is your God ”
“When the case reconvenes we will ”
Ummmm, you are the one doing the personal attacks insults, predicting court cases…..
Interesting that you think unsupported personal attacks actually chang the science.
Then attack and insult instead of documenting your assertions.
And try to foist off your job on others.
“..dozens of places. ”
“..hundreds of places”
Funny:”..can’t wait for the actual results of the Court …” from the person using the argument that there is a case in court as evidence the science is wrong……
“..and can contradict me?”
“..his OTHER records are interesting …”
Unsupported assertions, personal attacks, and claims that would have no effect on the science findings.
I will ask you again – what credentials do you have for being able to judge the science contained in Mann’s paper?
https://principia-scientific.org/breaking-fatal-courtroom-act-ruins-michael-hockey-stick-mann/
http://www.coyoteblog.com/coyote_blog/2017/08/natural-climate-variability-and-manns-hockey-stick.html
I see you as nothing more than a chimp humping Dr. Mann’s leg.
“..chimp humping Dr. Mann’s leg”
Well, that is certainly your idea of scientific credentials for commenting on a scientific matter. It has been plain since your initial posting.
Ummm, seems the major thrust of your ejaculations are personal attacks
“..and can contradict me?”
“..his OTHER records are interesting …”
Or legal
principia-scientifi…
Or insulting
“Sorry stupid. ”
“..chimp humping Dr. Mann’s leg”
“Apparently you aren’t bright enough…”
“POS like yourself”
…..
And yet you still haven’t told us what your scientific credentials are. That’s a real shocker.
Oh, let’s see. This is an article about a court case.
This is a thread about the court case.
And I’m pointing out your arguments consist of personal attacks
“..and can contradict me?”
“..his OTHER records are interesting …”
Or legal
principia-scientifi…
Or insulting
“Sorry stupid. ”
“..chimp humping Dr. Mann’s leg”
“Apparently you aren’t bright enough…”
“POS like yourself”
Not sure why science is involved in that sorta discussion.
Why?
We aren’t arguing a point on science.
And there is no rational reason one needs to be an expert in the topic. I haven’t taken the training to be an autotech, but I know how to determine if a mech is qualified. Ditto, a doctor, ditto, a politician citing clownish resources.
The argument at this point isn’t about the science, but how to move forward using what the science is telling us.
What in God’s name do you THINK this story is about? Dr, Michael Mann not only falsified his data in an effort to become the darling of the environmentalists who for 25 years before his paper were trying everything they could to prove that man was destroying the planet, but would accept ANYTHING to show it. First it was Al Gore’s “coming ice age” and then Dr. Mann’s “Anthropogenic Global Warming (AGW)”. Not only was his paper totally opposite the scientific knowledge to that point, but it was totally accepted and supported by people like you – those without an iota of scientific training and less ability to think for yourselves. The same sort of people that use terms like “Big Oil”.
“autotech”? They are called a mechanic here in America. This shows that you don’t know how the hell to tell a good one from a bad. Since the majority of doctors are specialists but have general practices that again demonstrates that you haven’t so much as a clue what the hell is going on in the world around you.
This article hasn’t the slightest thing to do with politics but YOU think it does. Again – you aren’t even educated enough to feed yourself from the answers you give.
Title of the article:
Decision looms in Michael Mann / Tim Ball “hockey stick” lawsuit
“One of those critics was Tim Ball. In a 2011 interview, he quipped that Mann “should be in the State Pen, not Penn State.” Mann sued Ball for defamation in …”
You really have an IQ. What is it – 60? 70? That “defamation” had to do with criticizing the lying cheating science that Mann put into that paper that eventually was called “The Hockey Stick”. But this has gone so far over your head that you obviously never graduated from grade school.
We appreciate that your argumentation hangs on ignoring the title , the lead para, internal paras, and needing to insult.
And we have this bit of irony…
“…lying cheating science that Mann put into that …”
What is the suit about?
Wow….
“Not only was his paper totally opposite the scientific knowledge to that point…”
First time I’ve heard that.
And noted that you don’t support that extraordinary claim.
” “autotech”? They are called a mechanic here in America.”
The Journey of an Automotive Technician
http://www.ase.com/News-Events/Community/Blogs/The-New-Blue/August-2017/The-Journey-of-an-Automotive-Technician.aspx
You really are a clown aren’t you? You think that renaming a mechanic as an automobile technician makes them higher class don’t you? Is your real name Clarabelle?
Ah, so when presented w evidence…
Insult.
Thanks.
And to return to the point, most people recognize demonstrated expertise. Most people have ways to verify they are utilizing that expertise. Whether it be a climate scientist, a major body of research, or the local auto tech.
“…effort to become the darling of the environmentalists…”
Really like to see the interviews and articles discussing that…
Yup, an article about a court case, a blog reciting denialist blog talking points, and an insult really change the science.
/s
What did you read that supports this assertion? Quote and link.
“..can’t wait for the actual results of the Court but instead tell us what it is going to be…”
Would you mind telling us what your credentials are for interpreting anything? Someone that would use the term coal and oil monopolies tells me that you haven’t a F-ing clue about the world around you.
.
As for your hottest years ever – that is a complete and total lie.
While NASA is peddling this chart: https://en.wikipedia.org/wiki/File:Global_Temperature_Anomaly.svg
The satellite record shows no warming for the past 38 years: http://www.drroyspencer.com/wp-content/uploads/UAH_LT_1979_thru_March_2017_v6.jpg
Thgid shows that we had a warmer than usual year in 1999 and a hotter thaN NORMAL SUMMER IN 2015.
As for your attempted denigration of Dr. Spencer, NASA seems to disagree with you since they gave him NASA Exceptional Scientific Achievement Medal (1991), AMS Special Award (1996).
But really all you had to write was “oil monopoly” to demonstrate you are a mindless putz.
and you believe 1 satellite record which has been repudiated by the Scientists who FUDGED PACKED the DATA you swear by AND they have admitted it ! ! ! ! ! !
“….FROM
THOSE LEADING
CLIMATE CHANGE
DENIERS.
.
A STUNNING ADMISSION:
.
“…The UAH’s Dr. Roy Spencer & Dr. John Christy?
—Both leading deniers?
—Both having predicted that Global Warming would End
around 2000 as the Earth would return to its falling temps.
as we enter the next Glaciation.
—reported just last month that the UAH data
shows a Continued
“Global climate trend since Nov. 16, 1978 [of] +0.12 C [0.22F] per decade.”
1.
NO PAUSE !
2.
NO HIATUS !
3.
sure as hell,
> > NO COOLING !
.
Dr. SPENCER:
“my UAH cohort & boss John Christy, who does the detailed matching between satellites, is pretty convinced that the RSS data is undergoing SPURIOUS COOLING because RSS is still using the old NOAA-15 satellite which has a decaying orbit…”
While every one else correct the errors in sat. data thru mathematics…Spencer & Christ found it ideologically convenient to allow the decay inaccuracies to support their previous predictions….For decades ! !
One thing is clear is that you haven’t even high school science. You know absolutely nothing about the weather satellite program and have the nerve to comment on it. I notice that you had no references to Dr. Christy or Dr. Spenser supposedly “admitting” to anything. There is something seriously wrong in your mind. What we need is more total BS from you and your mindless praddling.
It is never any surprise to see and complete and blithering idiot telling all about what he knows nothing about. The very first weather satellite was launched in on February 17, 1959. The orbit wasn’t correct to measure much more than cloud cover. The Explorer VI and VII also had weather experiments on board. TIROS was launched on April 1, 1960 – your holiday apparently. It remained in orbit for 78 days. The Nimbus 3 satellite launched in 1969 and was capable of measuring temperature records through the troposphere.
Since then we have had multiple weather satellite in orbit around the Earth both in geosynchronus and polar orbiting.
Besides NOAA and NASA’s weather satellites the Department of Defense has their own satellites. Several other countries also have weather satellite systems such as Russia, China and India.
There is no more complete record of the temperatures of this Earth than these satellites and some moron like you says “DUHHHHHH one satellite record”. You make fools seem intelligent.
US military Satellite were the first to make us aware of Climate Change…there is only 1 Satellite that is consistently used by
SCIENCE DENYING FOLKS LIKE YOUR!
Every Satellite System above the Earth that is been enabled to read atmospheric data and manipulate to register temperatures….record temps. in near lock-step with world ground stations….NOAA & NASA’s 2100+….and Data Collected by News Media from over 30,000 digital ground stations near every city and town on earth….
ALL report global Warming.
….
if you did YOUR homework and read some of the ICE AGE SCARE Newspaper HEADLINES of the 1970’s, you would be struck by the ‘ identical phrases ‘ used throughout….
3 scientists of the day plus 1 book
and
thousands of press releases promoting the idea about a new ICE AGE &/or a NEW WORLD COOLING, from the Fathers-of- Disinformation the COAL and OIL Monopolies.
.
( hence the identical phraseology from newspaper to radio announcer )
.
by the end of the 70’s, Public Relations Departments OIL & Coal Energy Monopolies were high fiving one another…since they had peddled a million new OIL FURNACES
and
had successful divert politicians from dealing with the scathing Research and Warning Reports given to the presidents
.
EISENHOWER in 1958
&
.
JOHNSON IN 1965
.
…about the DANGERS of CO2 Caused GLOBAL WARMING and its changes to the climate of the entire world.
EVEN
NATURE’S Warnings inflicted on the world in the form of
ACID RAIN and OZONE Depletion
have been ignored or ridiculed by the USUAL SUSPECTS.
***
and
then
we have the newer nearly identical PREDICTION
…in the 90’s by
Dr. Roy Spencer and Dr. John Christy
.
….Global Warming will cease to exist around 2000 as the Earth returns to its cyclical fall in temps. into the next ice age.
.
How’s that working out for them??
Well,
1st
THEY came with thousands of press releases about a GLOBAL WARMING PAUSE.
Kinda like filling in the blanks while waiting for the ice age to start ?
.
2nd
THEN THEY came with thousands of press releases about a GLOBAL WARMING HIATUS.
Kinda like filling in the blanks with NOTHING but a Name Change.
.
3rd
AND THEN THEY came with thousands of press releases about a GLOBAL COOLING.
…
and then
and then
Then they pronounce a SOLAR MINIMUM was about to hit in 2007-2009…
Look out snow in summer !
….except, of course, temperatures continued rising!
.
HMMMM ! Something smells rotten in Denmark.
…
Roughly every two years we’re treated to headlines repeating the myth
that Earth is headed for an imminent “mini ice age.”
It happened in 2013, 2015, and again just recently at the tail end of 2017.
This time around,
the myth appears to have been sparked by a Sky News interview
with Northumbria University mathematics professor Valentina Zharkova.
The story was quickly echoed by the Daily Mail, Daily Caller, Breitbart,
International Business Times, Sputnik News, Metro, Tru News, and others.
Zharkova was also behind the ‘mini ice age’ stories in 2015,
based on her research predicting that the sun will soon enter a quiet phase.
The most important takeaway point is that the scientific research is clear
– were one to occur,
a grand solar minimum would temporarily reduce global temperatures
by less than 0.3°C/decade, while humans are already causing 0.2°C warming per decade.
Now
we are hearing about a NEW SOLAR MINIMUM….
what’s the old cheer?
” We want another one just like the other one”
.
A new Solar minimum is coming.
…a new ice age,
….terrible cold
…. BOOOO !
and
now
they SHOW UP
EATING
CROW !
.
FROM
THOSE LEADING
CLIMATE CHANGE
DENIERS.
.
” A STUNNING ADMISSION:
.
“The UAH’s Dr. Roy Spencer & Dr. John Christy?
—both leading deniers?
—Both having predicted that Global Warming would End
around 2000 as the Earth would return to its falling temps.
as we enter the next Glaciation.
—reported just last month that the UAH data
shows a
“Global climate trend since Nov. 16, 1978 [of] +0.12 C [0.22F] per decade.”
.
Temperatures have been increasing all along !
1.
NO PAUSE !
2.
NO HIATUS !
3.
sure as hell,
> > NO COOLING !
.
Dr. SPENCER:
“my UAH cohort & boss John Christy, who does the detailed matching
between satellites, is pretty convinced that the RSS data is undergoing
” SPURIOUS COOLING ” because RSS is still using the old NOAA-15
satellite which has a decaying orbit…”
.
While every one else correct the errors in sat. data thru mathematics.
..
Spencer & Christ found it ” ideologically convenient ” to allow the
decay inaccuracies to support their previous fallacious predictions.
.
So
2014 was the hottest temperatures ever recorded
until
2015 was the hottest temperatures ever recorded
until
2016 was the hottest temperatures ever recorded
and
2017 was the hottest 2nd only to 2016 !
I have asked you what science credentials you have and you have not answered. That means you have none. You do not understand science and you know nothing about it. No matter how many papers have been published showing no warming or no possible effects from CO2 you will deny them because you are a warmie that HAS to have all of “dem old bastards” wrong and you even willing to go to the lengths of screaming that they’re going to kill the world. This is what is known as mental rigidity from psychological trauma. Did your mother spank you for breaking all of her dishes because it was fun so you hate all older people now? You and Tanya Harding probably have a lot in common.
They are not ” the most loony bunch of jackasses of Earth”
when one compares them to YOU !
Global Warming ‘PAUSE’
..Global Warming ‘HIATUS’
Pronounced By Press Releases,
“….that idea was based on a mistake in the data used to calculate the temperature of the planet, the new research suggests.
.
It builds on a range of research that shows that despite
repeated claims global warming had stopped
(Spencer / Christy)
.
it is actually continuing at a very threatening pace.
Pope Francis rebukes ‘perverse’ climate change deniers !
The idea of a ‘hiatus’ (‘pause’) had been Helpful to
climate change skeptics/deniers
and
Confounding to mainstream scientists, who couldn’t understand why the world would stop warming ( ? )
.
(Data Received from Spencer & Christy being THE major stumbling block)
.
A
even despite increased emissions of carbon dioxide and other gases,
B
even despite increased temperature readings from multiple other sites.
The solution is that the warming PAUSE or HIATUS never happened, according to the new research carried out by Xiangdong Zhang, an atmospheric scientist with UAF’s International Arctic Research Center, who collaborated with colleagues at Tsinghua University in Beijing and Chinese agencies.
“We recalculated the average global temperatures from 1998-2012 & found that the rate of global warming had continued to
RISE at 0.112C per decade
.
(( instead of slowing down to 0.05C per decade as
Pronounced repeatedly in thousands of Press Releases by Spencer & Christy! ))
.
as previously thought,”
said Zhang who is also a professor with UAF’s College of Natural Science and Mathematic…”
[evidence missing]
Apparently you aren’t bright enough to read the article. That’s OK, with the advent of Obama’s ” Common Core” educational system your kind is as common as dog poop.
That’s funny, since I graduated high school in 1980.
You have no evidence that Mann “makes up his numbers as he goes along.”
You have no evidence that his job is in any jeopardy
You have no evidence that there is anything wrong, fraudulent or questionable about his published research.
All you have is your own hapless science-illiteracy, confusion, and conspiracy ideation.
So where did you go to school – Appalachia YOU? It would have taken but a minute to look up the true data and compare it to Mann’s but of course as and ass without the ability to think you couldn’t do it and cry for someone else to help you:
http://www.worldclimatereport.com/index.php/2008/02/11/a-2000-year-global-temperature-record/
http://www.longrangeweather.com/global_temperatures.htm
Are you going to cry tears of rage now that its too hard for you to click on those sites and then refer back to the Mann article? You stupid asses that don’t have the capacity to even think are the ONLY ones beside NASA upper management that are making claims of man-made global warming. Maybe if you sidle up to Al Gore and give him a really sweet kiss he’ll explain it all to you so that you can explain to everyone else around you with all of the authority you have.
“You stupid asses that don’t have the capacity to even think are the ONLY ones beside NASA upper management that are making claims of man-made global warming.”
–not to mention every reputable scientific organization and institute in the world and every accredited university science department.
Your sources for “true data” seem to be some random internet cranks.
Well, I would have given you https://earthobservatory.nasa.gov/Features/GlobalWarming/page3.php
But you’re so obviously stupid you wouldn’t have a clue how to interpret it.
Bet you didn’t read as far as this passage:
“Models predict that Earth will warm between 2 and 6 degrees Celsius in the next century. When global warming has happened at various times in the past two million years, it has taken the planet about 5,000 years to warm 5 degrees. The predicted rate of warming for the next century is at least 20 times faster. This rate of change is extremely unusual.”
But you’re so obviously stupid you wouldn’t have a clue how to understand your own links.
Do rather than face the object of the discussion which was that Mann manufactured his own data set, now you want to tell me about some jackass model that not only hasn’t predicted any of the changes to date but is so inaccurate that when you look at the predictions of past temperatures it is totally wrong. No wonder you love classical music, it doesn’t take any brains to just listen.
You are obviously so stupid you don’t know the difference between a PR blurb and peer reviewed science .
.
Just show one peer reviewed paper that claims warming past century 20x faster than prior warming periods .
What’s your evidence that the FAQ and informational pages at NASA are “PR blurbs”?
“The predicted rate of warming for the next century is at least 20 times faster. This rate of change is extremely unusual.””
So far, no go For the last 18 years, practically no warming.
“practically no warming ”
–except in every available data set, with 2014, 2015, and 2016 each in succession the warmest year ever recorded.
Did you ever pause and think why “18 years”? Did you miss where your favorite information sources started their reckoning with the 1997-1998 El Nino year, the hottest of the 20th century?
That is called cherry picking, and you have been duped.
But CO2 levels continue to increase. They continued to increase while temperatures were declining (according to “global” data) from 1945 to 1975. No, I have not been duped. But nice try.
Deflection. You were claiming no warming since 1998. Now you are referring to 1945-1975 (about which you are incorrect)?
As someone else may have suggested to you (or maybe not), if you get all your science from WUWT and Climate Depot, you are bound to lose brain cells, not gain them.
1945 – 1975 was a period of massive post war development and very lax pollution control.
The resulting aerosol pollution masked the warming effect of the CO2.
As soon as the Clean Air acts in the US and around the world kicked in to reduce the pollution the warming was clearly evident.
You have been well and truly duped.
I do .. Dr. Muller of Berkeley called his “hockeystick” graft ” data manipulation intended to deceive the public and fellow scientists”
.
Watch the first minute ;
https://www.youtube.com/watch?v=BuqjX4UeBYs&t=8s
Muller was wrong, obviously.
And the word is “graph,” not “graft.”
Wrong ,according to you ?
.
Ho ! Ho ! Ho !
.
As regards the “hockeystick” , Graft is the correct description .
Dr. Mann’s graph with the totally missing Medieval Warm Period and the Maunder Minimum have been refuted by virtually everyone in every paper about the mean global temperatures. Dr. Mann attempted to excuse their missing by saying that they were entirely local to Europe. But that is wrong. We not only have written reports of those times but geological evidence that they were world wide events from as far away as Australian and New Zealand. South America and the USA.
This attempt of his was to render the temperature variations being due to solar variations as impossible.
Nothing quite like up to date positions from people who have used science to arrive at a resulting conclusion. Or basic punctuation for that matter.
https://www.youtube.com/watch?v=Sme8WQ4Wb5w
Where does he claim he was wrong about Mann et al and his “intended to deceive the public and fellow scientists ” ?
.
Not there ,is it ?
I couldn’t find his paper on google scholar, could you?
It seems you still are none the wiser as to how science works socky.
Here’s a bit of background reading for you:
http://environmentalforest.blogspot.co.uk/2013/10/enough-hockey-sticks-for-team.html
Sorry, that cruel I know, given that you cannot read, let alone write.
Look up the 2006 NRC report .
.
Muller was a referee ,and talks about it here (link below).the obvious dismay of the interviewer is priceless !
.
https://www.youtube.com/watch?v=Jyd_PJJ_pB4
So you couldn’t find a paper either.
I guess we’ll have to file that as another of your conspiracies where no evidence was presented to the scientific community to substantiate any allegations or statements made.
Very weak on your part.
This is not going well for you at all. Let me know when you discover some actual science.
Maybe Muller and the NRC should be sued by Man & Co. Too ?
.
Priceless !
Still no science to substantiate your baseless claims.
It’s a hard job being a scientifically illiterate science denier like you.
I quoted Dr. Muller ,climate scientist ..
.
Not my claims ,ignoramus .
In March 2011, he testified to the U.S. House Science, Space and Technology Committee that preliminary data confirmed an overall global warming trend.
In 2012 he stated, “Humans are almost entirely the cause.”
Good work socalpa. I fully agree with your chosen climate science expert. Nice call.
He certainly is an expert on Dr. Mann .and his graft .
.
Lots of scientists agree with that claim ,so what ?
Really? Please could you provide a link to his papers on this subject, I’d be keen to read them.
Do you, as a non scientist and fossil fuel shill on the internet, agree that humans are almost entirely the cause?
If not not what is your evidence to the contrary?
socalpa ROO2 • an hour ago
Look up the 2006 NRC report
.
Class dismissed .
Again – do you have even an idea of the difference between a statement and a study? I’m a scientist and what is plain is that you are not. You grow tiresome with your stupid statements about things you don’t understand.
And I’m the pope.
No, you’re just the typical mindless ass that as Mark Twain said, “people’s beliefs and convictions are in almost every case gotten at second-hand, and without examination, from authorities who have not themselves examined the questions at issue but have taken them at second-hand from other non-examiners, whose opinions about them were not worth a brass farthing.”
You’re just the typical mindless ass that as Mark Twain said, “people’s beliefs and convictions are in almost every case gotten at second-hand from LOLWUWT and ex TV weatherman internet sites. Sometimes they claim to be scientists, but no scientist would cite an internet cite funded by fossil fuel think tank money as a scientific reference. People like Wake who claim to be something they are not will accept any Derp to support their political viewpoint, and without examination, from authorities who have not themselves examined the questions at issue but have taken them at second-hand from other non-examiners, whose opinions about them were not worth a brass farthing.”
Tell you what, there is no way to get through to True Believers in the Church of Global Warming. I suppose when the end draws near you can simply commit suicide because even Al Gore your High Priest has said that it is already too late to do anything about it.
Claims the person stating evidence free assertions about the actual science, claiming they are a scientist, and having highlighted the science is wrong but is yet unpublished in their groundbreaking work. Yet here there are instead rambling their witless gibberish on Disqus, I think we get the picture.
Was he talking about your lack of scientific education perchance? LOL
Or your lying?
Or your shilling?
Perhaps you should refer to the scientists for an answer, and that does not include Al Gore, oh claimed scientist. Pwhahaha
Ah, so “wakey” here is using the same set of insults and so forth regularly… good to know.
Apparently, we ALL get 100% of what we believe from “ex-TV-weatherman internet sites.”
At least, in his delusional version of reality.
He strikes me as being at least as likely to be a “scientist” as you do. In fact, a lot more. You strike me more as Peter Venkmann’s version of “scientist.”
In case you are unaware of it Dr. Ball was sued by Mann for making statements about Mann’s faulty study. Since you are so obviously devoid of knowledge of this matter I suggest you stop with further opinions that further demonstrate that you are only posting to see your name on the Internet as if that was some sort of achievement.
https://wattsupwiththat.com/2018/02/14/tim-balls-victory-in-the-first-climate-lawsuit-judgment-the-backstory/
Since the Mann case is in the same court it is highly unlikely to have a different finding and if they rule that Mann has committed Contempt of Court, which they must, the dismissal will be with prejudice and will no doubt bear significant financial penalties for Mann.
LOLWUWT?
I thought you said you were a scientist?
I normally find that scientists actually cite science not college drop out TV weathermen internet sites, of articles written by geographers.
Hey ho, such is the level of Derp trumpeted by climate deniers like yourself though.
I guess your lack of logical thinking is why you are so easy to sell the conspiracy theories you so readily embrace.
Do engage your brain and stop lying about being a scientist, there’s a good chap.
So ROO2, do you have ANY idea how huge the uncertainty is on these supposedly “settled science” elements?
Do you have any idea how uncertain the majority of IPCC scientists are, about the climate science issues?
We would all do a whole lot better if we could recognize that the people who are putting their thumbs on the scales are also being disingenuous about the fact that their models and their adjustments are simply increasing the uncertainty… and that the actual data does not show the warming they think it does.
You want references. Fine. There is plenty of info out there for those who have eyes to see.
– IPCC uncertainty: go look up the LOSU data (Level Of Scientific Understanding) for each draft of each IPCC report. What you can actually obtain. It tells a sad story.
– IPCC bias: go look up the very purpose of IPCC. Look up the questions they do and do not ask, because of that purpose. This too tells a sad story.
– Adjustments: go look up the very best, longest term data set produced in a single location by one guy (except for a few years at the beginning when he was assisting an older gentleman.) East Hampton, NY. 84+ years. He got an award as the longest serving COOP volunteer. He had one TOBS change and one thermometer change… neither of which affected his reports. Yet his data has been adjusted by more than the total estimated 20th century warming.
– Science: google NOVA what make science true. Watch the video several times. Then you will begin to understand why we have a crisis in modern science of *scientists* let alone media let alone “regular folk” who have no clue what science is actually about.
Have fun ranting :)
“True Believers in the Church of Global Warming ”
How to Use Science, Cartoons, and Satire to Talk about Climate Change
http://citizen.hkspublications.org/2018/02/15/how-to-use-science-cartoons-and-satire-to-talk-about-climate-change/
It’s almost like some couldn’t see the difference between TheOnion and Nature….
https://reason.com/volokh/2018/02/11/whatever-happened-to-michael-manns-defam
So your knowledge comes from reading Church of Global Warming sites? How sad for you and your attempt to act smart.
No, I don’t read LOLWUWT like you.
Those are peer reviewed papers that you can access and read from high impact rating Journals and reflect the scientific position on paleoclimate science.
Given your are not a scientist, I’m not surprised you missed that point.
Why don’t you tell us what you think “peer review” means? I certainly am not moved by some moron telling me I’m not a scientist when you don’t have a clue what you’re talking about.
I don’t need to given you claim to be a scientist, but then you evidently are not a research scientist given your answer.
It’s why you could not offer any rebuttal to the content of the papers that were presented on the link I provided.
You defaulted to your faith based script rather than presenting evidence to the contrary of the current scientific consensus on paleoclimate data.
Do send my regard to Fred Phelps. ;-)
Ah, did you notice how “Roo” just dodged away from answering the question?
He doesn’t want to acknowledge that “Wake” had a point. So, instead, he falls back into “assertions” mode, with a dollop of “Alinsky’s Rule #5” (“ridicule is mankind’s most potent weapon”) tossed in for flavor, I guess.
Perhaps you can explain why you have the grammar of a 12 year old?
http://nov79.com/gbwm/hnzh.html#width
http://notrickszone.com/2018/01/01/150-non-global-warming-graphs-from-2017-pummel-claims-of-unusual-modern-warmth/#sthash.xOMSjuoT.kUXY01wu.dpbs
https://thsresearch.files.wordpress.com/2017/05/ef-gast-data-research-report-062717.pdf
https://nofrakkingconsensus.files.wordpress.com/2011/10/delinquentteenager_sample.pdf
http://www.petitionproject.org/
So let’s see – the IPCC has 2,500 “scientists” (the largest number of which are not scientists at all but politicians) and the Oregon Petition has over 31,000 almost a third of which are PhD’s and at least three of whom are Nobel Laureates.
On the other hand you have yourself without a single credential to your name who tells us that 2,500 is fully 97% of all scientists.
I must say that it’s time for you to attack my credentials. I designed and programmed both gas and liquid chromatographs meaning I had to be scientifically literate with spectroscopy. Probably something you didn’t even know existed until you just read it. There are literally millions of people walking around alive today because of the medical instruments I designed and programmed – not the least of which was the instrument to prove Dr. Kary Mullis’s Polymerase Chain Reaction chemistry for detecting HIV in the blood banking system and allowing safe blood transfusions again. Dr. Mullis received the Nobel Prize in Chemistry for that which he may not have been able to do without solid proof of it’s effectiveness that I supplied.
My communications boards are sitting on the International Space Station. What was it that you do again? Janitor in a men’s gym?
Now get this – he can see negative temperature swings from volcanic eruptions but he doesn’t see any connections between solar output and warming. I respect Dr. Muller and his work but I would have to read his paper on this. Also thinking that you have any sort of accurate record for 250 years is rather surprising. OK, I have now investigated Professor Muller and am rather skeptical of his results. He owns a company that advises power companies on their power sources. It appears that he is also invested in water purification, wind power and small scale nuclear power. All of this is perfectly good investing but it also is liable to bias his claims. I am extremely skeptical that he could measure volcanic activity via MGT and yet not match up solar output to warming. https://history.aip.org/climate/solar.htm
Not surprising given your own citation:
From the low to high point of a sunspot cycle, the change in “radiative forcing” is equivalent to the interference in radiation passing through the atmosphere caused by 15 years of human emissions of carbon dioxide.
Back in 1994 a U.S. National Academy of Sciences panel had estimated that if solar radiation were to weaken as much as it had during the 17th-century Maunder Minimum, the entire effect would be offset by another two decades of accumulation of greenhouse gases.
Did you even with with comprehension your citation?
I’m still waiting to discover why you didn’t read the entire article but stopped at the point in which you could manipulate to advance your belief. I also see that your understanding of science is so weak that you don’t know that hypothesis change almost weakly as new information is discovered.
But it is no surprise to me that True Believers in the Church of Global Warming don’t actually have any credentials of their own but hang entirely on their own holy-men and scriptures.
Since CO2 produces no energy it will not add to the amount of energy the earth receives from the sun. This according to the well established laws of thermodynamics. You don’t get something for nothing.
None of the gases in the atmosphere are chemically active in that manner. More or less the single source of energy on Earth is from the energy absorbed from the Sun. The Warmist theories are that CO2 acts as a blanket slowing the radiation of the Sun’s energy from the Earth. But CO2 doesn’t act that way. It has only three major energy absorption lines and the energy available in those bands is totally absorbed at very low percentages of CO2. Additional CO2 simply doesn’t have any energy to absorb. Nevertheless CO2 is a very minor factor to begin with. H2O in its three phases absorbs across the entire band of frequencies of lower IR (the heat energy released from the Earth). It is 100 times or more as common as CO2. This means that within between 1 and 10 meters from the surface of land and within inches of water all of the emitted energy of the Earth is absorbed. Transmission of this energy into the tropopause is accomplished by conduction and convection of all gases which are almost alike in that regard. As this energy works its way into the stratosphere it becomes too thin to conduct energy between molecules and these molecules then interact with the incoming Sun’s energy to grow in energy to the point that they radiate. This has a bouncing effect between the stratosphere and the tropopause until the energy radiates into space. This is backed up by looking at the temperature curve in the stratosphere that shows temperature increasing with altitude in the stratosphere rather than lessening as one would expect.
The reason CO2 is regarded by mainstream physicists as a greenhouse gas is not because it is a source of energy, but because it traps thermal radiation.
No laws of thermodynamics need fear for their violation.
yes it is like a one way mirror, lets thermal radiation in but none out. remarkable! This as it is only comprises 0.003% of the atmosphere. Powerful stuff. Must be the carbon gets polished on one side, the down side, this reflects heat back onto the earth, while the upside is black and attracts energy.
Ridiculous.
CO2 reflects thermal radiation in all directions. It is solar radiation that passes right through. Different wavelengths. If CO2 retained all thermal radiation, the surface would more closely resemble Venus. Fortunately, its quantities are insufficient to do that, but at 280-330ppm sufficient to maintain temperatures in a livable equilibrium. Unfortunately it has increased by 40% to about 410ppm in just the last 150 years, entirely from anthropogenic sources.
Consider the possibility that NASA, NOAA, and legitimate scientists are better sources for information about this topic than a website run by an anti-science propagandist like Morano.
“CO2 reflects thermal radiation in all directions”
No, it does not. The CO2 molecule is resonate at two wavelengths within the IR spectrum. Radiant wavelength is inversely proportional to temperature; that is the higher the temperature of a substance, the shorter the wavelength radiated. Since CO2 has a relatively low specific heat, it does not account for much of energy distributed by the atmosphere. The large majority of that is done by CO2
“Consider the possibility that NASA, NOAA, and legitimate scientists are
better sources for information about this topic than a website run by an
anti-science propagandist like Morano”
You might be interested to know that the previous head of NASA, Mike Griffin was replaced by the Obama administration. It seems that Griffin was more interested in NASA’s original mandate than promoting the highly unlikely agenda of AGW. Perhaps this will change.
You’ve never taken a class in atmospheric physics, have you?
Please consult any of the widely used textbooks: they all describe how the GHE works. Indeed, even the Wikipedia page on the topic provides a readable and well-sourced description. (Of course, on sites like CFACT, I am never surprised if commenters prefer the “science” found at Conservapedia).
Earth science and study of the earth has been part of NASA’s mandate from the beginning.
Mike Griffin was not either a greenhouse gas denier nor a climate change denier, nor did he oppose research into the climate. Because, like most people who actually understand these matters, he recognizes that one of the primary purposes of space exploration is to gather information beyond our planet in order to understand our planet better.
I’m getting the impression you’re responding to a couple who didn’t proudly show their parents the 8th grade Earth Science chapter test results.
The reason CO2 is regarded as a greenhouse gas is because it is one of the atmospheric gas needed to make photosynthesis work. That is the process that makes our planet green, not hot. The sun makes the planet hot. A greenhouse is designed to limit heat transfer by convection. It is also designed to control humidity. CO2 does none of this. There are three manners by which energy is transferred: conduction, convection, and radiation. The only manner by which the sun warms the earth is by radiation. The atmosphere only serves to distribute the sun’s energy about the planet.
“The reason CO2 is regarded as a greenhouse gas is because it is one of the atmospheric gas needed to make photosynthesis work.”
–actually, the reason CO2 is regarded as a greenhouse gas has nothing to do with photosynthesis. “Greenhouse” was a metaphor coined in the 19th century to describe gases that have the property of trapping thermal radiation. A “blanket” could also have been used as a metaphor, though it would work less well on an intuitive level for describing the impact of an atmosphere. Without that CO2 in the atmosphere, the earth would be a frozen ball of rock and ice.
The only thing correct in your comment is that the initial source of the heat is the sun. GHGs are transparent to solar radiation (which has a different wavelength from thermal radiation).
Or are you actually suggesting that methane and nitrous oxide (two other greenhouse gases) are necessary for photosynthesis?
Greenhouses predate the AGW claims several hundred years. CO2 and energy from the sun along with H20 is necessary for photosynthesis to take place.Photsynthesis is the process by which energy from the sun, CO2 and H2O along wig nutrients in the soil are converted into carbohydrates. The purpose of a greenhouse is to provide some isolation from the local environment. Greenhouse gasses are those naturally occurring in the life cycle. For example, fluorocarbons are not greenhouse gasses as they are man made. The term “greenhouse gasses” has been politicized NO2 combines with water to form nitric acid (HNO3)
This is nonsense.
The greenhouse effect was discovered in the 19th century by Fourier, Tyndall, and Arrhenius. Arrhenius was the first person to suggest the possibility that human-produced CO2 could have an effect on climate.
The use of the term “greenhouse” was as a metaphor for the way in which certain atmospheric gases are opaque to thermal radiation. It was not a reference to literal physical greenhouses. It has nothing to do with photosynthesis.
The role of CO2 in the natural respiration cycle is a completely different matter.
The only people who have politicized the term “greenhouse gasses” are those who deny their role as regulators of atmospheric temperature and who insist on confusing them with literal greenhouses ,and who see this confusion as a mechanism for misleading the public about mainstream climate science.
“No laws of thermodynamics need fear for their violation.”
None taken
Your comment makes no sense.
The greenhouse effect is fully consistent with the laws of thermodynamics.
No, it is not. In order to increase the temperature of a system, you must increase the energy contained within that system. The laws of thermodynamics clearly illuminate this. There are several ways by which mankind could influence to a small degree the earth’s temperature. Adding CO2 is not one of them. That would be adding mass to the atmosphere, which means the atmosphere would take longer to warm during the day and longer to cool off at night. That is called latency.
This is science-illiterate piffle. Of course it does have a home at CFACT/Climate Depot, because that is Morano’s intent.
The greenhouse effect does not imply that greenhouse gases add energy or produce heat.
Quoting old Muller quote… check
Citing Cooks decade old bio… check
Cite Gore … check
Check, please…..
In this case, I think “graft” is appropriate.
What you think is of no matter.
You and your fellow AGW-deniers are the ones alleging fraud and malfeasance on the basis of your own ignorance.
“Graft” sounds more appropriate.
Very easy if you find mainstream science to be essentially devious and fraudulent, and you are unable to understand trend lines.
It’s not essentially devious, but the motivations to exploit the system are great. If you don’t realize that, you are willfully ignorant. Just Google “scientific misconduct.”
You can Google anything and get conspiratorial nonsense and misinformation, particularly if you lack the critical thinking skills and knowledge to sort things out.
Why do you find a worldwide, decades-long conspiracy of lying scientists embracing peer-reviewers, every reputable scientific institution and organization in the world, and every accredited university research science program in the earth sciences so much more plausible than the possibility that a tiny and closely-knit group of activists, fossil fuel propagandists, and science-denial bloggers, Morano included, might be lying to you?
Mann’s numbers are different from the numbers historically recorded for the period known as the medieval warm period and the period known as the little ice age. If he is correct about his claim he should be more than willing to release the data and the method he used to obtain it. That would serve to
establish his position. Until he can offer proof, his claims are bogus.
This is a misrepresentation.
His data and methodology are freely available from his Penn State website.
Stop trying to get your science from Mark Steyn and/or Tim Ball (or Marc Morano).
My science is not at question here . Yours is. You and your fellow AGW acolytes are trying to prove your theory that mankinds release of CO2 into the atmosphere has caused the earth to warm some 7 tenths of a degree in the last 150 years. So far you have not done so. What your agenda is, I do not know.
Then why does literally every reputable scientific institute and organization in the world and every accredited university scientific research program think that AGW is real and that the greenhouse effect (as I have described it, not your silly “photosynthesis” notion) is not a political issue but an actual principle of atmospheric physics that has been known since the nineteenth century?
Are you as skeptical of evolutionary biology as you are of mainstream climate science?
Cold kills 20 times more people than heat. So, what’s the problem? The colder it gets, the worse it gets for mankind. All the peer review, circle jerks in the junk science community won’t make the problem of colder weather go away. I hope for the warmth. Crops like it. People like it. The economy likes it. An effort by a few control freaks to shave off one degree or even two over the course of the next one hundred years or so at the cost of trillions sounds like an endeavor of extreme, stupidity. Do it on your own dime.
“Science is extreme stupidity” sez Gotham Knight
So, you disagree with scientific observations concerning the effects of colder temperatures. I wonder who is stupid.
“So” fail.
The greenhouse effect causes an acceleration in warming that produces a chain of negative effects.
Peer review is not “circle jerks.”
Mainstream science is not “pseudoscience”
But you Marc Morano/Trump acolytes live in a safe zone of fake science and conspiracy theories.
I live in a cold zone, far up north. I like it when it gets warm. Climate has a 300 year cycle defined by the sun’s energy output. The cycle is made up of a maximum and minimum over that period and magically coincides with migrations and the rise and fall of civilizations. Good luck affecting a change in that. We are entering a time of global cooling. It will happen before the climate control freaks can claim credit for it.
“colder weather”
*facepalm*… Climate =/= Weather
Also, no, the “CDC’s finding that cold is the top weather-related killer in the U.S. contrasts with some alternative analyses. For example, the National Weather Service’s National Hazard Statistics – which examines different data – shows heat rather than cold was the leading weather-related killer between 2004-2013.” Washington Post Aug 4, 2014
https://climatechangedispatch.com/al-gore-confuses-weather-with-climate-will-media-call-him-out/
You should talk to Algore about that:
https://www.ons.gov.uk/peoplepopulationandcommunity/birthsdeathsandmarriages/deaths/bulletins/excesswintermortalityinenglandandwales/2016to2017provisionaland2015to2016final
Ah yes, the Gore trope. Al Gore being wrong about something means nothing, he is not a climate scientist or even a scientist. All you did was highlight how you’re both wrong.
“More people die in the winter than the summer.” That’s “death in winter vs summer”, not “death from heat vs cold”.
From my article:
Also, you’re ignoring all the other adverse things that will happen when the climate warms, like increasing the water vapor content of the air which will actually cause more and harsher winter storms, not less. See, when it’s colder the air has less water vapor and precipitates less, but when it heats up, precipitation (including things like snow-fall and blizzards) increases, which are other things that cause deaths. So, no, a warming climate isn’t just going to make things all nice and toasty like spring..
Your side is losing. The majority are beginning to realize after one failed prediction after another of the dire consequences of increased carbon dioxide, a life gas, a fraction of which is contributed my man, that people like you are authoritarians. That more taxes, redistribution of wealth, control over every aspect of human existence has found just another excuse to be implemented by parasites on a grander scale. It will fail, but leave misery in its wake, like it has always done. Unfortunately, for people like you and me, unless you are part of the inside club, we will be poorer, the rich will just get richer, and in the end, the same people you trust to solve the problem, who can’t wage a war they can win, who leave the infrastructure of this nation to rot, who line their pockets with taxpayer money, won’t be able to solve a problem that doesn’t exist.
Nice diatribe. I guess you decided to drop your case and switch to blind conjecture. This’ll take a minute to read as it takes more to respond to a false claim than to make one.
“Your side is losing.”
My side is science and doesn’t seek to win or lose, only to explain.
“one failed prediction after another”
The observation is that global average temperatures have increased and that it is not a good thing. Whether individuals make correct or incorrect predictions is not important. The models of the behavior of the climate are not “failing” because those models predict a wide range of possible outcomes, from ultra conservative and optimistic to worst-case and pessimistic, thusly we end up somewhere in the range of predictions no matter what the case may be.
“carbon dioxide, a life gas”
Not hardly and if you don’t believe me, try sucking on a tail pipe some time and let me know how life-giving the results turn out to be. Too much of anything is too much.
“a fraction of which is contributed my man”
You obviously don’t understand the concept of natural balance. Upsetting a sensitive balance in a system causes all sorts of problems, i.e. the accumulation of heat.
“that people like you are authoritarians”
Did you vote for Trump? Because then that has to be a joke. Strawmen burn easily.
“That more taxes…”
Some taxes are good, or you have no money to give to your police department or your city to build roads and street lights. Would you prefer to have zero taxation? Are you an anarchist?
“redistribution of wealth
For a geologist, you sound kind of ignorant.
“My side is science and doesn’t seek to win or lose, only to explain.”
Is that why you adhere to such a wide range of predictions, opinions and preferences, very few of which actually come true? I’d hardly call that the scientific method.
“..thusly we end up somewhere in the range of predictions no matter what the case may be.”
So nearly all the possibilities are covered within some undefined range, and then you can never be wrong. Smart.
“…let me know how life-giving the results turn out to be. Too much of anything is too much.”
If plants could talk, they might tell you otherwise. We need plants, by the way, in order to live. You might be thinking of CO. That’s the real poisonous stuff coming out of a tailpipe.
“Did you vote for Trump? Because then that has to be a joke. Strawmen burn easily.”
I don’t like Trump, but you might want to include even one example of his being an authoritarian. Last time I checked he’s cutting regulations.
“Some taxes are good, or you have no money to give to your police department or your city to build roads and street lights. Would you prefer to have zero taxation? Are you an anarchist?”
Your lack of logic here is laughable. It’s called the either-or-fallacy, or false dilemma. I state “more Taxes” and you say that I’m against all taxes.
“That’s rich but the republicans are definitely the ones that would like to redistribute the wealth of America to the top 1% and let it “trickle” down to the rest. Pshaw, what a crock.”
Talk about the straw man. In the context of a carbon tax, which I apparently mistakenly assumed you knew what I meant, that tax is about redistributing wealth among nations. Look up Dr. John P. Holdren.
“Ha, sorry but I don’t subscribe to the Christian Church (the real authoritarians attempting to control every aspect of human existence).”
Boy, you do love attacking the the straw man.
“What will fail, limiting air pollution? Why will not polluting the atmosphere somehow leave misery? If something fails how will it also leave misery? Cognitive dissonance at it’s finest…”
Establishment of a more authoritarian control over the decisions we make in the form of carbon taxes and the restrictions of energy usage will eventually fail to make any difference in the temperature of the earth, but will leave a lot of misery in its wake.
“I’m a geologist and know of not a single “club” that will benefit from limiting carbon emissions aside from everyone who would like to avoid increased intensity of storms and sea level rise, etc… so, humans, basically..”
Are you part of the carbon credit trading system? I didn’t think so. It’s a great way to become rich off of a giant ponzi scheme. It’s just getting started, all it needs is the power of governments behind it. Won’t really do anything to limit carbon dioxide, just divide its output among different producers, but it will make those part of its implementation very wealthy.
“…like to avoid increased intensity of storms and sea level rise, etc…”
You base your fears of the results of climate change on assumptions, so to argue that is pointless.
“The rich? You mean like oil companies that only stand to benefit from deregulation and freedom to unearth any and all oil they see fit at the expense of the planet?”
I was referring to those involved in the carbon credit trading. Not your straw man nasty oil company. We get poorer through increased energy costs and related taxes.
“What about education? How come republicans keep cutting education to fund wars?”
Didn’t see any Democrats stopping the insane wars we’ve been involved with. Obama was around for eight years. You probably voted for the queen warmonger. I’m a Constitutionalist, so both republicans and democrats make me want to puke. We’ve wasted over 7 trillion dollars on the Afghanistan and Iraq wars The danger to our environment and nation is our leaders’ addiction to endless wars. Nothing is worse. Especially carbon dioxide.
“For a geologist, you sound kind of ignorant.”
This coming from a guy with a Batman handle… how would you know the difference with your viewpoint from your mother’s basement? I study nature, son, what do you study, comicbooks?
“Is that why you adhere to such a wide range of predictions, opinions and preferences, very few of which actually come true? I’d hardly call that the scientific method.”
Lol, why do non scientists always lecture functioning scientists on things like “scientific method”. Fool, I don’t adhere to the entire range of predictions. In fact, I don’t “adhere” to any prediction, I consider them well informed possibilities and hope for the best. However, the IPCC predictions were very conservative and multiple lines of evidence have shown we are following the worst case scenario, i.e. sea level is rising faster, ice loss is faster, etc.
“So nearly all the possibilities are covered within some undefined range, and then you can never be wrong. Smart.”
Undefined? *facepalm* The range is defined by the upper and lower bounds… Dumb.
“If plants could talk, they might tell you otherwise.”
Too much of anything is too much. CO2 is not the only thing that plants need to survive, they need other things such as phosphorus and nitrogen. Increased CO2 has been shown to lead to lower production of certain chemical defense mechanisms in soybeans, and an increase in the production of phenolics and tannins in some species, as well as many alkaloids, all of which may have potential consequences on the health of primary consumers. The decreased nutritional value in combination with these factors has been linked to decreased growth rate and conversion efficiency of some herbivores, as well as an increase in their relative demand and consumption of plants. Definitely not the “life gas” you’re suggesting it is.
“You might be thinking of CO. That’s the real poisonous stuff coming out of a tailpipe.”
Nope, exhaust gas from an average tailpipe is around 71% Nitrogen, 14% CO2 and 1-2% CO.
“I don’t like Trump, but you might want to include even one example of his being an authoritarian. Last time I checked he’s cutting regulations.”
*Laugh* How about the recent one where he applauded Xi Jinping for instituting himself as life-long ruler and suggested that maybe we should try it. Or how about his aversion to dissent and critique, like saying that not applauding what he says could be treason? Or intimidating the media? His insistence on loyalty to him being a key strength for his cabinet. Demonizing his political opposition. Did you hear the most recent one? Taking away guns before due process. How about his demagoguery? He’s definitely a populist and a nationalist and politicizes the military, things that make for strongman authoritarianism.
“Talk about the straw man. In the context of a carbon tax, which I apparently mistakenly assumed you knew what I meant, that tax is about redistributing wealth among nations. Look up Dr. John P. Holdren.”
Taxing carbon emissions isn’t going to give “the elite” more money, the top 1% of income earners have an average carbon footprint two orders of magnitude bigger than someone in the bottom 10%. Most progressive tax programs aim to send the money back towards things like infrastructure and ending income inequality. You know, things that help us not-so-rich people. If we structure it correctly, including things like tax credits up to $1500 like Washington D.C. is proposing, or the cap-and-trade program the US proposed in 2009, then we could provide a refundable tax credit to workers and payments to retirees, people with disabilities, and veterans.
“Boy, you do love attacking the the straw man.”
The Christian church believes the country should be run from the bible, which one would call a Theocracy, the very definition of authoritarian rule. They seek to tell everyone how to live their lives, don’t play coy, it’s written into the bible and a solid portion of them believe is literal.
“I’m against pollution, by the way.”
CO2 is pollution.
“It’s a great way to become rich off of a giant ponzi scheme… Won’t really do anything to limit carbon dioxide, just divide its output among different producers, but it will make those part of its implementation very wealthy.”
Your lack of insight and adherence to political talking points shines through but you don’t back yourself up with evidence. There is no “carbon club” that stands to set themselves up to profit directly from a carbon tax, unless you’d like to actually provide some solid evidence. Cap-and-trade isn’t set up or regulated by the businesses themselves and, as I said, will also include tax incentives and breaks for the mid and lower classes.
“You base your fears of the results of climate change on assumptions, so to argue that is pointless.”
Increased water vapor causes increased precipitation and warmer oceans melt the ice, raising sea levels. I base this on hard science and research from major universities. You base this on “facts” distributed through blogs funded by fossil fuel industry PR.
“I was referring to those involved in the carbon credit trading. Not your straw man nasty oil company. We get poorer through increased energy costs and related taxes.”
Regardless of whether companies can trade in tax credits, oil companies stand to benefit more from deregulation and the ability to suck up as much oil as they want, from where they want, whenever they want, however they want. They are very willing to spend money on lobbyists to do so which is only a fraction of what they would have to pay if they were regulated.
“Didn’t see any Democrats stopping the insane wars we’ve been involved with.”
Didn’t see any republicans voting to reduce military spending. Obama voted to end the Afghan war and wanted to pull everyone out but simply couldn’t (we were too invested and still are).
“Obama was around for eight years. You probably voted for the queen warmonger.”
I didn’t vote in that election because I didn’t care who won because I couldn’t decide. I’m from Arizona and thought that McCain would have been decent but that Clinton could have as well… had no idea about Barack back then. I voted for him against Mitt Romney though, as that’s a rational and pragmatic vote, cultist zealots are nuts.
“I’m a Constitutionalist, so both republicans and democrats make me want to puke.”
Ah, a republican that doesn’t like other republicans and wants to seem rational in their irrationality by distancing himself from the bad and claiming only the good, gotcha. I’m a centrist moderate, I believe that there is a healthy dichotomy between conservative and liberal values. You guys don’t adhere more to the constitution than anyone else, you just hate taxes. *Yawn* Also, constitutional economics, which is the only thing that saves constitutionalism from being completely insane when it comes to economic policy, is a form of socialism, you should check out James Buchanan. Other than that, you guys are just quarky blow-hards that pretend to be the biggest patriots ever, but patriotism is the last refuge of a scoundrel.
Take a course in logic. “You might be thinking of CO. That’s the real poisonous stuff coming out of a tailpipe.” That statement in no way negates the poisonous nature of carbon monoxide. I never said CO was there to the exclusion of the other gases, only that is was the real poisonous stuff coming out of a tailpipe. Leave your car running in a garage long enough and carbon monoxide will kill you. Nitrogen and carbon dioxide are not considered as poisonous as CO. And yes, carbon dioxide is considered a life gas. Your reaction to the obvious makes me doubt you are any kind of scientist.
Your other arguments are just ad hominem. As far as what I do for a living, I’m a successful artist. I don’t pretend to be a scientist.
Nothing much to be patriotic about in a nation led by warmongers and made up of many conservatives and liberals alike who are indifferent and apathetic to war. The “queen warmonger” reference was to Hillary in this past election. I’m anti-war. That is the greatest threat to humanity. You have your priorities misplaced.
“That statement in no way negates the poisonous nature of carbon monoxide…. Leave your car running in a garage long enough and carbon monoxide will kill you. Nitrogen and carbon dioxide are not considered as poisonous as CO.”
Who was trying to negate it? My point was that CO2 isn’t something that just gives life, regardless if CO poisoning is bad. All of those gases are going to kill you, including the hydrocarbons and heavy metals, that doesn’t make CO2 harmless or good. It was just an example, don’t get too deep into a tangent.
“And yes, carbon dioxide is considered a life gas.Your reaction to the obvious makes me doubt you are any kind of scientist.”
No, CO2 is not considered “a life gas” just because Paul Driessen called it so, it is a pollutant. It’s not like the mere presence of CO2 is what causes life to spring forth. Nowhere does anyone teach that it is “a life gas”, Driessen should give his BA back. CO2 definitely is a greenhouse gas. Again, as I pointed out, CO2 is not the only thing that plants need to survive, they need other things such as phosphorus and nitrogen. Does that make phosphorus and nitrogen “life molecules”? Not really, no, too much of them are also pollution. Let’s not forget what I said about increased CO2 lowering production of certain chemical defense mechanisms in soybeans and causing increase in the production of phenolics and tannins in some species, as well as many alkaloids, all having potential consequences on the health of primary consumers… and that’s not even the half of it.
“Your other arguments are just ad hominem.”
Uh-hu, copping out because you have no way to respond… pretend to be offended even though you lead off with “For a geologist, you sound kind of ignorant.” It’s alright, I know you don’t know what to say to it so you’d rather just bury your head and pretend I’m somehow harassing you, even though you keep accusing me of not really being a scientist ;)
“Nothing much to be patriotic about in a nation led by warmongers and made up of many conservatives and liberals alike who are indifferent and apathetic to war.”
Pshaw, you’re a constitutionalist… you’re a conservative. A literalist that likely doesn’t understand the constitution was intended to be updated and changed, not taken as biblical word and never revised. What did the late 18th century know about the problems of the early 21st? The founders had the foresight to realize that. Also, liberals aren’t warmongers and are definitely not apathetic to war… you know, with the 1960’s and anti-vietnam movement and all. Where’d you get that crazy notion? They’d much rather pay for schools and science.
“I’m anti-war. That is the greatest threat to humanity. You have your priorities misplaced.”
Sometimes war is necessary, that doesn’t mean it’s good. As a reminder I’m a centrist and for note served in the US Navy. Preaching that war is bad fails to take into account that other humans don’t think that… what are you going to do about them? Paint them a pretty picture? It’s easy to sit on the sidelines and point fingers, it’s much harder to be the one who has to do something about it. Go ahead and mock from the peanut gallery, it’s about all you got anyway.
I think you will enjoy this .
https://www.youtube.com/watch?v=BuqjX4UeBYs&t=8s
https://www.youtube.com/watch?v=BuqjX4UeBYs&t=8s
Why do you keep posting a video of Richard Muller made before he undertook his own study of global temperature, which established that the recent warming was both anomalous and caused by anthropogenic CO2. It is pretty obvious that he was mistaken in his characterization of the hockey stick.
Because Muller goes into detail about the “intent to deceive the public and fellow scientists”..
.
Never retracted those statements , and maintained his position in a later interview on ClimateOne .
.
Muller mistaken ? Write and ask him .Copy us on the reply .
Muller had no way of divining Mann’s intent. This was mere assertion on his part.
Nor have you any evidence that Mann was intending to “deceive the public and fellow scientists”
That purported “intent” has been belied by the fact that there have been more than three dozen paleoclimate reconstructions since 1998. Every one of which is a form of hockey stick.
You seem desperately afraid to acknowledge that Richard Muller, after crunching the numbers himself, now espouses something you have flatly denied: AGW due to CO2.
I checked ,they all are now a W form ,with distinct global MWP and LIA No “shaft” .
.
Dr. Muller is far more qualified than you to state the obvious conclusion of an intent to deceive on Mann et als part .
.
Marcott really showed how false the “blade” of the hockeystick was portrayed ;
http://www.realclimate.org/images//ProxySites_vs_Global1.png
They have emails between Mann’s co-writers on this project discussing how they can “change the data” so that it would fit their predictions. While Mann maintains he was not involved nor part of this it is clear that the main author of an important paper HAD to know what the hell was going on when entire heating and cooling episodes disappeared from the data sets.
Can you explain why you discount any data from physicists that shows no AGW on the grounds that they are not climate scientists and yet are now touting the data supposedly of Richard Muller who is an astrophysicist?
Mann counterfeited his data for one reason – if you showed the correct past data it would make modern changes seem normal. His excuse for doing so was the the Medieval Warm Period and the Maunder Minimum were local events.
Well they weren’t local events. We have both written accounts of conditions even from newspapers worldwide as well as geological, tree ring research and plant stomata research that shows that these events were world wide.
Using both tree ring and ice core to just TEMPERATURE alone, we can tell that the temperatures of the Earth closely match nothing more than the temperature cycles of the Sun. CO2 really has nothing to do with it with levels above about 200-250 ppm.
Marcott actually exposed the scam by posting the actual proxy data comparison from 1880 -2009 . No “blade” .
http://www.realclimate.org/images//ProxySites_vs_Global1.png
Two major ocean reconstructions show the MWP and LIA global events as well .
.
Rosenthal et al 2013 . Oceans 2k 2015 .
Wonder why this isn’t still an active thread…. “loomimg…”
Your graphic proves that the Temperature Anomaly is a fabrication. The Global Mean Temperature was 3 C above the current Global Mean Temp before the 1200s.
Charles, you also have to be aware that yearly temperature variations in MGT without properly assigning them their importance to the climate over long periods is piss poor science as well. This is one of the favorite tricks of the limp left. They are telling us that the Arctic Ice Pack is shrinking. This despite we only have accurate data for 70 years or so. We have no real data on max and min variations over real time.
We can say that a Portuguese ship sailed directly from Japan to Portugal in 1660. Because they did not have any real navigation at that time they had to sail via the Sun’s altitude. That would have been an almost straight line through where the present Arctic ice pack is today. And in 1957 the USS Skate, an early nuclear submarine surface in clear water at the north pole. The following year do did the USS Nautilus. The Skate did so again in the third year though a layer of thin ice.
So the pretense that you can say the slightest thing about the climate by making short term observations or modeling climate that has data so out of whack that it cannot even predict the temperates that had occurred previous to the model being developed demonstrates a pretty feeble minded attempt by environmentalists to scare people into their control.
What utter nonsense and fraud !
.
Dr. Muller of Berkeley called the Hockeystick ” data manipulation and an attempt to deceive the public and fellow scientists in the first minute of this lecture .
.
https://www.youtube.com/watch?v=BuqjX4UeBYs&t=8s
This is what the 20th century (1880 -2009 really looks like in Marcotts supplemental ;
http://www.realclimate.org/images//ProxySites_vs_Global1.png
Another bit of fraud by NASA is to continue changing the scale of the data in order to deceive by changing perception. In the chart of Marcotts you can see that there is nothing more than normal climate chaotic variations. It has warmed a half degree C. This is absolutely normal variations. If you look at: http://www.drroyspencer.com/wp-content/uploads/UAH_LT_1979_thru_March_2017_v6.jpg you can plainly see exactly the same sorts of variations over the last 38 years.
I have observed Mark Steyn’s entire career. He left Canada as the butt of jokes. In the US he took to pandering to the pretensions and prejudices of the American right – and he became rather successful by doing so.
I will admit he has a certain kind of clever, but he’s far from “one of the smartest people in the world”.
I’m guessing he’s seldom one of the smartest people in the room.
Mann claims the data is his intellectual property and it is. The data was contrived to fit his agenda thus he owns it all, the good, the bad and the ugly. Fortunately, the little ice age is recent enough that the data is much more difficult to ignore, so they try to claim it was not “global”.
I hope this lyin Jerkoff loses and has to pay all court costs and the plaintiffS attorneys I hope also that mark styne sues the crap out of this phoney Ahole
The part I find interesting is all scientific data published is subjected to rigorous peer review. This is the modus operandi for all, legitimate science. Obviously Michael Mann believes he has no peers. However, I have yet to see him on the rolls for a Nobel Prize in science. Just another Al Gore fakir, because only through magic could such data be obtained.
Sadly, the source of this is John Sullivan at Principia Scientifica, who has previous on uttering nonsense about the Ball v Mann case. Whilst I would love this to be true, Mann’s lawyer has already said it is nonsense, so don’t hold your breath.
Why won’t Mann release his data and his process? After all, it can’t be very unique since his followers invariably claim that his numbers have been confirmed by dozens of other peer-reviewed studies. Perhaps, at least, some of these supposed confirming studies are willing to release their work papers. (I haven’t seen any referenced. The one I know about, done by McIntire, used many more trees and could not come up with Mann’s numbers.) Once it boils down to statistical machinations with data, McIntyre is the expert, not Mann.
How did Mann conclude that the Medieval Warming period was not global and not as warm as it is now? (He also managed to shrink the LIA temperature bandwidth, making subsequent temperature increases appear even larger.
Why should anybody believe Mann when anyone (even me, an outsider, no climatologist, and no data technician) can refer to peer-reviewed studies and other data which easily show that the MWP was a global event and and that the MWP was very likely warmer than it is now? This obviously refutes Mann’s claim (which rightfully deserve no respect since Mann refuses to reveal his process and data.)
First of all the data from 6,000 boreholes demonstrate that the MWP was a global event. The boreholes were taken around the globe and not constrained to just areas where ice core data is used. Joanne Nova’s website has an educational discussion on the borehole data.
Next, google the Greenland gisp2 temperature study. It shows, among other things, that Greenland was definitely warmer during the MWP than it is now. In Alaska we have a different process, mostly plain old observation. The receding Mendenhall glacier recently exposed a 1,000 year old shattered forest still in its original position. A similar phenomenon in the Alps has exposed a 4,000 year old forest. No trees have grown at that latitude anywhere near either of those sites since. Clearly Alaska was warmer than now during the MWP.
There are also hundreds of peer-reviewed MWP studies. Most, if not all the MWP studies are also cataloged by co2science.org. A subset of these studies directly address temperature. The studies can all be accessed by region at co2science.org. Pick out half a dozen regions remote from one another and from the northern hemisphere (Greenland, Alaska, Europe). Almost every one will show the studied site(s) to have been warmer during the MWP than it is now.
All these studies and observations confirm the borehole data, and the reverse also holds, the borehole data confirms the studies. The exposed Alaskan forest is another type of confirmation. There are also antique vineyards found in Europe at latitudes where grapes cannot be grown today.
Now, suppose, it turns out, that a few of the numerous MWP studies show no temperature increase. So what? The preponderance of data indicates a global event. After all, co2 has been rising since before 1850, and there have been subsequent GLOBAL conflicts showing no warming (as opposed to merely site conflicts in the case of the MWP), and there has also been no additional GLOBAL warming following the 1997/1998 el Nino, at least not until until the 2015/16 el Nino). This would seem to imply that our current global warming has only been “synchronous” for the two decades from 1975 to 1998).
Why are the alarmists even talking about what happened before 1975? Our current warming (such as it is) obviously began, by definition, at the first bottom (the low temperature) experienced during the LIA, so before the mid 1600s. co2 increase began, at the earliest, around 1830. That would indicate two centuries of NATURAL warming before co2 began increasing. Does anybody really believe that this NATURAL warming shut down the instant co2 (a trace gas) began increasing? After all it’s average ANNUAL increase during that period was about 2ppmv per YEAR.
That infitesmal increase would have not been picked up by our thermometers for at lest several decades, if not a century or two. After all, co2 is now at its highest and there’s been no additional warming for the past two decades.
We know the folks depicted in ClimateGate stated that they “had to get rid of the MWP”. Why? Perhaps because their models, since these depend on increasing co2, could not explain away that NATURAL event.
Ian5
“Data is not information…etc.”
You’re quoting Cliff Stoll??? who’s been wrong almost as often as Al Gore??
I’d like to know where this “data ” from hundreds of years comes from. Obviously big heat or cold events would be recorded in different ways but not on a consistent Record
Mann’s refusal to produce his data is plainly unscientific. He hides it because he has something to hide. If his data is bonafide he wins. If it is faulty he loses face. Guess which one it is!
Point 1. Mann did not refuse to produce all his data – that was a lie.
Point 2. Ball has no personal research/study of his own regarding either the LIA or MWP.
Point 3. No less than 36 more recent paleo reconstructions confirm the “blade” of Mann’s original hockey stick.
Point 4. It is Ball who is a proven liar when it comes to his own credentials.
But you haven’t provided any facts, just ridiculous unsubstantiated statements that illustrate your poor understanding of climate research and how it is resourced.
How is it resourced?
Historical Geograper (not a climatologist) Tim Ball’s own analysis of mandatory journal’s kept by HBC Ship Captains, Traders and Factors revealed that climate in the north has warmed since the HBC Nonsuch and Eaglet first sailed into Hudson’s bay, before Fahrenheit invented the 1st standardised scale thermometer.
Despite his own work, and events such as the HBC Baychimo being trapped in Ice and abandoned, Ball found it profitable to accept Fossil Fuel Fundind and deny Climate Change.
The HBC tried to find a way through the northern Canadian ice for centuries, without success.
Now the north opens for safe transit by non ice-strengthend ships like clock work, every August and into September.
The Northern Route along the Russian Coast is nearly open as I write this, while the McClure Parry passage is nearly completely ice free as well. Both those routes will be marine traffic side shows when the Pole melts ice free 3 months a year, within the lifetime of my children.
http://nsidc.org/news/newsroom/arctic-sea-ice-maximum-record-low-third-straight-year
Hey, guys…
I’ve just realised, after much wondering about the attitude, stance and argumentative approach, that Ian5 is probably none other than Michael Mann himself…!
How can Mann possibly be allowed to withhold the data? Makes NO sense. Can someone please explain?
check out this recent study….
http://www.breitbart.com/big-government/2017/08/22/delingpole-global-warming-is-almost-entirely-natural-study-confirms/
A single article in an obscure and shortly-to-be-discontinued journal doesn’t undermine decades and decades of climate science and mountains of evidence generated by multiple, independent lines of science. And Marohasy is a well-known contrarian. Irrelevant really.
you’re brainwashed. look at the DATA.
There is NO sign of runaway warming with 3x amplification from water vapor. If you double the CO2, there is about a 0.6 to 1 deg C rise. This all the data shows — about a 0.6 deg C rise since the 1970’s. Some of this rise is probably due to natural causes. You’d have to double CO2 again to get at best another 0.6 deg C, but we’d have to wait another 50 years to establish that. Anyone who relies on numerical models to predict global temperatures is either stupid or crazy.
“Anyone who relies on numerical models to predict global temperatures is either stupid or crazy.”
Yet your extreme position is diametrically opposed to the positions of NASA, NOAA, British Atmospheric Data Centre, Environment Canada, IPCC, National Academy of Sciences, American Meteorological Society, American Geophysical Union and virtually every US and international scientific academy. Fantasy world you live in.
So what? NONE of these model “predictions” have matched the actual future data over the past 35 years. The IPCC keeps “modifying” it’s future model “predictions”.
can someone explain why this does not show much warming?
http://www.drroyspencer.com/latest-global-temperatures/
this Australian study shows that current warming is well within norms…
http://www.breitbart.com/big-government/2017/08/22/delingpole-global-warming-is-almost-entirely-natural-study-confirms/
A vast number of “studies” were poorly constructed and cannot be replicated. The conclusions drawn far exceed any rationale.
Peer reviewed now means ” have my best friend take a look”. Tsk tsk!
Way back at the beginning of this debate, Mann and others immediately withheld from McIntyre and others the data used to draw their conclusions. A scientist worthy of the name would have done the opposite. He hid something because he had something to hide! This fact permeates Mann’s credibility forever. Now you know!
As a scientist funded by numerous government agencies, there is an absolute mandate for data sharing once data is published, unless a company has been formed and IP has been filed for. Not sure how Mann can prevent data sharing? No IP has been filed. That much is clear. Once published, no more IP protection, unless he filed it before publishing, but there is no record of his having filed with the USPTO? Copyrights do not count. You still need to share the data. Everyone knows this, so what gives?
How is this court going to rule against Michael Mann and global warming when the Canadian government has basically said global warming is real? We may just be waiting forever for this decision.
Michael Mann has been evasive with emails and information for years. Science is supposed to be open and pure. If there is nothing to hide, why doesn’t he hand over the emails? Why doesn’t he reveal his codes for the statistical analysis that led to the Hockey stick?
Considering the ramifications in terms of climate policy-TRILLIONS invested or wasted and the very future of our energy based civilization itself, you would think that it would be prudent to have this information, especially as it was paid for by the taxpayers, who will also be ultimately made to pay for “climate action.” Pretty insane to gamble our entire civilization on trust alone.
We should be getting very suspicious about this hiding of crucial information. Only those with something to hide will be so evasive.
Even more alarming is the way Mann is trying to crush free speech with a SLAPP action. Those who fear some painful truth getting out do this sort of thing. Perhaps Mann needs to be sued for his attempts to gag free speech.
Personally, I would love to see the day that the climate lies are exposed for the horrendous fraud they are and those that have perpetrated the lies and those (eg the UN) that back the lies by refusing to debate the issue are punished according to the extent of the damage caused. Now, lets see- TRILLIONS going to the UN and attempt to destroy our energy based civilization along with BILLIONS of lives. Time to devise some punishments that suit the crime. Guy Fawkes was “only” trying to blow up the Houses of Parliament and met a very grisly demise as a result.The crimes against all of humanity in the case of the climate scam are vastly worse than Guy Fawkes’ crime.
The bigger issue here is that even if C02 is rising, is it hurting? I argue not because C02 was very low to begin with and we’re actually seeing the planet green due to its increase.
Greenpeace co-founder Patrick Moore has stated that C02 is helping our planet:
“All life is carbon-based and the primary source of this carbon is the CO2 in the global atmosphere,” Mr. Moore said in his executive summary. “As recently as 18,000 years ago, at the height of the most recent major glaciation, CO2 dipped to its lowest level in recorded history at 180 ppm, low enough to stunt plant growth.”
The “bigger issue” is that the shockingly rapid rise in CO2 is absolutely hurting, and will absolutely cause widespread misery if it continues. The rate of rise of CO2 in the atmosphere is astoundingly rapid in historical terms, and the resulting rate of change of global temperature is, and will be, profoundly disruptive to ecosystems and human civilization. That the excess of CO2 in the atmosphere is now rapidly changing the pH of the oceans is more reason to be alarmed.
Here is a discussion of the likely results of rapid global warming. It is NOT a salutary scenario:
https://en.wikipedia.org/wiki/Effects_of_global_warming
Greenpeace “co-founder” Patrick Moore has stated that CO2 is helping our planet. This is the same Patrick Moore of whom Greenpeace says this:
“Moore’s claims run from the exaggerated to the outrageous to the downright false, including that “clear-cutting is good for forests” and Three Mile Island was actually “a success story” because the radiation from the partially melted core was contained. That is akin to saying “my car crash was a success because I only cracked my skull and didn’t die.””
**********************************************
Duly noted that you upvoted your own comment. It looks like you upvote every one of your Disqus comments. You should know that upvoting your own comments is considered a sign of intellectual weakness. Just thought someone should tell you…
Actually, clear-cutting is good for forests. Unless you advocate wildfires, it is the next best thing. Of course they dispute his claims, he is calling them on their BS.
You say “shockingly rapid rise in CO2 is absolutely hurting”. What is it hurting? The Earth, plants and animals or people that live close to sea level? If the latter, that would be on them, no?
The shockingly rapid rise in CO2 is hurting the Earth, plants and animals, and people wherever they live. The rapid global warming that is attendant with the rise in greenhouse gases is contributing strongly to the “sixth great extinction” of floral and faunal species, and so is diminishing the biodiversity that all ecosystems depend on.
Most plant and animal species cannot adapt fast enough to the rate of temperature increase that humans have unleashed. The golden toad (bufo periglenes) has already gone extinct due to climate change, as has the white lemuroid possum. Other species already impacted adversely are the orange-spotted filefish, the quiver tree, the polar bear, the snow leopard, the Adelie penguin, the North Atlantic cod, and corals such as acropora cervicornis, among many others.
https://news.nationalgeographic.com/news/2014/03/140331-global-warming-climate-change-ipcc-animals-science-environment/#close
Ocean acidification is already a direct threat to many calcifying marine species, including some that are directly economically important to humans such as oysters, mussels and clams.
As far as “people that live close to sea level” (sic), human civilization has evolved to where on the order of half of humanity lives within 60 miles of the seacoast. This evolution has occurred over centuries, for obvious and completely rational reasons, well before the threat of rising seas became widely known. To posit that the threat (that you refuse to acknowledge) is “on them” is to display an appalling ignorance and lack of empathy. The threat to them, of flooding, salinization of soils, etc., ends up hurting everyone, not just those who lose their homes and belongings.
Did I mention appalling ignorance? Your appalling ignorance, masquerading as smug superiority, is repugnant. Actually, clear-cutting is NOT good for forests. The claim that clear-cutting is good for forests is absurd on its face; the obliteration of no living thing is “good for” that thing. Clear-cutting is arguably good for the forestry industry, but it is certainly NOT good for the forest. Forests are not just stands of trees. They are ecosystems that constitute communities of interdependent species. They are shelters and habitats and food sources. They are watersheds. They are soil builders. They are carbon sinks that help keep the carbon cycle balanced. When a forest is clear-cut, the forest is ruined; and all those ecosystem services are lost or damaged.
How is it shockingly rapid? It is actually paused.
How is it hurting the Earth, plants and animals in any way that past FAR MORE extreme past natural shifts have not?
How can it be hurting plants when it is actually contributing to “greening” of the Earth in many previously barren areas?
How do we have too much CO2 when we are not even at optimum levels yet and are actually far from them?
Explain how this is “man made” when climate scientists have no quantification of what part man has even played as to percentages of warming.
Hasn’t rapid change happened many times in the past that was not caused by man and that plants and animals could not rapidly adapt to? Aren’t we still here despite that?
Ocean acidification is not related to climate change, it is related to pollution and acid rain. An appalling amount of that comes from the 3rd world countries and not the U.S. Why are you not protesting overseas?
Your justification that “people that live close to sea level” are somehow anyone’s responsibility , but their own is laughable. There has ALWAYS been flooding and extreme weather associated with that geography and people live their by choice. They can move by choice as well.
“well before the threat of rising seas became widely known” is a partial lie. The sea levels have always risen and fallen over time. The only reason they were not “widely known” is due to a historical lack of mass media on demand, not climate change.
You err in confusing a lack of agreement with ignorance. That is ALWAYS the argument used by someone with poor factual evidence.
As for empathy, why should I feel bad for someone that has enjoyed all the benefits of living near the sea for lifetimes and generations. Do they come shovel the snow here in Michigan for me? They chose to where to live, it’s called “freedom”. With all those benefits comes “responsibilities” and “consequences”.
Again your assertions that I suffer from “appalling ignorance”, “smugness” “lack of empathy” and “superiority” are the assertions of a weak argument and represent nothing factual. All throughout time climate change has happened, yet you would have us believe that we are somehow more powerful than the earth and HAVE CAUSED it to happen in the blink of a chronological eye? That is what certainly qualifies you as having all the moniker’s you applied to me!
Another sign of a weak argument is misrepresentation of facts which you engage in mightily. You attribute to me the assertion that I imply “The claim that clear-cutting is good for forests is absurd on its face”. What a huge misrepresentation you make! I actually said that wildfires perform the NATURAL and far better function that clear cutting now substitutes as the “next best thing” for. This is where your ENTIRE ARGUMENT FALLS APART! If you had the courage of your convictions, you would be advocating for UNCONTROLLED WILDFIRES in the entire united states. Wildfires are nature’s renewal method and are INCREDIBLY BENEFICIAL to the ecosystem. Unfortunately for some, that means their homes have to burn to the ground, but your all for that right because the benefit to nature far outweighs the detriment to people that “lose their homes and belongings”? You pontificate about ecosystems and their importance and KNOW that woodland fires are a huge regeneration method. These are facts, unlike whether man is the main driver of climate change. Instead of advocating for a PROVEN method of regeneration ecosystems, you prefer to bully people over controversial and unsettled science.
You lack a historical perspective and are a blind follower. In the 70’s we were told by the “expert climate scientists” that we’d be in an ice age by now. Are we? Do you think computers have made climate scientists smarter? They were arrogant and wrong then and are no different now. If you chose to blindly follow, do so at your own expense and detriment. I prefer to use logic, reason and facts of which, you are in short supply.
Michael Mann, your self-proclaimed Deity of climate science is being held in contempt of court by the British Columbia Supreme Court because he refuses to disclose the research that led up to his much acclaimed “hockey stick” model for rising CO2. His refusal comes in a SLAPP suit he brought against someone that asserted his science was bunk. Why on Earth would one of your and Al Gore’s heros not want his research exposed to the light? Because his research and data wILL NOT substantiate his claims. Claims you, and millions of sheeple like you, blindly follow.
Wow – that gish gallop recapitulates most of the denier falsehoods out there – congratulations!
I propose that we calibrate your credibility based on this claim:
“Michael Mann, your self-proclaimed Deity of climate science is being held in contempt of court by the British Columbia Supreme Court because he refuses to disclose the research that led up to his much acclaimed “hockey stick” model for rising CO2.”
Never mind that the “self-proclaimed Deity” part is Trumpian falsehood; if you can cite any proof of this claim, I will attempt to take the rest of your diatribe seriously. If you cannot cite any proof of this claim, then I will hold that factual error as representative of the falsity of the rest of the details in your comment.
Global warming pause? No way:
http://www.woodfortrees.org/plot/uah6/from:1979/to:2017/plot/uah6/from:1979/to:2017/trend
Note that the UAH satellite record is the most “conservative” of the existing datasets, and it shows an increase of 0.5 deg C over the last 38 years.
You are LYING about a “pause” – the facts say otherwise.
Is 10 to 15 degrees C of temp rise per millennium “rapid” in geological history? Absolutely!
https://earthobservatory.nasa.gov/Features/GlobalWarming/page3.php
“As the Earth moved out of ice ages over the past million years, the global temperature rose a total of 4 to 7 degrees Celsius over about 5,000 years. In the past century alone, the temperature has climbed 0.7 degrees Celsius, roughly ten times faster than the average rate of ice-age-recovery warming.”
“Models predict that Earth will warm between 2 and 6 degrees Celsius in the next century. When global warming has happened at various times in the past two million years, it has taken the planet about 5,000 years to warm 5 degrees. The predicted rate of warming for the next century is at least 20 times faster. THIS RATE OF CHANGE IS EXTREMELY UNUSUAL.” (My emphasis)
You are LYING about “past FAR MORE extreme past (sic) natural shifts..” The facts say otherwise.
“How do we have too much CO2 when we are not even at optimum levels yet and are actually far from them?”
No one claims we have “too much CO2”; the factual claim is that the RATE OF CHANGE of the CO2 fraction is too high, causing global warming that is too rapid for ecosystems to adapt to without serious disruptions. Do you not understand the difference between the amount, and the rate of change of the amount? Nod your head if you understand the difference..
“Ocean acidification is not related to climate change, it is related to pollution and acid rain.” Nonsense, pure and simple. Here ya go, a basic discussion of how we know that you are LYING about the causes of ocean acidification:
https://en.wikipedia.org/wiki/Ocean_acidification
“If we continue emitting CO2 at the same rate, by 2100 ocean acidity will increase by about 150 percent, a rate that has not been experienced for at least 400,000 years.”
You are LYING about ocean acidification – the facts say otherwise.
Maybe I am mistaking LYING for mere appalling ignorance. Maybe it’s both. But all the things you accuse me of “lack of historical perspective”, “poor factual evidence”, etc., are pretty much classical projection:
https://en.wikipedia.org/wiki/Psychological_projection
Bottom line: you are wrong (intentionally or otherwise) in almost every particular. Talk about “poor factual evidence”!!
Show me proof that Michael Mann is being held in contempt of court; if you can’t show me the proof, then that shows how credible all your other invented and ridiculous assertions aren’t… Go for it.
Well stated.
Yep. I will echo that. Nicely articulated Treeparty. Good onya for taking on this shitbag.
“Is 10 to 15 degrees C of temp rise per millennium “rapid” in geological history? Absolutely!”
So we’ve had temp increases of 50 to 75 degrees farenheit in 1000 years? That is quite a claim there buddy. Fascinating that a person that makes that claim would call MY CREDIBILITY into question.
As for your evasions regarding Mann: http://dailycaller.com/2010/06/30/michael-mann-says-hockey-stick-should-not-have-become-climate-change-icon/.
“The graph was used by Al Gore in his film “An Inconvenient Truth” and was cited by the United Nations body the Intergovernmental Panel on Climate Change (IPCC) as evidence of the link between fossil fuel use and global warming.”
Yeah, only the IPCC used it. No one listens to them except—-all of you tree hugging liars.
So; no proof of your false claim that Mann is being held in contempt of court? Right – more lies from the lying liar. You are wrong in almost every particular; and when called upon to provide support or evidence for your assertions, you cannot. Duly noted.
A 1 to 1.5 deg. C rise in temp in a century is the same rate of change as 10 to 15 deg. C per ten centuries, otherwise known as a millennium. That is the rate of change we are currently undergoing; and, as noted by actual scientists, it is extremely unusual in the planet’s history. Just the facts; citation already provided. You should work on your reading comprehension…(Not to mention your third grade arithmetic.)
Here’s a helpful tip for you; getting your climate science from Daily Caller is like getting your physics from a Roadrunner cartoon. Michael Mann’s graph has been repeatedly corroborated by multiple studies. Here are several links to confirm this assertion:
https://en.wikipedia.org/wiki/Hockey_stick_graph
https://www.skepticalscience.com/broken-hockey-stick.htm
https://www.theatlantic.com/technology/archive/2013/05/the-hockey-stick-the-most-controversial-chart-in-science-explained/275753/
And still waiting for you to cite any evidence that Michael Mann
“is being held in contempt of court.”…
http://www.climatedepot.com/2017/07/05/fatal-courtroom-act-ruins-michael-hockey-stick-mann/
“1 to 1.5 deg. C rise in temp in a century is the same rate of change as 10 to 15 deg. C per ten centuries”
ROFLMAFAO! Unless it doesn’t actually happen fool, and it hasn’t happened.
And I love the way you are manipulating the date just like NOAA and NASA do. What a good follower you are!
The 1.0 to 1.5 deg. C rise in temp HAS ALREADY HAPPENED, fool.
http://www.woodfortrees.org/plot/gistemp/from:1917/to:2017/plot/gistemp/from:1917/to:2017/trend
And still waiting for you to cite any evidence that Michael Mann
“is being held in contempt of court.”…
The article you linked was excerpted from an OPINION piece by Ball’s FAKE LAWYER, John O’Sullivan. It is not evidence of anything except John O’Sullivan’s usual prevarication.
OPINION- “a belief or judgment that rests on grounds insufficient to produce complete certainty.”
This is nothing more than the opinion of Ball’s counsel, who should be expected to be prejudiced against the plaintiff, Mann. The “judgment” on display IS NOT the judgement of the B.C court.
I would not believe John O’Sullivan if he told me my head was connected to my body:
http://hot-topic.co.nz/so-many-lies-and-the-liar-who-tells-them/
and
https://www.desmogblog.com/john-o-sullivan
and
http://www.aaskolnick.com/global_deniers/website.htm
You should be a lot more analytical in deciding what and whom to believe, and try to stick to facts to make a case instead of clearly biased opinions.
“The 1.0 to 1.5 deg. C rise in temp HAS ALREADY HAPPENED, fool.”
The “fool” would be the one acting like they know what’s going to happen for the next 900 years.
You conveniently forget that:
1. According to climate scientitsts we should be in an ice age now, but instead you’re talking about temperature increase.
2. You guys have had to “adjust” all your data to comply with your fantasy allegations of man being the true driver of climate change. You could be using satellite data like we did for decades, but you cannot manipulate that as you wish, can you?
No, the “fool” would be the one who thinks that the trajectory that we are already on, which is known to be dangerous, can be safely ignored because…[fill in the blank]. There are people being born TODAY who will be alive in 2100; and if the world is 3 deg. C (or more!) hotter then than it is now, with all the attendant misery that will surely visit on them, they will have fools like you to blame.
Still with the false, unsupportable claims I see. Can you cite any evidence that “according to climate scientists we should be in an ice age now”?! Bring that along with the evidence that Michael Mann is being held in contempt of court, will ya?
http://www.denisdutton.com/newsweek_coolingworld.pdf
https://skepticalscience.com/ice-age-predictions-in-1970s-intermediate.htm
Here is one from 1896 talking about GLOBAL WARMING you moron: http://www.rsc.org/images/Arrhenius1896_tcm18-173546.pdf
So: not a single citation from ANY climate scientist that “we should be in an ice age now”.
Thank you for making my point, that you have been making stuff up. This from the skeptical science article that YOU LINKED:
“Summary
So global cooling predictions in the 70s amounted to media and a handful of peer reviewed studies. The small number of papers predicting cooling were outweighed by a much greater number of papers predicting global warming due to the warming effect of rising CO2. Today, an avalanche of peer reviewed studies and overwhelming scientific consensus endorse man-made global warming.”
And an update on the old Newsweek story:
https://www.insidescience.org/news/my-1975-cooling-world-story-doesnt-make-todays-climate-scientists-wrong
Don’t you get tired of just making $#!+ up, and being shown to be a liar?!
“The “97 percent” statistic first appeared prominently in a 2009 study by University of Illinois master’s student Kendall Zimmerman and her adviser, Peter Doran. Based on a two-question online survey, Zimmerman and Doran concluded that “the debate on the authenticity of global warming and the role played by human activity is largely nonexistent among those who understand the nuances and scientific bases of long-term climate processes” — even though only 5 percent of respondents, or about 160 scientists, were climate scientists. In fact, the “97 percent” statistic was drawn from an even smaller subset: the 79 respondents who were both self-reported climate scientists and had “published more than 50% of their recent peer-reviewed papers on the subject of climate change.” These 77 scientists agreed that global temperatures had generally risen since 1800, and that human activity is a “significant contributing factor.”
Read more at: http://www.nationalreview.com/article/425232/climate-change-no-its-not-97-percent-consensus-ian-tuttle
“Surely the most suspicious “97 percent” study was conducted in 2013 by Australian scientist John Cook — author of the 2011 book Climate Change Denial: Heads in the Sand and creator of the blog Skeptical Science (subtitle: “Getting skeptical about global warming skepticism.”). In an analysis of 12,000 abstracts, he found “a 97% consensus among papers taking a position on the cause of global warming in the peer-reviewed literature that humans are responsible.” “Among papers taking a position” is a significant qualifier: Only 34 percent of the papers Cook examined expressed any opinion about anthropogenic climate change at all. Since 33 percent appeared to endorse anthropogenic climate change, he divided 33 by 34 and — voilà — 97 percent! When David Legates, a University of Delaware professor who formerly headed the university’s Center for Climatic Research, recreated Cook’s study, he found that “only 41 papers — 0.3 percent of all 11,944 abstracts or 1.0 percent of the 4,014 expressing an opinion, and not 97.1 percent,” endorsed what Cook claimed. Several scientists whose papers were included in Cook’s initial sample also protested that they had been misinterpreted. “Significant questions about anthropogenic influences on climate remain,” Legates concluded.”
Read more at: http://www.nationalreview.com/article/425232/climate-change-no-its-not-97-percent-consensus-ian-tuttle
“A 2012 poll of American Meteorological Society members also reported a diversity of opinion. Of the 1,862 members who responded (a quarter of the organization), 59 percent stated that human activity was the primary cause of global warming, and 11 percent attributed the phenomenon to human activity and natural causes in about equal measure, while just under a quarter (23 percent) said enough is not yet known to make any determination. Seventy-six percent said that warming over the next century would be “very” or “somewhat” harmful, but of those, only 22 percent thought that “all” or a “large” amount of the harm could be prevented “through mitigation and adaptation measures.” And according to a study of 1,868 scientists working in climate-related fields, conducted just this year by the PBL Netherlands Environment Assessment Agency, three in ten respondents said that less than half of global warming since 1951 could be attributed to human activity, or that they did not know. Given the politics of modern academia and the scientific community, it’s not unlikely that most scientists involved in climate-related studies believe in anthropogenic global warming, and likely believe, too, that it presents a problem. However, there is no consensus approaching 97 percent. A vigorous, vocal minority exists. The science is far from settled.”
Read more at: http://www.nationalreview.com/article/425232/climate-change-no-its-not-97-percent-consensus-ian-tuttle
There is actually CGI now that imitates human beings BETTER than Ted Cruz does.
Ted Cruiz lied about satellite data.
https://youtu.be/WX7aWsxe9yw
http://www.petitionproject.org/
31,487 American scientists have signed this petition,
including 9,029 with PhDs. They deny any evidence exists of a man made component to “climate change”.
Do you have a PhD?
You should be a lot more analytical in deciding what and whom to believe, and try to stick to facts to make a case instead of clearly biased opinions.
https://www.snopes.com/30000-scientists-reject-climate-change/
and
https://en.wikipedia.org/wiki/Oregon_Petition
Whether I have a PhD is completely irrelevant to AGW.
And still no evidence for your bogus claim that “Michael Mann is being held in contempt of court”?
I feel a deep sense of disgust with your ethos.
Luckily people like you are a tiny minority and always will be.
Ignorant arsewipe.
Li D
Townsville,
Australia
And yet, you dispute nothing that I wrote as being true. Wildfires ARE GOOD for the environment. Arsewipes are the ones advocating fighting against nature instead of working with it.
Patrick Moore has NO EDUCATIONAL QUALIFICATIONS TO PONTIFICATE ON CO2
.
“Patrick Moore : Dallas County Community College District
https://www.dcccd.edu/cd/dcc/acad/gov/faculty/pages/pmoore.aspx
Richland College Patrick Moore earned a bachelor’s degree in economics and a minor in finance and a master’s degree in political economy from the University of Texas at Dallas.”
..
“Police: Carbon dioxide led to death in McDonald’s bathroom
September 14, 2011 1:38 p.m. EDT
STORY HIGHLIGHTS
The carbon dioxide built up to toxic levels in the bathroom
An 80-year-old woman died after the incident September 7
lethal dose of carbon dioxide, authorities said Wednesday….”
***
*
“What is the LD50 value of carbon dioxide?
.
The LC50 (Lethal Concentration which kills 50% of the exposed animals in 1 hour)
is 4% for rats and 10% for humans.
.
CO2 is heavier than air, so the concentration near the floor (lower levels)
will be much higher,” as well as protected glades, basements and sealed rooms.
Higher Concentrations of CO2 in the Atmosphere increases incidents of
threatening concentrations at ground levels and basements.
***
“One person, recounting the fate of eight men and one woman who walked
into a basement area where the gas had accumulated, said they “fell down DEAD
as if they had been shot.”
..
How is Sick Building Syndrome is NOW Exacerbated by Higher Atmospheric CO2 Levels
Brian Donovan, Chief Scientist at McVan Aerospace. (2004-present)
How is Sick Building Syndrome Exacerbated by Higher Atmospheric CO2 Levels?
High CO2 levels have destroyed fresh air and increased the
aches and fatigue of billions of people while impairing our brain functions.
HVAC, (Heating, ventilation, and air conditioning) engineers
consider 800 ppm indoor a sign of severe under ventilation
and complaints of fatigue and aches seriously start at around 600 ppm.
CO2 is one of the most common causes of Sick building syndrome.
Supporting Information Lawrence Berkeley National Laboratory,
This Indoor Air Quality (IAQ) Scientific Findings Resource Bank.
“ In studies performed in Hungary [99], subjects’ performance in proof reading
tests, but not other tests, were significantly diminished with 4000 ppm
and 3000 ppm CO2, relative to 600 ppm CO2.
Subjects’ levels of satisfaction with indoor air quality also diminished
as the CO2 concentration increased.
In the first U.S. study [100],
each subject completed tests of decision making performance with CO2
concentrations of 600, 1000, and 2500 ppm.
Carbon dioxide was increased above the baseline level of 600 ppm
by injecting ultrapure CO2.
The subjects’ performance on most measures of decision making performance
was moderately and statistically significantly diminished at 1000 ppm CO2,
relative to 600 ppm CO2. At 2500 ppm CO2,
relative to 600 ppm, the subjects’ performance
on most measures of decision making performance was
highly and statistically significantly diminished.
In a second study from the U.S. [13],
a test of decision making performance was again used to assess
subjects’ levels of cognitive performance.
On average, scores on the various measures of cognitive performance
decreased by about 15% with 945 ppm CO2 relative to 550 ppm CO2.
With 1400 ppm CO2 relative to 550 ppm CO2, on average scores decreased by 50%.
“
This is very hard for many people to believe or care about.
They mention submariners:
we aren’t all healthy young men in a war machine
trained to ignore pain and discomfort.
It’s irrelevant.
The fatal concentration for CO2 is 50,000 ppm,
so we’ll live,
we’ll just suffer more and forget what fresh air was like.
It’s worth it to help those poor coal mine owners, right?
It was hard enough to get under 600 ppm with outdoor air at 280 ppm,
when the air outside is at 600ppm it’s technically impossible.
Now even in the country we are over 450 ppm.
I have a CO2 meter in the house is it’s regularly going over 600ppm,
and I have to open window to get to 470 ppm or so.
In cities typical daily ppm are over 1000 ppm. indoors
typical schools and offices go over 2000 ppm.
We have destroyed fresh air.
Humans evolved with co2 never going over 300 ppm.
Humans have never seen 400 ppm co2,
and
we are very sensitive the CO2 levels.
This is a bad experiment.
We have the highest co2 in 3–15 million years.
We can go massively CO2 negative with solar, wind, and hydrocarbons
from wastes as a backup and replacement for fossils in long haul,
military, reserve generators, and chemical feed stocks.
Solar and wind are available cheaper now,
((Thanks to Competition FROM Solar, Wind, Nat.Gas
…Electric Rates have fallen 1%, enabled by the Obama Administration))
.
((Texas is the big winner with the most wind & solar…Electric Rates
are down by double digits in competitive markets))
.
it’s been the majority of new power installs for the last 5 years,
Solar and wind Electric has doubled ever 2 and 4 years for the last 30 years or so,
and prices to build and prices for the electric generated has Fallen dramatically.
YOU claim CO2 was LOW to begin with….upon what basis do YOU make that determination.
HUMAN’S and Nearly Every Animal & Plant on earth have
NEVER EXISTED WITH ATMOSPHERIC GASES AT THIS LEVEL
….let alone where your advocacy of CO2 WILL BE LEADING US ! ! ! !
UPON WHAT SKILL SET ARE YOU PONTIFICATING SAINT HOOD FOR CO2
You quote:
“As recently as 18,000 years ago, at the height of the most recent major
glaciation, CO2 dipped to its lowest level in recorded history at 180
ppm, low enough to stunt plant growth.”
In the middle of the last glaciation,
where ice has disposed of most animal & plant life on earth….CO2 dipped……
and yet,
HERE WE IS, big mamma !
You have proved that the ” GOLDI-LOCKS LEVEL ”
for CO2 is between 180PPM to 280PPM
.
again I ASK,
.
UPON WHAT SKILL SET ARE YOU PONTIFICATING SAINT HOOD for CO2
Low for optimum plant growth. Why are you villainizing CO2? It’s like villainizing coal because it’s carbon.
There is a FAR BETTER scientific basis for global warming/cooling to be driven by solar activity than CO2, but most hysterical global warmists deny that is even possible.
“WITHERING AND DYING” as you state IS a far cry from
“low for optimum growth”.
I just explained why I am critical of YOUR UNBRIDLED ENTHUSIASM for the unprecedented INCREASE IN CO2.
.and NO, there is NOT a far better case for solar heating…
IF THE SUN IS RESPONSIBLE for Earth’s warming….explain why the Earth has been warming for the last half century while
the sun has largely remains static or a very tiny decrease in solar radiation.
add to that, the last (11 yr avg.) solar minimum…during which temps rose….2007-2009
LOOK:
http://berkeleyearth.org/wp-content/uploads/2015/03/land-and-ocean-sea-ice-comparison-large.png
IF THE SUN IS RESPONSIBLE for Earth’s warming….explain
how it is even possible for the TROPOSPHERE to be WARMING
while the MUCH, MUCH LARGER STRATOSPHERE, closer to the sun, vastly larger surface area has been COOLING ???
Dinosaurs existed with 5 times the CO2 we have now. When there were dinosaurs, there were plants.
YES !
Might I remind you that you are not a dinosaur….
It took hundred of thousands of years for the dinosaur to adapt and evolve to those levels.
We have 800,000 years of records, detailed and remarkably accurate.
…HUMANS and ALL of Our immediate ancestors have NEVER lived at atmospheric gas levels that we have today..
….
let alone
at the levels you and your ILK are actively advocating.
…with no scientific basis for such advocacy
1.
other than to PAD the bank accounts of the FOSSIL FUEL BILLIONAIRES.
…and
2.
to MAINTAIN Their unseemly CONTROL and POWER that they exercise.
NO HUMAN BEINGS
and
NEARLY NO ANIMAL & PLANT LIFE ON EARTH have ever existed at levels comparable to the dinosaurs.
I disagree on the plant life assertion and humans just were not around yet.
It is not a matter of ‘disagree’ing….it is a science fact.
Humans & Current ANIMAL & PLANT life on Earth, could not survive the levels of gasses in the atmosphere of the dinosaurs.
Because you are a dinosaur expert?
You really are a thicko LIAR.
Modern commercial greenhouses pump in plant food CO2 at ~ 1200 ppmv, where plants thrive. There are NO ADVERSE EFFECTS FOR HUMANS.
CO2 before 70 million years ago ~ 340ppmv. Dinosaurs thrived:
http://www.biocab.org/Geological_Timescale.jpg
NEVER ANY CORRELATION CO2 & TEMPS, LIAR. :)
RE: Greenhouses.
YOU DON’T live in a greenhouse. Hours of exposure with CO2 at those heights is STRICTLY CONTROLLED.
.
“What is the LD50 value of carbon dioxide?
.
The LC50
(Lethal Concentration which kills 50% of the exposed animals in 1 hour)
.
is 4% for rats and 10% for humans.
BUT
** CO2 is heavier than air,
so the concentration near the floor will be much higher,”
MORE SO
in protected glades,
basements & sealed rooms.
.
Higher Concentrations of CO2 in the Atmosphere
DRAMATICALLY increases incidents of threatening concentrations at ground levels & basements.
“One person,
recounting the fate of 8 men and 1 woman who walked
into a basement area where the gas had accumulated,
said they “fell down DEAD as if they had been shot.”
**
*
* * It does not matter! !
what occurred millions of years ago !
.
The only reason you know what happened back then
(this graph for example)
is supplied to you & taught to you BY SCIENCE.
SCIENCE
is telling you that in this era, this is different !
.
PAY ATTENTION !
.
Over hundreds Millions of years,
*** the milankovitch cycles,
were the movers and shakers of CLIMATE CHAGES.
.
CO2 and Other Greenhouse gases lagged behind because those CYCLES created, increased & reduced Greenhouse gases.
.
IN FACT,
THIS Holocene Era was controlled by those same cycles.
….
1. Earth’s Orbit is still pulling the earth away from the Sun
(( causing glaciation ))
2. Earth’s Axial Tilt is still moving away from the SUN
(( causing glaciation ))
.
WHILE THAT TREND continues,
…..Earth’s temperatures
(which have been falling for 8000 years)
……….linked directly to those milankovitch cycles..
.
STOPPED FALLING in the 1700’s.
. LOOK:
. http://www.realclimate.org/images//Marcott.png
***
“….
https://www.livescience.com › Planet Earth
Mar 24, 2014 – Researchers say dinosaurs that roamed Earth 250 million years ago had to endure a smoggy atmosphere with five times more carbon dioxide than is present on Earth today….much warmer temperatures too …”
http://www.iloveco2.com
your reference….an extreme right wing opinion blog
and not a legit. scientist in sight !
.
WHAT A JOKE !
.
CO2 is a pollutant: The Worst Climate Pollution Is Carbon Dioxide – Scientific American
https://www.scientificamerican.com/…/the-worst-climate-pollution-is-carbon-dioxide/
.
Nov 4, 2014 – CO2 outranks soot, methane and even hydrofluorocarbons in terms of long-term global warming. … Cutting emissions of such “short-lived climate pollutants,” or SLCPs, will not have much impact on long-term climate change, finds a new study published yesterday in the Proceedings of the National …
.
CO2 is a POISON: Carbon dioxide (CO2) is a toxic gas at high concentration, as well as an asphyxiant gas (due to reduction in oxygen). Irritation of the eyes, nose and throat occurs only at high concentrations. The concentration thresholds for health effects are outlined in the table. Health effects of respiratory exposure to carbon dioxide
.
CO2: is an noun
noun: asphyxiation
the state or process of being deprived of oxygen, which can result in unconsciousness or death; suffocation.
“the cause of death was asphyxiation”
>>>
People also ask:
How much carbon dioxide can kill you?
.
Is carbon dioxide harmful to humans?
Carbon dioxide (CO2) is a toxic gas at high concentration, as well as an asphyxiant gas (due to reduction in oxygen). Irritation of the eyes, nose and throat occurs only at high concentrations. The concentration thresholds for health effects are outlined in the table.
Carbon Dioxide (CO2) – IVHHN
http://www.ivhhn.org/index.php?option=com_content&view=article&id=84
Search for: Is carbon dioxide harmful to humans?
….
“… In the C3 crops … they found significant declines in zinc and iron.
The largest was a 9.3 percent drop in the zinc level in wheat. …
“Crops are losing nutrients as CO2is going up.”May 9, 2014
High CO2 Makes Crops Less Nutritious | Nat Geo Food – Latest Stories
https://news.nationalgeographic.com/…/140507-crops-nutrition-climate-change-carbon-…
***
Carbon Dioxide May Rob Crops Of Nutrition, Leaving Millions At Risk …
https://www.npr.org/…/carbon-dioxide-may-rob-crops-of-nutrition-leaving-millions-at-r…
Aug 2, 2017 – Rising carbon dioxide levels could have an unexpected side effect on food crops:
a decrease in key nutrients.
… A 2014 study showed that higher levels of carbon dioxide in the atmosphere are likely to put a dent in the protein, iron and zinc content of rice, wheat, peas and other food crops.
CO2 is plant food, CNUT. :)
http://www.ivhhn.org/index.php?opt...
Search for: Is carbon dioxide harmful to humans?
….
“… In the C3 crops … they found significant declines in zinc and iron.
The largest was a 9.3 percent drop in the zinc level in wheat. …
“Crops are losing nutrients as CO2is going up.”May 9, 2014
High CO2 Makes Crops Less Nutritious | Nat Geo Food – Latest Stories
https://news.nationalgeogra……
***
Carbon Dioxide May Rob Crops Of Nutrition, Leaving Millions At Risk …
https://www.npr.org/…/car……
Aug 2, 2017 – Rising carbon dioxide levels could have an unexpected side effect on food crops:
a decrease in key nutrients.
… A 2014 study showed that higher levels of carbon dioxide in the atmosphere are likely to put a dent in the protein, iron and zinc content of rice, wheat, peas and other food crops.
Book: CLIMATE CHANGE THE FACTS 2017
22 Chapters.
Chapter 13: Carbon Dioxide and Plant Growth, Dr. Craig Idso.
Excerpts: For herbaceous plants, a 300 ppmv (parts per million by volume) increase in ..CO2..typically raises their productivity by about one-third.. in plants using all 3 major pathways of photosynthesis (C3, C4, CAM).
CO2 enrichment also benefits aquatic plants, both freshwater & saltwater species.
CO2 enrichment also benefits forests & plant water use.
This enrichment has been occurring for over 30 years.
CONCLUSION: Carbon Dioxide is NOT a pollutant, it is the very ELIXIR OF LIFE. (emphasis in the original).
Please find something you actually know something about to wet your pants about, KOOKOO brain. :)
Less PROTEIN in plants grown with greater CO2
Less IRON in plants grown with greater CO2
Less Zinc in plants grown with greater CO2
FAR MORE GROWTH of invasive species of plants/weeds with CO2 increases ! ! !
and by the way
….did you notice that
YOU ARE NOT A PLANT !
.
..
“….How is Sick Building Syndrome
is NOW Exacerbated by Higher Atmospheric CO2 Levels
Brian Donovan, Chief Scientist at McVan Aerospace. (2004-present)
How is Sick Building Syndrome Exacerbated by Higher Atmospheric CO2 Levels?
High CO2 levels have destroyed fresh air and increased the
aches and fatigue of billions of people while impairing our brain functions.
HVAC, (Heating, ventilation, and air conditioning) engineers
consider 800 ppm indoor a sign of severe under ventilation
and complaints of fatigue and aches seriously start at around 600 ppm.
CO2 is one of the most common causes of Sick building syndrome.
Supporting Information Lawrence Berkeley National Laboratory,
This Indoor Air Quality (IAQ) Scientific Findings Resource Bank.
“ In studies performed in Hungary [99], subjects’ performance in proof reading
tests, but not other tests, were significantly diminished with 4000 ppm
and 3000 ppm CO2, relative to 600 ppm CO2.
Subjects’ levels of satisfaction with indoor air quality also diminished
as the CO2 concentration increased.
In the first U.S. study [100],
each subject completed tests of decision making performance with CO2
concentrations of 600, 1000, and 2500 ppm.
Carbon dioxide was increased above the baseline level of 600 ppm
by injecting ultrapure CO2.
The subjects’ performance on most measures of decision making performance
was moderately and statistically significantly diminished at 1000 ppm CO2,
relative to 600 ppm CO2. At 2500 ppm CO2,
relative to 600 ppm, the subjects’ performance
on most measures of decision making performance was
highly and statistically significantly diminished.
In a second study from the U.S. [13],
a test of decision making performance was again used to assess
subjects’ levels of cognitive performance.
On average, scores on the various measures of cognitive performance
decreased by about 15% with 945 ppm CO2 relative to 550 ppm CO2.
With 1400 ppm CO2 relative to 550 ppm CO2, on average scores decreased by 50%.
“
This is very hard for many people to believe or care about.
They mention submariners:
we aren’t all healthy young men in a war machine
trained to ignore pain and discomfort.
It’s irrelevant.
The fatal concentration for CO2 is 50,000 ppm,
so we’ll live,
we’ll just suffer more and forget what fresh air was like.
It’s worth it to help those poor coal mine owners, right?
It was hard enough to get under 600 ppm with outdoor air at 280 ppm,
when the air outside is at 600ppm it’s technically impossible.
Now even in the country we are over frequently over
450 ppm.
I have a CO2 meter in the house is it’s regularly going over 600ppm,
and I have to open window to get to 470 ppm or so.
In cities typical daily ppm are over 1000 ppm. indoors
typical schools and offices go over 2000 ppm.
We have destroyed fresh air.
Humans evolved with co2 never going over 300 ppm.
Humans have never seen 400 ppm co2,
and
we are very sensitive the CO2 levels.
This is a bad experiment.
We have the highest co2 in 3–15 million years.
We can go massively CO2 negative with solar, wind, and hydrocarbons from wastes as a backup and replacement for fossils in long haul, military, reserve generators, and chemical feed stocks.
Solar and wind are available cheaper now,
((Thanks to Competition FROM Solar, Wind, Nat.Gas
…Electric Rates
have fallen 1%, enabled by the Obama Administration))
.
((Texas is the big winner with the most wind & solar…Electric Rates are down by double digits in competitive markets))
.
it’s been the majority of new power installs for the last 5 years,
Solar and wind Electric has doubled ever 2 and 4 years for the last 30 years or so, and prices to build and prices for the electric generated has Fallen dramatically….”
POPPYCOCK, KOOICNUT.
LOOK IT UP, Dumb ars, instead of lying !
I am still waiting for an explanation ???
. UPON what basis do you make the determination that CO2 was LOW to begin with???
?
?
?
R. Kooi david smith • 2 days ago
YOU claim CO2 was LOW to begin with….upon what basis do YOU make that determination.
HUMAN’S and Nearly Every Animal & Plant on earth have
NEVER EXISTED WITH ATMOSPHERIC GASES AT THIS LEVEL
….let alone where your advocacy of CO2 WILL BE LEADING US ! ! ! !
UPON WHAT SKILL SET ARE YOU PONTIFICATING SAINT HOOD FOR CO2
All animals EXHALE CO2 !
It is a waste product of animal digestion…and MUST be disposed of, or we DIE!
Scientists were at once excited about RISING CO2 levels as they studied higher CO2 levels in green houses…..they found, however, that their excited was dashed….
Staple Foods the world is dependent upon
We Losing nutrients in great quantities than the plants were growing.
Less Protein
Less Iron
Less Zinc
SLAPP isn’t a “procedure.” It’s a way for powerful people (corporations are people, remember?) use the courts to suppress public comment in during the public comment phase of a regulatory process. It’s not related to any suit involving Mann. I wouldn’t be surprised if Ball is for hire in SLAPP suits, but I haven’t heard of any with Ball or Steyn.
From Michael Mann’s lawyer Roger McConchie (who is an expert in defamation/libel/slander law in Canada)
Contrary to the nonsensical allegations made by John O’Sullivan in his July 4 posted on climatechangedispatch.com and elsewhere, plaintiff Michael Mann has fully complied with all of his disclosure obligations to the defendant Tim Ball relating to data and other documents.
No judge has made any order or given any direction, however minor or inconsequential, that Michael Mann surrender any data or any documents to Tim Ball for any purpose.
Accordingly it should be plain and obvious to anyone with a modicum of common sense that Mann could not possibly be in contempt of court.
Just to be clear: Mann is not defying any judge. He is not in breach of any judgment. He is not, repeat not, in contempt of court. He is not in breach of any discovery obligations to Ball.
In this context, O’Sullivan’s suggestion that Ball “is expected to instruct his British Columbia attorneys to trigger mandatory punitive court sanctions” against Mann is simply divorced from reality.
Finally, a word about the actual issues in the British Columbia lawsuit.
If O’Sullivan had read Ball’s statement of defence, he would immediately see that Ball does not intend to ask the BC Court to rule that Mann committed climate data fraud, or that Mann in fact did anything with criminal intent.
O’Sullivan would have noticed that one of Ball’s defences is that the words he spoke about Mann (which are the subject of Mann’s lawsuit) were said in “jest.”
The BC Court will not be asked to decide whether or not climate change is real.
So there is no chance whatsoever that any BC Court verdict about Mann’s libel claims against Ball will vindicate Donald Trump’s perspective on climate change.
Roger D. McConchie
Lawyer
https://www.facebook.com/MichaelMannScientist/posts/1466774033378794:0
https://www.irwinlaw.com/titles/canadian-libel-and-slander-actions
Mann requested a delay in a case he has dragged out over 6 years.
Tim Ball agreed, provided Mann disclosed all his data.
Mann failed to disclose. He is in breach of his word to Dr. Ball.
No surprise there, then.
He has therefore lost his defamation case by default.
Only the verdict remains.
The Little Fat Fraud, Mikey Mann pocketed $6 million + of taxpayers’ dollars to promote his Single Tree Ring Circus fraud, provided by corrupt US govt.
Tim Ball has lived on a University Professor’s salary.
Tim Ball quipped that the LFFraud should be in Penn State Prison, not University of Pennsylvania. The LFFraud tried to squish Ball with a defamation case. Nasty LFFraud.
The LFFraud tried to claim his data was his own “intellectual property”, though the dumb US taxpayers had paid for the lot. Dumb & greedy LFFraud.
A true scientist would be keen to show his data, to gain validity from the scientific community. Mann is anxious to hide his data, & rely on his close group of fellow politicians to pal-review his incompetent frauds to give a veneer of “respectability” to his sh1te work.
The Wegman report discloses Mann thoroughly: a 91 page report.
Only half-a-dozen pages need be skimmed:
http://www.uoguelph.ca/~rmkitri/research/WegmanReport.pdf
This LFFraud is dealt with in these three books:
1) Human Caused Global Warming the biggest deception in history, by Dr. Tim Ball.
drtimball.com
2) His other book: The Deliberate Corruption of Climate Science
3) Heaven and Earth global warming: the missing science, by geology Prof. Ian Plimer.
I reco all three books. :)
Have a nice day. :)
YOUR COMMENT IS ALMOST COMPLETELY Fudge….no facts.
http://www.principia-scientific.org/breaking-fatal-courtroom-act-ruins-michael-hockey-stick-mann/
2 great graphs, showing how the little fat fraud tried to wipe out the MWP & LIA, Medieval Warm Period & Little Ice Age.
The fraud factory went gaga over Mann’s lone pine tree ring circus, till it was laughed out of IPCC reports: it was a fraud too far. :) :)
Sensible folk are backing away from the self-styled ‘Nobel Prize Winner’ at a rate of knots. Those with any brains, that is.
The only question left is what penalty the court imposes.
There was no request from either competing side in this case for a delay….
Canadian courts routinely give delays…believing that A DELAY may lead to a Reconciliation and a Compromise….which, in the courts opinion, is an advantage.
Michael Mann is a Propagandist. His climate change position is so weak, that he will not allow questions counter to his position. That is not how Science works. If you can’t debate your position then your position lacks any Scientific Merit.
All of Dr. Michael Mann’s Research has been available for decades…
It has been Peer Reviewed (purposely red team/blue team)
Published in Respected Scientific Journals and Replicated as substantiation.
36 other Peer Reviewed Research Studies have verified his Hockey Stick….
no matter how many time DAILY CALLER and BREITBART SAYS other wise…it is widely accepted.
Daily Caller and Breitbart, as you know, are PAID to FIGHT for the Fossil Fuel Monopoly and to FIGHT for rabid right wing causes….that encourages distortion and half truths.
Let’s talk to “you”,
http://www.bom.gov.au/climate/current/annual/aus/2015/20150106_global_Tmean_plot.png
http://berkeleyearth.org/wp-content/uploads/2015/03/land-and-ocean-sea-ice-comparison-large.png
“36 other Peer Reviewed Research Studies have verified his hockey stick”
When you use the same bogus statistical methods, it’s no surprise that they get the same bogus pseudoscience result. Same with climate models, GIGO. So sad that you aren’t intelligent enough to understand this.
Which two people does this statement relate to? Let’s just check:
https://youtu.be/qZzwRwFDXw0?t=331
LOL
Climate Change ,meet the scientists (Mann et al ) (Mann the former Nobel Laureate) who sought to deceive the public and fellow scientists by Data manipulation , First minute spells it out
https://www.youtube.com/watch?v=BuqjX4UeBYs&t=8s
.
What the 20th century temp data really shows .. No “Blade” .
http://www.realclimate.org/images//ProxySites_vs_Global1.png
Wow, two graphs that both show around identical 0.6C warming between 1880 and 2000, and a climate denialist that has no comprehension that altering the x axis of a graph changes the gradient.
The idiocy of socalpa knows no bounds.
No “blade” .
.
Your despair knows no bounds . .
.
The Icon of the climate movement ,shown a fraud , thanks to Marcott .
The rate of warming in Smith et al 2008, which is used in the Marcott study (red line) is that same as that presented in your youtube clip.
That you cannot comprehend this is merely another demonstration of your utter illiteracy when attempting to read a graph. You are hopelessly stupid socalpa, but a testament to science deniers everywhere.
No shaft . NRC 2006
.
No blade ,Marcott 2013 ( 20th century spike “not robust” ) . ( Smith et al).
.
No hockeystick .
Ah, I see you have been unable to read Marcott with comprehension.
Well that does surprise me, for a person that cannot punctuate a sentence.
Ah , I see I have reduced you to whining about punctuation …again !
.
Ho ! Ho ! Ho !
Hey brains.
What part of 20th century temperature reconstructions does Marcott say are not robust? Here are your two options:
(1) paleocliamte data
(2) NOAA instrumental data
You decide….
I’ve decided ;
.
You’re an idiot troll .
Nice evasion of a very simple question brains.
Clearly it was way too complicated for you.
There there. ;-)
Another day, another post by socalpa showing him to be a complete trolling idiot.
So, Marcott showed that his own doctoral thesis was fraudulent? Weird.
For your climate entertainment:
http://www.principia-scientific.org
For those who didn’t vote for Trump,
what would Trump have to do to get your vote in the 2020 election?
.
First,
you have to understand that the people who didn’t vote for Trump in ’16
don’t make up a huge monolithic bloc or live in a leftist,
anti-American mythical land called Utopia.
.
(Or, as the most aggressive of Trump supporters might put it, Libtardia.)
I can’t speak for every anti-Trump voter,
I can only speak for myself, although I’m sure that my reasons
for not voting from the current President
are not too different from other non-Trump voters.
.
Second,
understand this: Donald J. Trump is 71 years old
(as of December 11, 2017).
As such,
he is older than the late President Ronald W. Reagan
at this point in his first term.
People at that age simply do not change their personalities,
philosophies of life, political views, or their agendas.
These are pretty much set in stone and can’t easily be altered
unless a person is intelligent and self-aware enough to realize that he or she must change course.
As a 71-year-old man of
power
and
privilege,
President Trump is not a person who is capable of doing
what one might call a full one-eighty degree turn
as far as his view of the world is concerned.
He’s not smart enough to understand where he has gone wrong
as a newly-minted politician,
and he is certainly not honest enough to admit that
he made a “yuge” mistake in running for the Presidency.
And because he thrives on the loyalty and adulation of his fans
(the MAGA crowd, as I call them),
he would not dare incur their wrath by reversing course
on the following planks of the extreme right’s platform:
.
Repeal and replacement of the Affordable Care Act
.
The “wall on the Mexican border”
.
Refusing to participate in climate change-related accords
.
Lowering taxes for the wealthy
.
Fostering a jingoistic “America First” foreign policy
.
Tolerating and even encouraging
white supremacists and white nationalists
.
Supporting the “birther conspiracy” that claims, falsely,
that former President Barack Obama was not born in the U.S.
.
Undoing everything the 44th President accomplished in
his eight-years in the White House
Waging a war against traditional media outlets
and calling any reporting that he doesn’t like “fake news”
I didn’t vote against Trump because I am a Clinton loyalist.
I’m not.
She’s a remarkable woman
– a former First Lady who was the first member of that grand sorority
to run and win a seat in the Senate
(representing the great state of New York),
and later became President Obama’s first Secretary of State.
But rightly or wrongly,
she has a lot of detractors and can often come off
as just another ambitious politician with ideas
that many conservatives find unpalatable.
.
I also don’t believe any of the crazy conspiracies
that the Republicans invented about Mrs. Clinton
as long ago as the 1992 campaign,
but she doesn’t come across as America’s answer to Angela Merkel.
.
Nevertheless, I voted for Hillary Clinton not just
because I thought she was the better candidate,
but
because I don’t like Trump.
.
And when I say “I don’t like Trump,”
I am not just saying that I don’t like
his policies or his philosophy.
It goes farther than that.
I do not like him on any level.
So, let’s go over the list of the ways in which
I do not like Trump. You know, so there are no misunderstandings:
I do not like him as a public speaker.
I do not like him as a businessman.
I do not like him as a TV personality.
I do not like him as a candidate.
I do not like him as a President.
I do not like him as a human being.
Not one bit.
So,
basically,
to answer the question “For those who didn’t vote for Trump,
what would Trump have to do to get your vote in the 2020 election?”
I can only say this.
Nothing.
Nothing at all.
There’s no way on Earth that Trump can get my vote in the next election.
Poor leftist socialist, still butthurt over Trump beating crooked HilLIARy.
david smith seems to claim that CO2 is a blessing….
he ignores the FACT that during every day mankind has walked and prospered on EARTH CO2 LEVELS were between 180ppm and 280ppm….
THOSE are the goldilocks levels during which mankind lived up to the Biblical Imperative to ” be fruitful and multiply” !
Today, sheer greed, has driven CO2 levels above any level that nearly all life today has ever experienced.
It costs PROFITS to Corporate Millionaires to Clean Up after themselves….so Toxic Waste & Gasses are dumped and pumped….with out any thinking at all.
CO2 is a pollutant: The Worst Climate Pollution Is Carbon Dioxide – Scientific American
https://www.scientificameri…
.
Nov 4, 2014 – CO2 outranks soot, methane and even hydrofluorocarbons in terms of long-term global warming. … Cutting emissions of such “short-lived climate pollutants,” or SLCPs, will not have much impact on long-term climate change, finds a new study published yesterday in the Proceedings of the National …
.
CO2 is a POISON: Carbon dioxide (CO2) is a toxic gas at high concentration, as well as an asphyxiant gas (due to reduction in oxygen). Irritation of the eyes, nose and throat occurs only at high concentrations. The concentration thresholds for health effects are outlined in the table. Health effects of respiratory exposure to carbon dioxide
.
CO2: is an noun
noun: asphyxiation
the state or process of being deprived of oxygen, which can result in unconsciousness or death; suffocation.
“the cause of death was asphyxiation”
>>>
People also ask:
How much carbon dioxide can kill you?
.
Is carbon dioxide harmful to humans?
Carbon dioxide (CO2) is a toxic gas at high concentration, as well as an asphyxiant gas (due to reduction in oxygen). Irritation of the eyes, nose and throat occurs only at high concentrations. The concentration thresholds for health effects are outlined in the table.
Carbon Dioxide (CO2) – IVHHN
http://www.ivhhn.org/index.php?opt...
Search for: Is carbon dioxide harmful to humans?
….
“… In the C3 crops … they found significant declines in zinc and iron.
The largest was a 9.3 percent drop in the zinc level in wheat. …
“Crops are losing nutrients as CO2is going up.”May 9, 2014
High CO2 Makes Crops Less Nutritious | Nat Geo Food – Latest Stories
https://news.nationalgeogra……
***
Carbon Dioxide May Rob Crops Of Nutrition, Leaving Millions At Risk …
https://www.npr.org/…/car……
Aug 2, 2017 – Rising carbon dioxide levels could have an unexpected side effect on food crops:
a decrease in key nutrients.
… A 2014 study showed that higher levels of carbon dioxide in the atmosphere are likely to put a dent in the protein, iron and zinc content of rice, wheat, peas and other food crops.
Poor Rick, posting rubbish propaganda from your climate cult religion. Sad.
Oh look, a graph just like Dr. Mann’s Hockey Stick graph…based on other Data….with the same results….THAT IS CALLED REPLICATION…..used to verify research.
http://www.realclimate.org/images//Marcott.png
Oh look, more FAKE hokey-stick pseudoscience.
Poor Rick, a duped climate cult fanatic.
More Fraud ? What the 20th century really looks like ;
http://www.realclimate.org/images//ProxySites_vs_Global1.png
adam_s_0625
Your remarkable comment is obviously NOT based on your admiration for BALL or his attorney (or not attorney).
* * * *
“Affidavits filed in the British Columbia Supreme Court libel litigation brought by climate scientist Dr. Michael Mann
against climate science denier Timothy Ball
reveal that Ball’s collaborator and self-styled “legal advisor” has misrepresented his credentials and endured some significant legal embarrassments of his own.
The affidavits also reveal that Tim Ball was “aware of the charges against John O’Sullivan almost from the start” and has tried to distance himself from his erstwhile advisor and writing partner.
The affidavits [1, 2] come from research of science and medical writer Andrew Skolnick, who documents O’Sullivan’s misrepresentations, backtracking and questionable behavior.
Tim Ball and John O’Sullivan had a close working relationship,
even before Mann sued Ball for libel in March 2011.
For example,
they co-authored the climate science denial book
‘Slaying the Sky Dragon: Death of the Greenhouse Gas Theory’, which was published in 2010.
Skolnick’s evidence shows that O’Sullivan made a series of false claims,
including:
** that he was an attorney with more than a decade of successful litigation in New York State and Federal courts;
** that he was employed by a major Victoria, B.C. (Canada) law firm that is representing Ball in the libel action;
** that he is a widely published writer, with credits in Forbes and the National Review;
** that he had received his law degree from the University College, Cork, Ireland and/or
from the University of Surrey (O’Sullivan’s actual legal accreditation,
apparently obtained after the Mann-Ball action commenced, comes from an online degree mill,
Hill University, which promises delivery in two weeks);
that he is a member of the American Bar Association.
One affidavit includes an online comment in which O’Sullivan says,
“For your information,
I am a retired academic and I have litigated personally or assisted others in pro se litigation at every level of court there is in New York State as well as Federal level, for over a decade and never lost.”
Although O’Sullivan admits in this particular comment that
he is not, in fact, licensed to practice law, in the U.S. or the U.K.,
he adds, “I’m just some Brit with a brain who can go live with his American wife in her country and kick ass big time around a courtroom.”
Certainly,
O’Sullivan was successful in winning an acquittal when he was personally charged in England as a high school teacher accused of sending lewd text messages and assaulting a 16-year-old female.
Given the acquittal,
it would not generally be appropriate to bring up this sordid and unproven bit of history, except that O’Sullivan himself went on to write an “erotic” “novel” with a startlingly similar storyline:
Vanilla Girl: a Fact-Based Crime Story of a Teacher’s Struggle to Control His Erotic Obsession with a Schoolgirl.
Although eager to present himself as a science researcher of accomplishment – certainly Tim Ball’s equal – Skolnick’s research found that O’Sullivan is
highly prone to error,
whether intentional or not.
For example,
O’Sullivan provided bogus contact information when registering as a member* with the New York County Lawyers’ Association, an organization that apparently does not vet its members’ qualifications (and does not, in any case, bestow the right to practice law).
While O’Sullivan claimed to be with a firm named “Principia Scientific International,” he provided the address of a construction company called Second Nature Construction; the phone number and fax number didn’t belong to O’Sullivan or anyone connected to “Principia,” either….”
BS propaganda to obfuscate and distract from Mann’s shoddy pseudoscience.
Mr. Stephen Duval….less than half truth teller
http://b50ym1n8ryw31pmkr4671ui1c64.wpengine.netdna-cdn.com/wp-content/blogs.dir/11/files/2014/05/climate-graph.png
1) No empirical evidence there or anywhere else that any climate warming was human-caused.
2) Your graph is not measured data. It’s fake, made up numbers that exaggerate the natural warming that has happened over the past century.
The shame of it all is the lack of a viable explanation, how is c02 the driving force of Global warming? We know how heating water releases the gas, so how do we explain its reversal to the cause of heat? Until this is explained and supported by experiment the rest is possibly irrelevant. Are we on the edge of discovering perpetual motion?
” How has the recent climate changed?
Jessica Moore, former CCMS, Prineville, OR KPBSD in Soldotna, AK
Updated 6h ago
Being in Alaska I observe the symptoms of climate change as observed by the local weather more acutely than those at lower latitudes. The shifts are more extreme here, and politics aside, I’d like to show you what is happening in my area.
While others have pointed out already that weather & climate (weather trends over very long spans of time) are different, I can offer you my observations on recent Alaskan weather. The ice on the lake at my place is freezing about 3 weeks later than it did when I was a child (I’m 43), averaging thinner ice in the winters, and leaving about 2 weeks earlier.
Consequently, the migratory birds are staying longer on both ends as well. And, the bears are out longer too. While that puts a spin on our predator prey dynamics here on the Kenai Peninsula, so too does the fact that I am now able to grow Zone 4 & 5 plants in my flower beds that once were hardy to only Zone 3..
I observe the tree line on the Kenai & Chugach mountain ranges to have steadily marched up the hill (warmer weather affords less permafrost and greater O2, so trees can now sustain themselves at higher altitudes) and where I live thunder & lightning storms in the summer are now common and haven’t been in the past. Similarly, our kettle lakes, which are a product of the most recent glaciation and also the type in my yard, are shrinking in circumference as the weather is warmer. This is because the muskeg is drier and now better able to sustain trees. My home used to host a view of the mountains, and that view is now blocked by birch & white spruce trees, species which don’t like their feet to get wet. As further evidence of this, lakes with trees around them fill in, and the younger trees are shorter than the older ones, demonstrating the shrinking of the lakes.
The thawing of permafrost, and subsequent drying of wetlands it changing our biomes up here. As the permafrost thaws, it is releasing an alarming amount of CO2 and methane… which as you know, both trap heat (for they are greenhouse gases in their own right) & this will only exacerbate our problem. That is it’s own topic, however.
In the once boggy wetlands (muskeg) of western Alaska, ungulate species are being introduced to forage on grasses and sedges, because such vegetation is now prevalent there and the ground is now firm enough to support the weight of browsers. The estuaries where waterfowl used to come to feed are rather birdless because the area is no longer a wet tidal marsh.
Similarly, this drying is having an affect on our fire patterns. Dense with peat moss, now dried out, it is a perfect storm for woodland fires. And, you may notice that many of your fire jumpers and teams are spending an increasing amount of their fire season in Alaska. Indeed, at one point 85% of the landmass of the nation’s fires were in Alaska in 2015:
This drying effect is also demonstrated well in our local spruce bark beetle outbreaks. The beetles prefer the warmer, drier, and longer summers, so are having a fantastic time destroying our taiga. This compounds the increase in fire events exponentially and we are now currently due for yet another outbreak.
This is separate from the issue of our glaciers receding at an unprecedented rate: one cannot even see either Exit or Portage glaciers from the viewing platforms that were made in the 90’s anymore. The following image demonstrates the measured retreat of the ice.
I am not going to assert that my local environment is changing because of climate progression, or that climate is changing because of weather. That is not my interest. All I am doing is demonstrating that the natural environment in my little neck of the woods is different, & my ecosystems are changing as a result.
I post this because I am aware that some people do not yet understand that the global climate is indeed changing. We are evidenced with coming out of the last glaciation on time, as compared to all other interglacial periods. But, we are doing so at a clip that is unequivocally unprecedented in Earth’s history. And, just like we could tell that the burn in the ozone hole was man-made in the 80’s, we can tell that we are causing this particular deviation.
Many cannot observe their climate or weather changing as acutely as we are able to in the northern latitudes. Thus, my post. It’s Jan 26, 2018 at current. When I was married 24 yrs ago in November there were over 13 feet of snow on the ground in my coastal town (as was customary then), we now have about 3 inches & we’ve not had snow deep enough for snowmobiling here in four winters. Feel free to share my post. Ps- I do not own the photos.
a few seconds ago
CO2 & Temperature Marriage:
https://www.bing.com/images…
***********************************************
This Holocene Inter Glacial Warm Period PEAKED in Temperatures about 7000-8000 years ago.
Since then, temps have been slowly falling, in spits & spurts,
> as we slide < into Earth's most powerful cyclical CLIMATE CHANGE:
Glaciations ! ( ice ages )
.
EVEN THOUGH THE CAUSES OF ICE AGES continue to this very day, temperatures BOTTOMED-OUT in the mid to late 1700's.
.
AND Since then, temps have been rising.
Look:
http://www.realclimate.org/…
We ARE pulled toward the next ICE AGE !
As Earth is still Being Pulled, in orbit, away from the Sun.
.
We should still be cooling toward an ice age, but in the mid / late 1700's .
Earth's MOST powerful natural Cycle was terminated.
the Ice Age was terminated
…abruptly…temps started to rise.
.
Only the Enhanced Green House Effect Explains this ongoing event!
Look:
https://www.bloomberg.com/g…
.
Direct observations:
.
1799
Alexander von Humboldt studied, worried and postulated that Human Activites / pollution would CAUSE CLIMATE CHANGE!
.
1799
Thomas Jefferson also penned a paper on observed changes in climate which he stated was
probably caused by man.
1811
Science Tied Warming, Climate Changes directly to Human Activities & Industrialization.
.
1856
"…the work of Eunice Foote, who three years prior to the start of Tyndall's laboratory research, conducted similar experiments on absorption of radiant energy by atmospheric gases, such as CO2 and water vapor.
.
The presentation of her report at a major scientific convention in 1856 was accompanied by postulation that even modest increases in the concentration of CO2 could result in significant atmospheric warming."
http://www.searchanddiscovery.com/..
.
CO2 is rising sharply due to human activity.
.
Satellite & surface measurements find less energy is escaping to space at CO2/H2O (& other Green House Gasses) absorption wavelengths.
.
Ocean and surface temperature measurements continue to climb even though ALL the CAUSES of Ice Ages continue to this day.
These Research studies find the planet continues to accumulate heat. Year–after–year.
HERE is a line of empirical evidence:
((human/industry CO2 emissions are causing global warming))
**
*
Climate Myth
The Skeptic-Denier position:
" There's no empirical evidence "
"There is no actual evidence that carbon dioxide emissions are causing global warming.
Note that computer models are just concatenations of calculations you could do on a hand-held calculator,so they are theoretical & cannot be part of any evidence." (noted DENIER David Evans)
***
The line of empirical evidence that humans are causing global warming is as follows:
.
We're raising CO2 levels
.
Human carbon dioxide emissions are calculated from international energy statistics, tabulating coal, brown coal, peat, and crude oil production by nation and year, going back to 1751.
.
CO2 emissions have increased dramatically over the last century, climbing to the rate of 29 billion tonnes of CO2 per year in 2006 (EIA).
.
Atmospheric CO2 levels are measured at hundreds of monitoring stations across the globe.
.
Independent measurements are also conducted by airplanes and satellites. For periods before 1958, CO2 levels are determined from air bubbles trapped in polar ice cores. In pre-industrial times over the last 10,000 years, CO2 was relatively stable at around 180-to-280 parts per million.
.
Over the last 250 years, atmospheric CO2 levels have increased by about 100 parts per million.
.
Humans are emitting more than twice as much CO2 as what ends up staying there. Nature is reducing our impact on climate by absorbing more than half of our CO2 emissions.
.
The amount of human CO2 left in the air, called the "airborne fraction", has hovered around 43% since 1958.
.
CO2 traps heat
.
According to radiative physics and decades of laboratory measurements, increased CO2 in the atmosphere is predicted to absorb more infrared radiation as it escapes back out to space.
Human Agriculture & Industry is producing 120-135 TIMES MORE CO2
than ALL of EARTH's Volcanoes Combined.
…every year !
..
Leading
NASA
Scientists
Questioned
Green House Gas effects in our atmosphere:
So,
In 1970,
NASA launched the IRIS satellite measuring infrared spectra.
.
Google: Iris Satellite Research Abstract
.
In 1996,
the Japanese Space Agency launched the IMG satellite which recorded similar observations.
Google: IMG Satellite Research Abstract
.
Both sets of data were compared to discern any changes in escaping radiation levels over the 26 year period
Google (Harries 2001 research abstract)
.
What they found was a drop in Escaping Infra Red radiation at the PRECISE wavelength bands that greenhouse gases such as CO2 with H2O, CFC's, Ozone, Nitrous Oxides, and methane (CH4) absorb energy.
The change in DECREASE IN ESCAPING I.R. radiation was consistent with theoretical Expectations / Predictions.
.
This research & paper found
"direct experimental evidence for a significant increase in the Earth's greenhouse effect" and Warming on Earth.
.
This result has been confirmed by numerous subsequent research & papers using data from later satellites
Google (Griggs 2004 Research Abstract)
Google (Chen 2007 Research Astract )
I find it interesting that no climate scientist presented Amicus Curiae brief in favour of Mann.
It doesn’t apply in Canada….the Government presents Mann’s case against Ball.
Michael Mann’s lawyer Roger McConchie
(who is an expert in defamation/libel/slander law in Canada)
Contrary to the nonsensical allegations made by John O’Sullivan
in his July 4 posted on climatechangedispatch.com and elsewhere,
plaintiff Michael Mann has fully complied with all of his
disclosure obligations to the defendant Tim Ball relating to data and other documents.
No judge has made any order or given any direction, however minor or inconsequential,
that Michael Mann surrender any data or any documents to Tim Ball for any purpose.
Accordingly it should be plain and obvious to anyone with a
modicum of common sense that Mann could not possibly be in contempt of court.
Just to be clear:
Mann is not defying any judge.
He is not in breach of any judgment.
He is not, repeat not, in contempt of court.
He is not in breach of any discovery obligations to Ball.
In this context, O’Sullivan’s suggestion that Ball
“is expected to instruct his British Columbia attorneys to trigger
mandatory punitive court sanctions” against Mann is simply divorced from reality.
Finally, a word about the actual issues in the British Columbia lawsuit.
If O’Sullivan had read Ball’s statement of defence,
he would immediately see that Ball does not intend to ask the BC Court
to rule that Mann committed climate data fraud,
or that Mann in fact did anything with criminal intent.
O’Sullivan would have noticed that one of Ball’s defences
is that the words he spoke about Mann
(which are the subject of Mann’s lawsuit) were said in “jest.”
The BC Court will not be asked to decide whether
or not climate change is real.
So there is no chance whatsoever that any BC Court verdict about Mann’s libel claims
against Ball will vindicate Donald Trump’s perspective on climate change.
Roger D. McConchie
Lawyer
https://www.facebook.com/Mi…
https://www.irwinlaw.com/ti…
“Judith Curry, a recently retired climatologist at Georgia Tech, has submitted to the court an Amicus Curiae brief critical of Mann’s scientific methods.”
Apparently, it does … no climate scientist presented Amicus Curiae brief in favour of Mann, but Judith Curry filed one against Mann.
The Case has already been tried…THIS period is a time that Canadian Courts Give litigants to settle the case….before the JUDGE SETS HIS OWN RULING.
SO THERE IS NO Amicus Curiae Brief….but the fact that a SKEPTIC would be CRITICAL of Dr. Michael Mann’s research and conclusions comes as no surprise…..
But this case HAS NOTHING to do with MANN’S research !!
….THERE will be no ruling on his REASEARCH !!
……this is a defamation case….
““Amicus curiae” is Latin for “friend of the court”. It is a legal concept that has been around since the 1400’s but has recently been reinvigorated and reinterpreted by Canadian “criminal” and “family” law courts. …”
Nothing you posted refutes the fact that no climate scientist presented Amicus Curiae brief in favour of Mann, but Judith Curry filed one against Mann. Defining what is “Amicus curiae” (Latin, “friend of the court”) doesn’t help Mann, because no climate scientist presented Amicus Curiae brief in favour of Mann.
I simply pointed out that no climate scientist presented Amicus Curiae brief in favour of Mann, but Judith Curry filed one against Mann.
Bummer, but my point is that no climate scientist presented Amicus Curiae brief in favour of Mann, but Judith Curry filed one against Mann.
Can you read?
How has the recent climate changed?
Jessica Moore, former CCMS, Prineville, OR KPBSD in Soldotna, AK
Updated 23h ago
Being in Alaska I observe the symptoms of climate change as observed by changes in the local environment more acutely than those at lower latitudes. The shifts are more extreme here (we are warming twice as fast as the rest of the US), and politics aside, I’d like to show you what is happening in my area.
While others have pointed out already that weather & climate (weather trends over very long spans of time) are different, I can offer you my observations on recent Alaskan weather. The ice on the lake at my place is freezing about 3 weeks later than it did when I was a child (I’m 43), averaging thinner ice in the winters, and leaving about 2 weeks earlier.
Consequently, the migratory birds are staying longer on both ends as well. And, the bears are out longer too. While that puts a spin on our predator prey dynamics here on the Kenai Peninsula, so too does the fact that I am now able to grow Zone 4 & 5 plants in my flower beds that once were hardy to only Zone 3..
I observe the tree line on the Kenai & Chugach mountain ranges to have steadily marched up the hill (warmer weather affords less permafrost and greater O2, so trees can now sustain themselves at higher altitudes) and where I live thunder & lightning storms in the summer are now common and haven’t been in the past. Similarly, our kettle lakes, which are a product of the most recent glaciation and also the type in my yard, are shrinking in circumference as the weather is warmer. This is because the muskeg is drier and now better able to sustain trees. My home used to host a view of the mountains, and that view is now blocked by birch & white spruce trees, species which don’t like their feet to get wet. As further evidence of this, lakes with trees around them fill in, and the younger trees are shorter than the older ones, demonstrating the shrinking of the lakes.
The thawing of permafrost, and subsequent drying of wetlands it changing our biomes up here. As the permafrost thaws, it is releasing an alarming amount of CO2 and methane… which as you know, both trap heat (for they are greenhouse gases in their own right) & this will only exacerbate our problem. That is it’s own topic, however.
In the once boggy wetlands (muskeg) of western Alaska, ungulate species are being introduced to forage on grasses and sedges, because such vegetation is now prevalent there and the ground is now firm enough to support the weight of browsers. The estuaries where waterfowl used to come to feed are rather birdless because the area is no longer a wet tidal marsh.
Similarly, this drying is having an affect on our fire patterns. Dense with peat moss, now dried out, it is a perfect storm for woodland fires. And, you may notice that many of your fire jumpers and teams are spending an increasing amount of their fire season in Alaska. Indeed, at one point 85% of the landmass of the nation’s fires were in Alaska in 2015:
This drying effect is also demonstrated well in our local spruce bark beetle outbreaks. The beetles prefer the warmer, drier, and longer summers, so are having a fantastic time destroying our taiga. This compounds the increase in fire events exponentially and we are now currently due for yet another outbreak.
This is separate from the issue of our glaciers receding at an unprecedented rate: one cannot even see either Exit or Portage glaciers from the viewing platforms that were made in the 90’s anymore. The following image demonstrates the measured retreat of the ice.
I am not going to assert that my local environment is changing because of climate progression, or that climate is changing because of weather. That is not my interest. All I am doing is demonstrating that the natural environment in my little neck of the woods is different, & my ecosystems are changing as a result.
I post this because I am aware that some people do not yet understand that the global climate is indeed changing. We are evidenced with coming out of the last glaciation on time, as compared to all other interglacial periods. But, we are doing so at a clip that is unequivocally unprecedented in Earth’s history. And, just like we could tell that the burn in the ozone hole was man-made in the 80’s, we can tell that we are causing this particular deviation.
Many cannot observe their climate or weather changing as acutely as we are able to in the northern latitudes. Thus, my post. It’s Jan 26, 2018 at current. When I was married 24 yrs ago in November there were over 13 feet of snow on the ground in my coastal town (as was customary then), we now have about 3 inches & we’ve not had snow deep enough for snowmobiling here in four winters. Feel free to share my post. Ps- I do not own the photos.