
Global warming campaigners continue to sound the sea level alarm.
Politicians, actors, and “climate activists” warn us regularly that meltwater from massive ice sheets in the Antarctic and the Arctic will soon drown our coastal towns and cities, and the process will become “irreversible.” Graphic photoshopped pictures of New York skyscrapers show water reaching many upper floors. Miami is shown vanishing under the sea. All this, as a result of increased CO2, warming the Earth, and melting 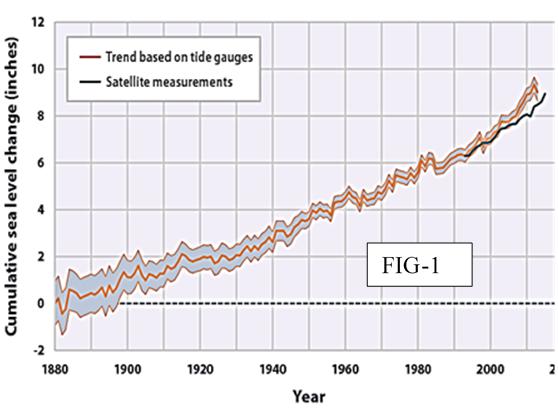 the ice. All this in order to gain support for their plan to stop burning fossil fuels and ultimately enslave society with wind and solar energy, requiring rationing energy to all.
The fundamental data and facts support none of this hysteria. Looking at Figure 1,[i] we notice in the last 140 years, the oceans have risen only about Nine inches. A rise equal to the thickness of a few pieces of paper a year.
Now compare Figure 1 to Figure 2 and see the close correlation between the rise in ocean level and the increase in known ocean surface temperatures. When we consider water’s physical properties in Fig 2,[ii], we see the volume of water increases with a temperature rise. This data proves that the sea level has risen at about the same rate that the oceans have been warming. When we are dealing with immeasurable gigatons of water in the oceans, even a small temperature rise can cause a measurable ocean level rise.
The incorrect assertion that the melting polar ice is the cause of the ocean level rise is even contradicted by the 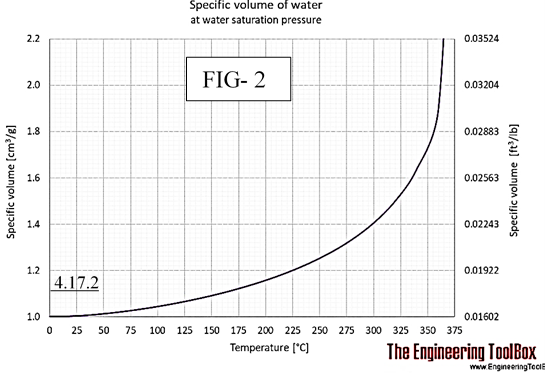 UN/IPCC, whose Fifth assessment report stated: “Water volume rises with temperature because of thermal expansion—another primary driver of sea-level rise.”[iii]
There are differing positions on the causes of sea-level rise because estimating the many parameters involved is not an exact science. There are too many unknowns, including the volume of the Earth’s water, its temperatures, its densities, the influence of the many ocean bottom volcanic and tectonic events, to name a few. The margin of errors in these assumptions results in wild discrepancies.
Can melting sea ice cause ocean levels to rise? “Not so much” is the simple answer. In grade school, we learned 90 percent of an iceberg or any floating ice is below the waterline while only 10 percent is above the water. This happens because when water starts to freeze, it expands, becoming 10% less dense and floats upon the water that made it up. When the ice melts back into the water, it shrinks by the same 10 percent. So, when sea ice melts, the 10 percent that was floating above the water combines with the 90 percent under the water, occupying the same original water volume. You can check this out next time you have a glass of ice and water. Mark the water level on the glass with a grease pencil and then wait till all the ice is melted, and you will find the water level remains at the grease mark line.
-
-
What about the melting of the land glaciers? The Antarctic[v] contains about 90 percent of the world’s ice mass and is the 800-pound gorilla in the room. About 44 percent of that Antarctic ice is in the ice shelves (it’s floating at the coastal edges), mostly in the western regions on the Pacific Ocean. More than 50 percent of the Antarctic sheet is land-based and can be several miles thick. Historical data confirms that there are few days per year where the temperature is above freezing, and then for only a few hours per day and only along the coast. Consequentially little or no continental Antarctic ice ever reaches the oceans. During bright and sunny days, a small amount of surface of the continental and shoreline ice is destroyed by infrared rays from the sun. But this ice does not melt into the water; rather, it sublimates directly into water vapor.
-
-
-
Sublimation means that the ice goes directly from the solid to the gaseous phase (water vapor) without ever going through the liquid phase.[vi] When the sublimated water vapor reaches the cold Antarctic air, the vast majority of it quickly turns to snow and falls back on the glacier. The winds blow only a tiny amount over the Antarctic ocean. Nearly zero goes into the oceans as water.
-
Coastal Antarctic ice, dramatized with films, photos, and articles in newspapers and TV, shows large ice sheets tumbling into the ocean. These dramatic falling cliffs are not caused by global warming. Instead, the melting is occurring at the water level by the warmed Pacific Ocean. Here the water splashes and melts and gouges caverns in the ice, forming large ice shelves or overhangs. This process continues until the weight of the overhang is big enough to cause the overhung ice to break and tumble off. That’s when we get the sensational pictures. So yes, some of this ice will melt into the oceans and will cause some water level rise, but the volume is unmeasurably small.
-
NASA[vii] published a study on October 30, 2015, saying that Antarctica is accumulating ice at a rate of about 112 billion tons per year. It has already replaced all the ice that melted in the previous several decades. Another NASA study reports an increase in the rate of Antarctic snow accumulation. Currently, enough continental ice is accumulating to outweigh the losses caused by its shrinking coastal glaciers. Credits: Jay Zwally, Journal of Glaciology.[viii]
Yes, there was substantial glacial melting in Greenland, Alaska, and other northern hemisphere locations, which added some waters to the oceans during the warming of the past several decades. However, these glaciers tend to melt and then increase in about twenty-year cycles, depending on the local conditions.[ix] A number of these glaciers are now growing at a significant rate, like the famed Jakobshavn glacier in Greenland.[x] A world scorecard has kept that shows which glaciers are melting and which are growing. But the long-term batting average seems to be about half growing and half shrinking.
Besides water temperature, other factors need to be accounted for when we say the ocean level is rising or falling. At the local level, the ocean can appear to “increase” or “decrease” due to changes in the land caused by land settling, such as we see in downtown Boston, where the landfill of 150 years ago[xii] keeps on settling, giving the appearance that the ocean is rising.[xiii]
At the local level, there’s also the sedimentation[xiv] effect. For example, the sand and soil of the Mississippi valley are continuously eroding and are carried into the streams, then rivers, the Mississippi, and finally to the Gulf of Mexico.
Another significant factor is the movement of the Earth’s tectonic plates. The Earth’s crust floats on top of molten lava and is about eighteen miles thick. But the crust is not a solid piece. It’s made up of “plates,” which keep floating and moving around. Where, for example, two plates meet, like at the infamous San Andreas fault line, unpleasant things start to happen. One, they meet head-on, like in India-Nepal-China, where the tectonic plate of the Indian subcontinent crashes into the massive Asian continent. There it meets incredible resistance and Voila! Mount Everest and K2, and the other mountains and countryside around keep growing about half an inch per year.
One last item is “the spring back effect.” During the last ice age, parts of North America, Europe, and Asia were covered by ice as much as one mile thick or more. It sucked so much water out of the oceans that it created a land bridge from Asia to North America. The weight of this massive ice crushed and compressed the Earth for tens of thousands of years. But, like a spring, the land is still recovering from the disappearance of the glacial mass and slowly expanding and springing back up. While scientists try to figure out if the seas are rising or falling, one or two millimeters per year, they have to sort out for all of these factors. Besides, they also have to contend with the fact that tidal gauges also get banged around by novice boat captains like us. Fortunately, more reliable satellite data of the last forty years confirms this rise of about one to two millimeters per year before any of these complex adjustments are made. The journal Nature, January 2019,[xvi] did an excellent job discussing these adjustments in detail.
THE BOTTOM LINE IS THAT ACTIVISTS GROSSLY DISTORT THE EFFECT OF MANKIND ON SEA LEVEL.
[i] https://sealevel.nasa.gov/understanding-sea-level/global-sea-level/thermal-expansion
Thermal Expansion | Global Sea Level – NASA Sea Level …. https://sealevel.nasa.gov/understanding-sea-level/global-sea-level/thermal-expansion
[ii] https://www.engineeringtoolbox.com/water-specific-volume-weight-d_661.html
[iii] NASA Sea Level Change Portal: Thermal Expansion. https://sealevel.nasa.gov/understanding-sea-level/global-sea-level/thermal-expansion
[v] https://www.answers.com/Q/How_many_days_a_year_is_Antarctica_above_freezing
[vi] 2.2: The States of Matter – Chemistry LibreTexts. https://chem.libretexts.org/Bookshelves/Introductory_Chemistry/Book percent3A_Introductory_Chemistry_Online!_(Young)/02 percent3A_The_Physical_and_Chemical_Properties_of_Matter/2.2 percent3A_The_States_of_Matter
[vii] https://climate.nasa.gov/news/2361/study-mass-gains-of-antarctic-ice-sheet-greater-than-losses/
[viii] Study: Mass gains of Antarctic ice sheet greater than …. https://climate.nasa.gov/news/2361/study-mass-gains-of-antarctic-ice-sheet-greater-than-losses/
[xi] USA Today on March 26, 2019, “….Natural cyclical cooling…”
[xii] https://historyofmassachusetts.org/how-boston-lost-its-hills/
[xiii] Quantifying uncertainties of sandy shoreline change projections as sea level rises, January 10, 019
https://www.nature.com/articles/s41598-018-37017-4
[xiv] https://www.earthmagazine.org/article/mississippi-delta-drowning
[xv] Morrison’s Island Public Realm and Flood Defence Project. https://s3-eu-west-1.amazonaws.com/arup-s3-lower-lee-frs-ie-wp-static/wp-content/uploads/lee_valley/Morrisons-Island-Appendix-C-Transport-Assessment-Report.pdf