I cant’ resist so here we go…
Its the worst ever right? We are all doomed!
Let us start in the tropics:
For the US it’s been another high-impact season and the season is not done yet, But then again we were screaming that from the rooftops in the spring,
This was put out in early April and I let CFACT readers see it April 23
https://www.cfact.org/2021/04/23/bastardi-forecasts-dangerous-2021-hurricane-season/
its not just total numbers with willy nilly storms that get named too fast and stay on too long IMO. We are talking about hits on the US coast. But even there its remarkable that for the first time I can find, there were 5 tropical storm hits before a hurricane, And the ratio of named storms to hurricanes is near a record spread which goes to show how mamsy pamsy alot of these are. And the ACE index/storm is a tad over 5. Granted it is currently about 120% of average, but hardly anything to go wild about.
The numbers are amazing, The ratio for named storms to actual hurricanes is 3 to 1 Normally its about 1.5 to 1 ( IOW. we have had 19 named storms, only 7 of them hurricanes! This is because every Tom Dick and Harry storm gets named. It is an argument for a two-tiered SEASONS, 9 of these features had an ACE index total of 1 or less!! UNLESS THEY HIT SOMEONE, THEY WOULD HAVE NEVER BEEN SEEN BEFORE.
We have had 2 big back-to-back impact seasons and both were seen by my company in April actually showing people where they would go. After an embargo, we put them on here on CFACT. so when I say these things I don’t sound like a pompous I told you so after the fact arse, but simply say we showed you and it was there. I call it IMPACT because we show people where they will go. So lets go over what that blog above had,with this preseason map this year
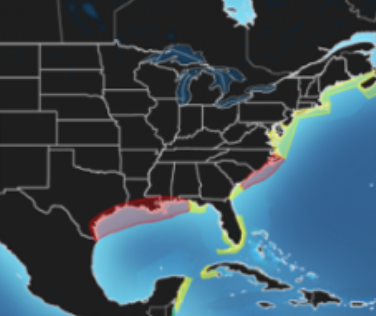
The red is 6x above average the yellow 3 x
Season so far in relation to the US ( not over yet)
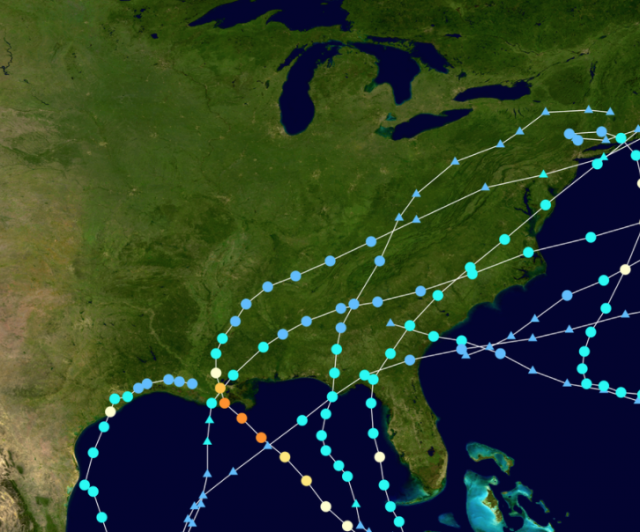
the place that is underachieving is the Carolinas but there should be an active end game out of the Caribbean this year putting FLA and the east coast at risk,
As far as number, notice how much more we do than just number of storms ( this first came out in March!)
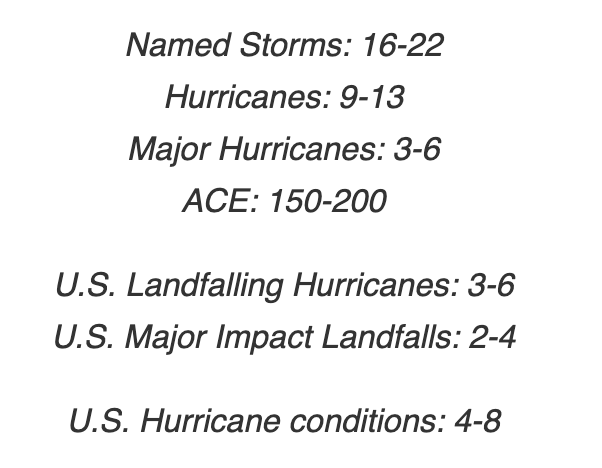
We have to jack up numbers cause of all the willy nilly storms that get named. I mean look at this Teresa and Peter
.png)
.png)
When I was a kid I saw stronger storms in the bathtub when it was draining. ( okay I admit it I still create Sud-storms now)
Peter did affect people though. Some sand castles took a beating with Peter and there were reports of sunburn from more sun since there were no clouds with the storm when it was 75 miles away that people expecting what a tropical storm 75 miles away would do ( its because it wasn’t one, it should have been downgraded long before) got caught in the sun. There were rumors of trouble flying kites on the beach from lack of wind.
When I make a forecast now, I have to skew numbers to adjust for storms that would have never been named in previous years. In the 50s. there was an average of 11 storms, but 7 would be hurricanes. Now the ratio is over 2 to 1 because of all the naming, The media then goes wild along with people pushing this ( more storms). but more are weaker. And the big ones like Ida are not nearly as large as far as the width of strong winds as ones in the older days, Ida can’t compete with a Betsy nor could Harvey compete with Carla as far as size-wise. Maybe at the center, they are just as strong but they are not as extensive. It is why my power and impact scale which takes into account the areal coverage of a storm should replace Saffir Simpson. I will rehash that in another blog.
But the DEBUNKING DAISY here is how weak these storms are overall. We are setting a record for most weak storms ( ACE index 1 or less). Last year we had a lot of weak storms named too. I am not arguing we should not name them, but it is a false equivalency trying to compare this to previous days. The real metric is the size and intensity of hits on the coast. Even then it is skewed since for example south Florida in the 1940s when they were slammed 8 times by majors has much more in the way now if even half of that decade occurred. All this is lost on the public as they hear tails of how bad it is.
how about this DEBUNKING DAISY
The amazing stretch of no hurricane hits on LI or southern New England continues. In the days before climate change, 1938-1991 we averaged 1 every 7 years. Despite even my most valiant attempts with Henri, we have not had one this year. Meaning 1 out of 7 has been 0 out of 30, Which is good for all the climate hysterics out on the Hamptons and Marthas Vineyard, though their day is coming and when it does, you can bet what I have just shared with you will be ignored. ( I am still concerned it could happen this year. I thought Henri would be the one but it fell apart)
DEBUNKING DAISY
In the west Pac, the least typhoon activity on record since 1944 in August and I suspect Aug/Sep back to back is the same. Now, this is a climate signal IMO. For the lack of activity there has huge implications as far as the global pattern. And it has huge implications to the economies and well-being of people living in the far east. Of late 2 Super Typhoons ( they average over 7 a year). have developed but have fallen apart before impacting land or simply did not make landfall. The Eastern Pacific is below average as is the northern hemisphere and for the second year in a row so is the global activity, But all we hear about is how bad things are for the US, Gee isn’t this a global problem, why aren’t we looking globally? Because it would reveal how bankrupt the missive that storms are getting worse is, I wrote about the reason this is happening in a previous blog and for those of you at the Heartlands conference in a couple of weeks, it will be part of my presentation.
What about the horrid Wildfires?
DEBUNKING DAISY
The Number of wildfires is slightly below average, acreage burnt about 85% of average. That 10-year average is only 25% of the average acreage burnt in the 1930s. Any perspective there? Yet we had a record number of level 5 alert days, That has to be because of where they are showing up, where there are people and infrastructure. But if it was. 90 years ago, this season would be less than 25% of the average.
Severe weather
DEBUNKING DAISIES
Tornadoes and Wind Damage reports are well below average
.png)
.png)
Hail is lowest
.png)
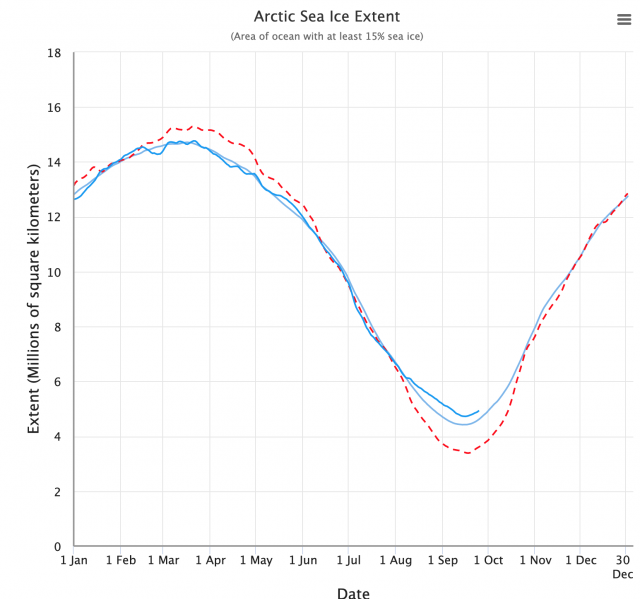
Arctic Sea Ice
Whatever happen to the ice cap gone missive?
That missive is what is gone
DEBUNKING DAISIES
its nowhere near the record low in 2012 and above the 10-year mean
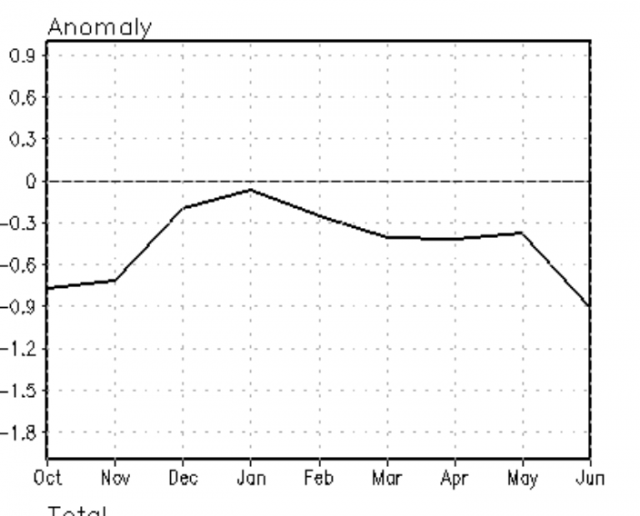
Speaking of the arctic all the warming is in the winter which has a direct correlation to increasd WV not co2. Look at the summer. How is average temperatures which are near 1C, hot? It is not hot, it’s not even above the average. It’s actually a bit below in many years ( red line). It is averaging 5 above in some winters. But that means instead of being near -30C its near -25C. According to the left -25C is hot since they talk about how hot it is getting in the arctic.
.png)
and that is EASILY EXPLAINED. by looking at temperature correlations with increased water vapor. An increase of only .2 gram/kg ( that’s POINT 2) correlates to a 10 degree higher temperature where it’s -40C! notice around freezing (0C) it takes much more
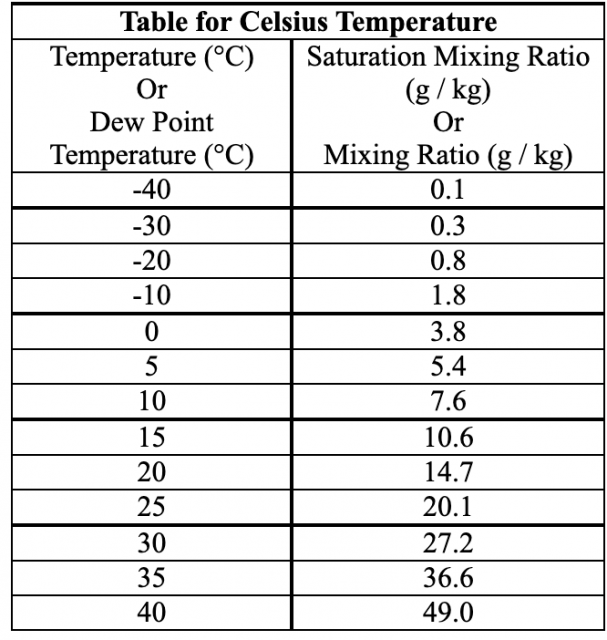
Now why no correlation with co2? BECAUSE THERE IS NONE. This is why the real metric to use to quantify and explain climate is the saturation mixing ratio because water vapor is the big kahuna in climate. But using that would expose the fact that this not the climate emergency tipping point they claim. That the other thing. How is a climate optimum in other eras a climate emergency now?
This would be a horror show for the left, though I trust no computer models, the return to average sea ice ( or near average)
speaking of 2012, that was the 3rd hot dry summer in a row and the new dustbowl was on the way. I blogged about it here with this DEBUNKING DAISY
https://www.cfact.org/2021/09/15/yet-there-is-no-dustbowl-in-fact-the-opposite/
You get the message, but one more DEBUNKING DAISY and then I will let you go.
Greenland, the Canary in the Coalmine? Above-average Surface mass budget (. aka snow and ice) this year again
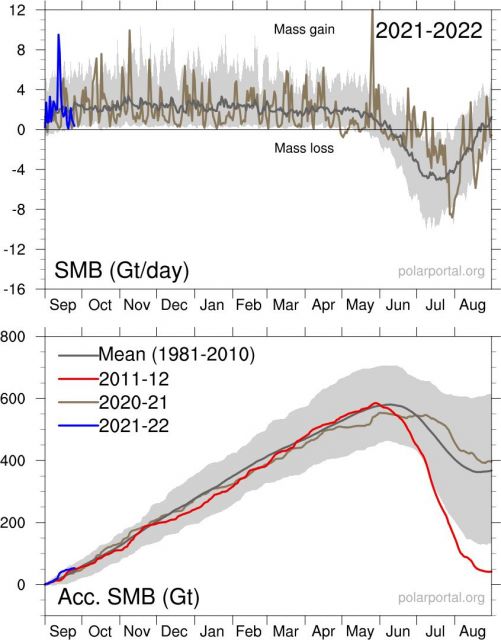
Its amazing how since 2012 the weather weaponizers have been shut up by abundant rain in the face of a new dustbowl and arctic ice, though nothing to brag about, coming back a bit as well. Greenland, where they love to scream about how it’s melting in the summer ( duh what other time of the year is going to melt) when one looks at the actual facts, has no such problem. The surface mass index is above average ( that’s snow and ice)
They do not care about right or wrong. Few revolutionaries do. They got the headline and then no accountability. They create a fake problem then say they can solve it all you need do is get in line and become a soldier in their phony climate war.
Which explains the cover of my book,

I am satirizing all these climate warriors in my fake Rambo get up, and I have a toy machine gun water pistol shooting daisies. BECAUSE IT IS NOT THAT BAD, AND ANY BAD THEY BRING UP CAN BE COUNTERED WITH GOOD. NOT ONLY THAT, THE BAD YOU SEE HAS HAPPENED BEFORE. So it is a phony war as far as weather and climate meant to take your eyes off the real war which is being waged on our way of life. They use the weaponization of weather to help dismantle the system that has made this nation the greatest on earth. A nation where people are clamoring to get in, and given the demographics, obviously don’t believe a word about that phony war on how rotten we are, since if you are trying to get in here, its because it has to be better than where you are leaving, But it is one thing after another, Climate is a brick in the wall they are knocking down. The best I can do is try to show the other side of the issue I know best and ask you to judge. The people that are supposed to fight this, ones that we have elected, or can get the facts out, no matter what their intentions, are failing
Harsh words, but what other conclusion can you have when you look at where we are today