- A very active season (in terms of total ACE) is on the table.
- The development of storms in non-threatening (for land) areas will add to the ACE total.
- A similar year in the pre-satellite, pre-warm era (since the Super Niño of 1997) would likely see 80% of our forecasted numbers.
- ACE per storm will again be below pre-satellite, pre-warm era values.
- The Euro Seasonal is not yet out to the heart of the hurricane season.
- We will issue impact numbers in April.
- Comment on Climate Change and the Tropics.
- Power & Impact statement.
Named Storms: 18-22
Hurricanes: 6-10
Major Hurricanes: 2-4
ACE: 140-180
Because the goal line keeps shifting on how we evaluate seasons, I have to make reference to “before” and “after”. I am using the blend of highest ACE years from 1998 and beyond and using the big ACE seasons to formulate the forecast.
The 500 mb chart in those years has this for the means for the June to October period:
.png)
Canadian:
.png)
CFSv2 700 mb forecast:
.gif)
What should stand out is the common denominator of higher than average 500 mb heights in temperate regions.
The SSTs:
.png)
Those year also favor La Niña. The CFSv2 this year:
.gif)
Canadian:
.png)
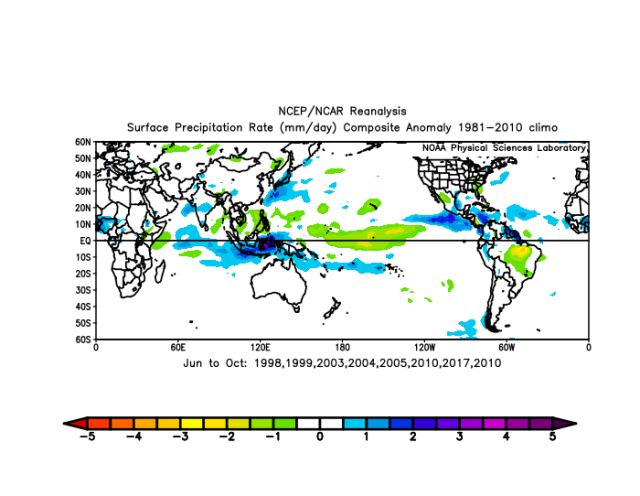
Precipitation:
Canadian:
.png)
CFSv2:
.gif)
What jumps out is the heavy precipitation around Indonesia.
Sea Level Pressure:
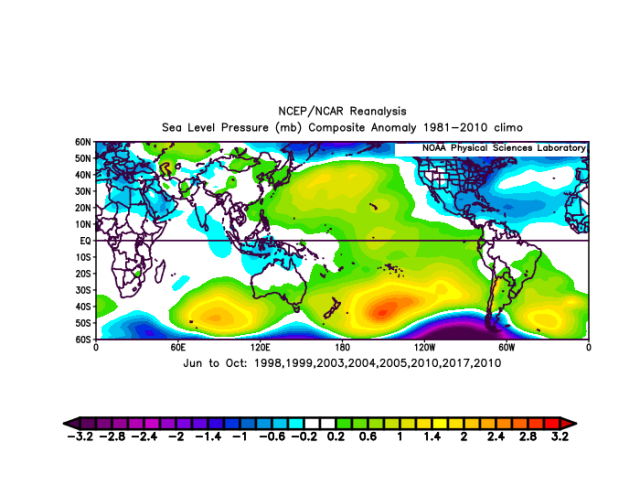
Canadian:
.png)
While in agreement over the U.S., the central Pacific pattern is not “perfect”. Consequently, there are limiting factors to getting a Super ACE season (over 200). Most notable are the SST and SLP configurations. They favor more, weaker storms. With all the low pressure over the Gulf of Mexico, the implication is for more than normal activity there also, but we will handle that with the impact forecast update next month.
Note on the changing climate
Climate change of course is a big issue. The warmth of the western Pacific and eastern Indian Ocean as well as the warmth over Asia is leading to stronger than average easterlies and the encouragement of La Niñas, or at least the blunting of El Niños. Consequently, the western Pacific has been running less than average and so the Atlantic has to pick up the slack. However, with all the warmth in the middle to northern Atlantic, this too distorts the pressure pattern and inhibits large, long-tracked storms. Smaller spin-up storms in the Atlantic and in-close features become more common, though. We have not seen a long-tracked storm hit at its peak in many years. Irma was off her peak, for instance, and even the storms in 2008 were. However, smaller compact storms that deepen in-close have been the majors that have hit the U.S. I think you will see all of these global trends occurring again in 2022.
Note on the Power and Impact Scale
The biggest differences between our analysis and others out there are the proprietary Power and Impact scale, which has been close to 10 years in the making. It provides an idea of what will happen beyond just the number of storms. The Power and Impact Scale helps our clients (and anyone else who will listen) by giving something more than using a set wind speed for a set amount of time at sea level. Remember both Charley and Carla were Saffir-Simpson Category 4s, but there was a huge difference in the nature of the two. Carla was a monster bulldozer while Charley was a fist of fury. On our scale, there was a huge difference, as Charley would have Category 4 winds and pressure, as Carla would, but Carla would have a Category 5 wind diameter (Charley was a Category 1 in both).
I use Sea Level Pressure and reported wind speed using the Safir-Simpson scale. Pressure tendency is also a factor as rapidly deepening storms will have their P&I category increased. With a weakening storm, it’s the opposite. The reason for this is rapidly deepening storms likely are tightening up quickly with almost perfect alignment between the lower and middle levels of the atmosphere, promoting the transfer of the strongest winds just above the surface down to the surface. Weakening storms are the opposite, as a weakening storm likely has competing processes occurring. The new variables added in the last few years were the radius of Hurricane and Tropical Storm force winds. For tropical storms, a diameter of 100 miles is a P&I Category 1, 200 miles a P&I Category 2, etc. For hurricanes, it is half that.
An example of something like this is a storm like Sandy. It had Category 1 winds and only slight filling (944 mb to 948 mb) in the last 6 hours before landfall. So that was a push. Its pressure was a strong Category 3 (assigned a Level 3.75). Hurricane-force winds were in a 200-mile diameter, which was like a Category 4 while tropical storm force winds were 500 miles out (a Level 5). The reason for this is intuitive as the greater the diameter of strong winds the more energy is available to increase wave action and enhance storm surge.
Another variable for speed of movement can contribute to the description along with the rainfall factor. Less than 5 mph movement would be a Level 5, 6-10 mph a Level 4, 10-15 mph a Level 3, 15-20 mph a Level 2, and greater than 20 mph a Level 1. So Sandy on this scale was a major impact hurricane with a P&I – 3.7.
I have put a lot of work into it and feel that for our clients it is more descriptive of what you will face with a storm.