Hopefully, you have read Part 1 of this series; if not, read it here so this essay will make total sense. We think we have found a way to disabuse folks from the exaggerated human-caused global warming and climate change fraud that has swept the entire world. Last week in Part 1, we showed clearly that we humans and our carbon dioxide emissions have no measurable impact on our Earth’s thermostat. In addition, we talked about the role of our sun in our solar system due to complex-sounding, but straightforward forces such as the Total Solar Irradiance (TSI), and Galactic Cosmic Radiation (GCR).
Here today, we will describe the impacts of forces you have heard of, but do not really understand. Admit it, you don’t.
Sunspots
The easiest way to tell if the sun is in a high or low magnetic activity period is to count the number of sunspots on the sun, and their historical record count is shown in Figure-3a, and a more recent-detailed record in Figure-3b.
First, look at Figure-3a from 1650 to about 1700, called “The Little Ice Age,” and the “Maunder Minimum” in particular. There were practically no sunspots at all for almost 50 years. And during this Maunder Minimum, the Earth experienced the coldest temperatures since the end of the last ice age, about 10,000 years ago.
Look at the “Dalton Minimum,” again a freezing period with few sunspots. In Figure-3b, we see a sustained period of high solar magnetic activity from 1940 through about 2000. Many reputable scientists say that the Earth entered a “Grand Solar Minimum” starting in 2019, with near-zero sunspots in 2020 and very few in 2021. Many of these scientists are forecasting another cold period like the Little Ice Age, lasting about as long but not as cold for reasons this paper explains. [f][F] To learn more about the current Grand Solar Minimum, read this article, written by the scientist who first predicted it, titled “Modern Grand Solar Minimum will lead to terrestrial cooling.”
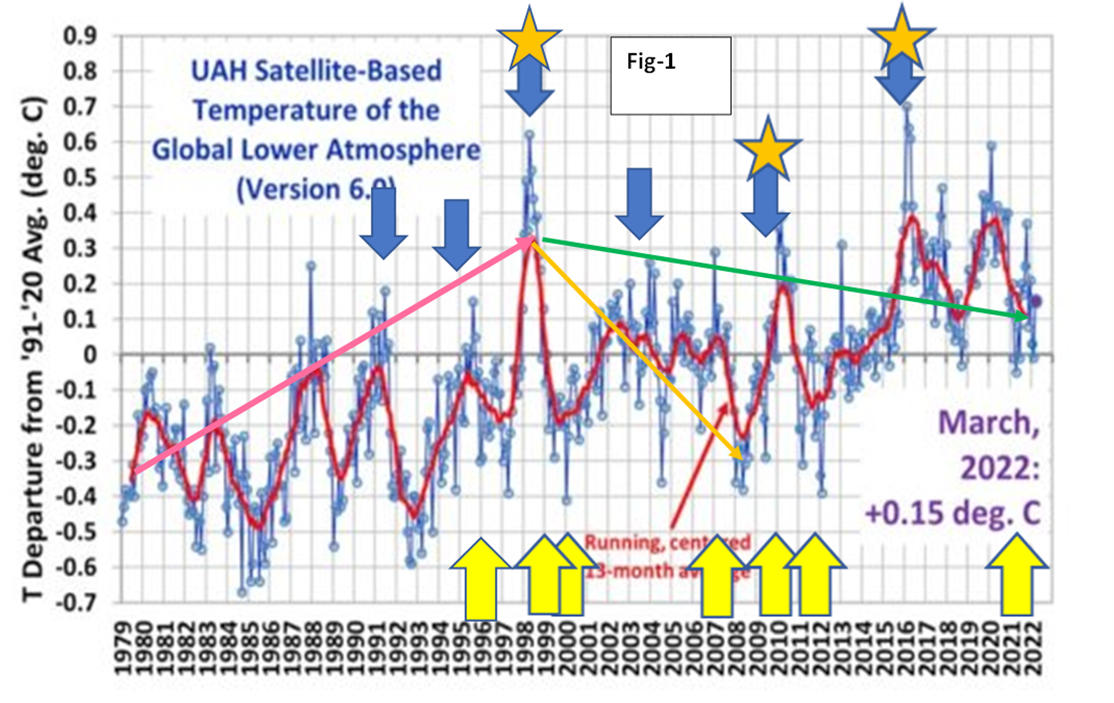
Now, look again at Figure-1 and note the particular gold arrow temperature trend line. From 1999 to 2009, nearly all of the temperature increase of about 0.8ºC from 1979 to 1998 was wiped out, which means no global warming since 1999. But then what happened after 2009? The solar activity continued to decline, but other powerful forces from within the Earth overcame the solar decline and warmed up the planet. Let us look at each of these factors in detail.
El Niño/La Niña
One of these is the well-known El Niño that, when it occurs, warms a wide swath of the Pacific Ocean and the air above it. However, there is also a counterpart called La Niña, and when that occurs, the planet cools. As seen in Figure-4 [g][G] the El Niño’s are warming events above the zero baseline, and the La Niña is the cooling event. The index shows 6 powerful/warm El Niño years since 1990.
These powerful El Niño years are marked in Figure-1 with blue arrows, contributing to warming the planet. We also note in Figure-1 the up-pointing yellow arrows marking the cooling effect of the 7 cold La Niña years. For many years it was accepted orthodoxy that these El Niño/La Niña events were due to climactic circulation patterns in the ocean and atmosphere. However, this has been dispelled by evidence that the El Niño and La Niña are one continuous geologic event in recent years. Meaning, they are caused by increased or decreased tectonic/volcanic activities in the deep ocean floors where the crust is the thinnest, [H][h] and humans have little knowledge of when, where, and how powerful [I][i]. We know this is new to most readers, but you can take it to the bank and cash it.
Volcanic/tectonic heating
Mounting evidence demonstrates that volcanic activities have contributed to climate change. This is mainly from unseen and undetected activities in the deep oceans and under the ice sheets in Greenland and Antarctica. [j][J] In Antarctica, 91 new volcanoes were recently discovered on the western side and the Pine Peninsula. This is where all the dramatic videos are taken of ice cliffs crashing into the sea, making it a major tourist attraction.
The total number of known volcanoes under the Antarctic ice is now thought to be 140. In Greenland, recently, an enormous tectonic plume was discovered, which has been melting the bottom of the central ice sheet and warming the ocean waters between Greenland and Iceland.[K][k] We also have a significant deep-sea volcano only 300 miles off the Oregon coast. It has erupted at least 3 times in the past 25 years: 1998, 2011, and 2015. [l][L] The golden stars mark these in Figure-1.
In Figure-5 [l], [M][N], we see that over the past 200 years, the Earth’s volcanic activities have been increasing. This has been especially true since the 1950s. While the chart is based on land volcanoes, we now know that as many as 80%are located under the oceans and glaciers, meaning the actual number is far greater than shown on the chart.
Figure-5 also shows there has been no significant increase in the number of large volcanic activities. NASA has also said there has been no significant increase in notable volcanic activities. However, NASA remained silent on the substantial increase in the smaller volcanic eruptions and the millions of deep ocean gas vents.
Most people are under the impression that volcanoes will cool the planet as they release heat from the Earth’s interiors. While that is partly true and the dramatic, explosive volcanoes like Mt. St. Helena tend to cool the Earth, while the flowing basaltic volcanoes (in Hawaii, Greenland, and Antarctica) are more commonly found under deep oceans and contribute significantly to warming the Earth.
Geologist Peter Langdon Ward provides a robust case that volcanic and tectonic activities make up a significant portion of the Earth’s temperature.[o][O] Also, in 2011, the National Oceanic and Atmospheric Administration (NOAA) made the bold statement published by Scientific American that the Earth’s volcanic and tectonic heating provides about half of the Earth’s total heat L[l]. The media/press failed to report on this fact, and NOAA continues to provide no further clarification.
Gravity vs. CO2 greenhouse effect
However, the above facts, data, and scientific explanations only explain tiny variations in temperature above a central baseline. In recent years, it has become fashionable within the CO2/global warming community to call it the “Missing Heat.” But we still have the central problem of the missing heat of about +18ºC. The CO2 alarmists would have us believe that the CO2/greenhouse effect provides the only logical explanation for this missing heat. Unfortunately, all of their “scientific reasoning” or CO2 conjectures is a backward projection from this premise. But recent, reputable papers have put forward that a more reliable explanation for this missing heat is gravity and the use of classical thermal dynamics, specifically the ideal gas law. [p][P] This is fascinating. Nikolov-Zeller found comparable empirical results by applying Principal Component Analysis on temperature and atmospheric data measured by NASA of the Earth, several planets, and moons. [q][Q] You need not understand the ideal gas law, only that there is real physics behind controlling the Earth’s temperature rather than the left’s efforts to blame it on us arrogantly.
In Summary
– Baseline global temperature. It would appear that the Earth maintains a baseline temperature caused primarily by solar activities, tectonic heating, and gravity.
– The short-term “global climate change” means slight variations in temperature around this central baseline temperature caused by; a) changes in solar activities and tectonic heat, b) variations of the Earth’s volcanic activities and El Niño/La Niña, c) variations in galactic cosmic ray flux, d) variations of the Earth’s volcanic/gas vents, e) variations in the Earth’s albedo (reflectivity), f) variations in other unknown factors and forces.
– Longer-term causes of climate change include; a) the Milankovitch astronomical cycles, b) changes in the volume/density of the Earth’s atmosphere, independent of its composition, c) significant changes in the ocean circulation patterns caused by the opening or closing of the continents, i.e., the opening of the straight between South America and Antarctica.
– One thing is for sure, CO2 does not cause any measurable global warming, whether the CO2 is human-made or nature-made.
IT IS TIME TO SLAY THE CARBON DIOXIDE EMISSION FRAUD, WHICH IS TRULY INTENT ON DESTROYING THE STANDARD OF LIVING THAT CAPITALISM HAS BROUGHT TO SOCIETY.
Sources and References
(We have cited all references here for both Parts 1 and 2, therefore not all references will be cited for in each part.)
————————————————————————-
A[a] Read “Why co2 and greenhouse effect do not cause global warming.” https://www.academia.edu/53293035/Why_CO2_and_the_greenhouse_effect_cant_cause_climate_warming
B[b] UAH Satellite global temperature, see details at https://www.drroyspencer.com/latest-global-temperatures/
C[c] NASA/NOAA adjusting/fudging global climate record. This article provides evidence of the fudging and adjustments made by NOAA to the surface temperature. The paper argues that absent these adjustments, we may already be a climate pause or possibly even a decline since the 1930s, https://electroverse.net/u-s-has-been-cooling-since-the-1930s/
D[d] TSI record last 50 years, https://www.reddit.com/r/climateskeptics/comments/9ft7s2/do_you_know_why_solar_irradiance_has_diverged/
E[e] Read the article “Geomagnetic Reversal: The Svensmark Effect Revealing the Impact of Cosmic Rays on the Earth,” Friday, July 5, 2019.
F[f] “Modern Grand Solar Minimum will lead to terrestrial cooling,” by Valentina Zharkova, https://www.ncbi.nlm.nih.gov/pmc/articles/PMC7575229/
G[g] El Niño/La Niña years 1990 – Jan 2022, https://ggweather.com/enso/oni.htm
H[h] El Niño-La Niña are caused by the Earth’s geologic activities and not heat circulation patterns, http://www.plateclimatology.com/why-el-nio-and-la-nia-are-one-continuous-geological-event/. See this article describing their cyclic nature. See paper titled “Seafloor Volcano Pulses May Alter Climate,” February 5, 2015, https://www.earth.columbia.edu/articles/view/3231
[I][i] “Deep Ocean Volcanoes,” https://oceantoday.noaa.gov/deepoceanvolcanoes/
J[j] Read the paper titled “Underwater thermal activities– an overlooked factor in climate change,” https://www.academia.edu/45639543/Underwater_thermal_activities_an_overlooked_factor_in_climate_change.
Also read the article, “Tracking down hydrothermal vents.” Read about volcanic activities in Greenland and Antarctica, and here. Read the article “Scientists Discover 91 Volcanoes in Antarctica.”
K[k] See the article “Greenland‘s ice is melting from the bottom up — and far faster than previously thought, study shows” by Isabelle Jani-Friend, CNN, February 22, 2022, https://www.cnn.com/2022/02/22/world/greenland-ice-melting-sea-level-rise-climate-intl-scli-scn/index.html
L[l] See, https://en.wikipedia.org/wiki/Axial_Seamount and https://www.academia.edu/49442870/The_Axial_Seamount_Nature_s_Response_To_500_Years_of_Cooling
M[n] Figure-5 chart from the Smithsonian Institute, https://volcano.si.edu/faq/index.cfm?question=historicalactivity.
[O][o] See the book by Peter Langdon Ward, “What Really Causes Global Warming.” And his detailed video presentation, https://www.youtube.com/watch?v=FPH7HPaNHTg&t=1922s
[P][p] See the paper “Planetary Core and Surface Temperatures.” https://www.linkedin.com/posts/douglas-cotton-b794a871_planetary-core-and-surface-temperatures-activity-6607066373015379968-WcRW/
[Q][q] See the paper “New Insights on the Physical Nature of the Atmospheric Greenhouse Effect Deduced from an Empirical Planetary Temperature Model.”