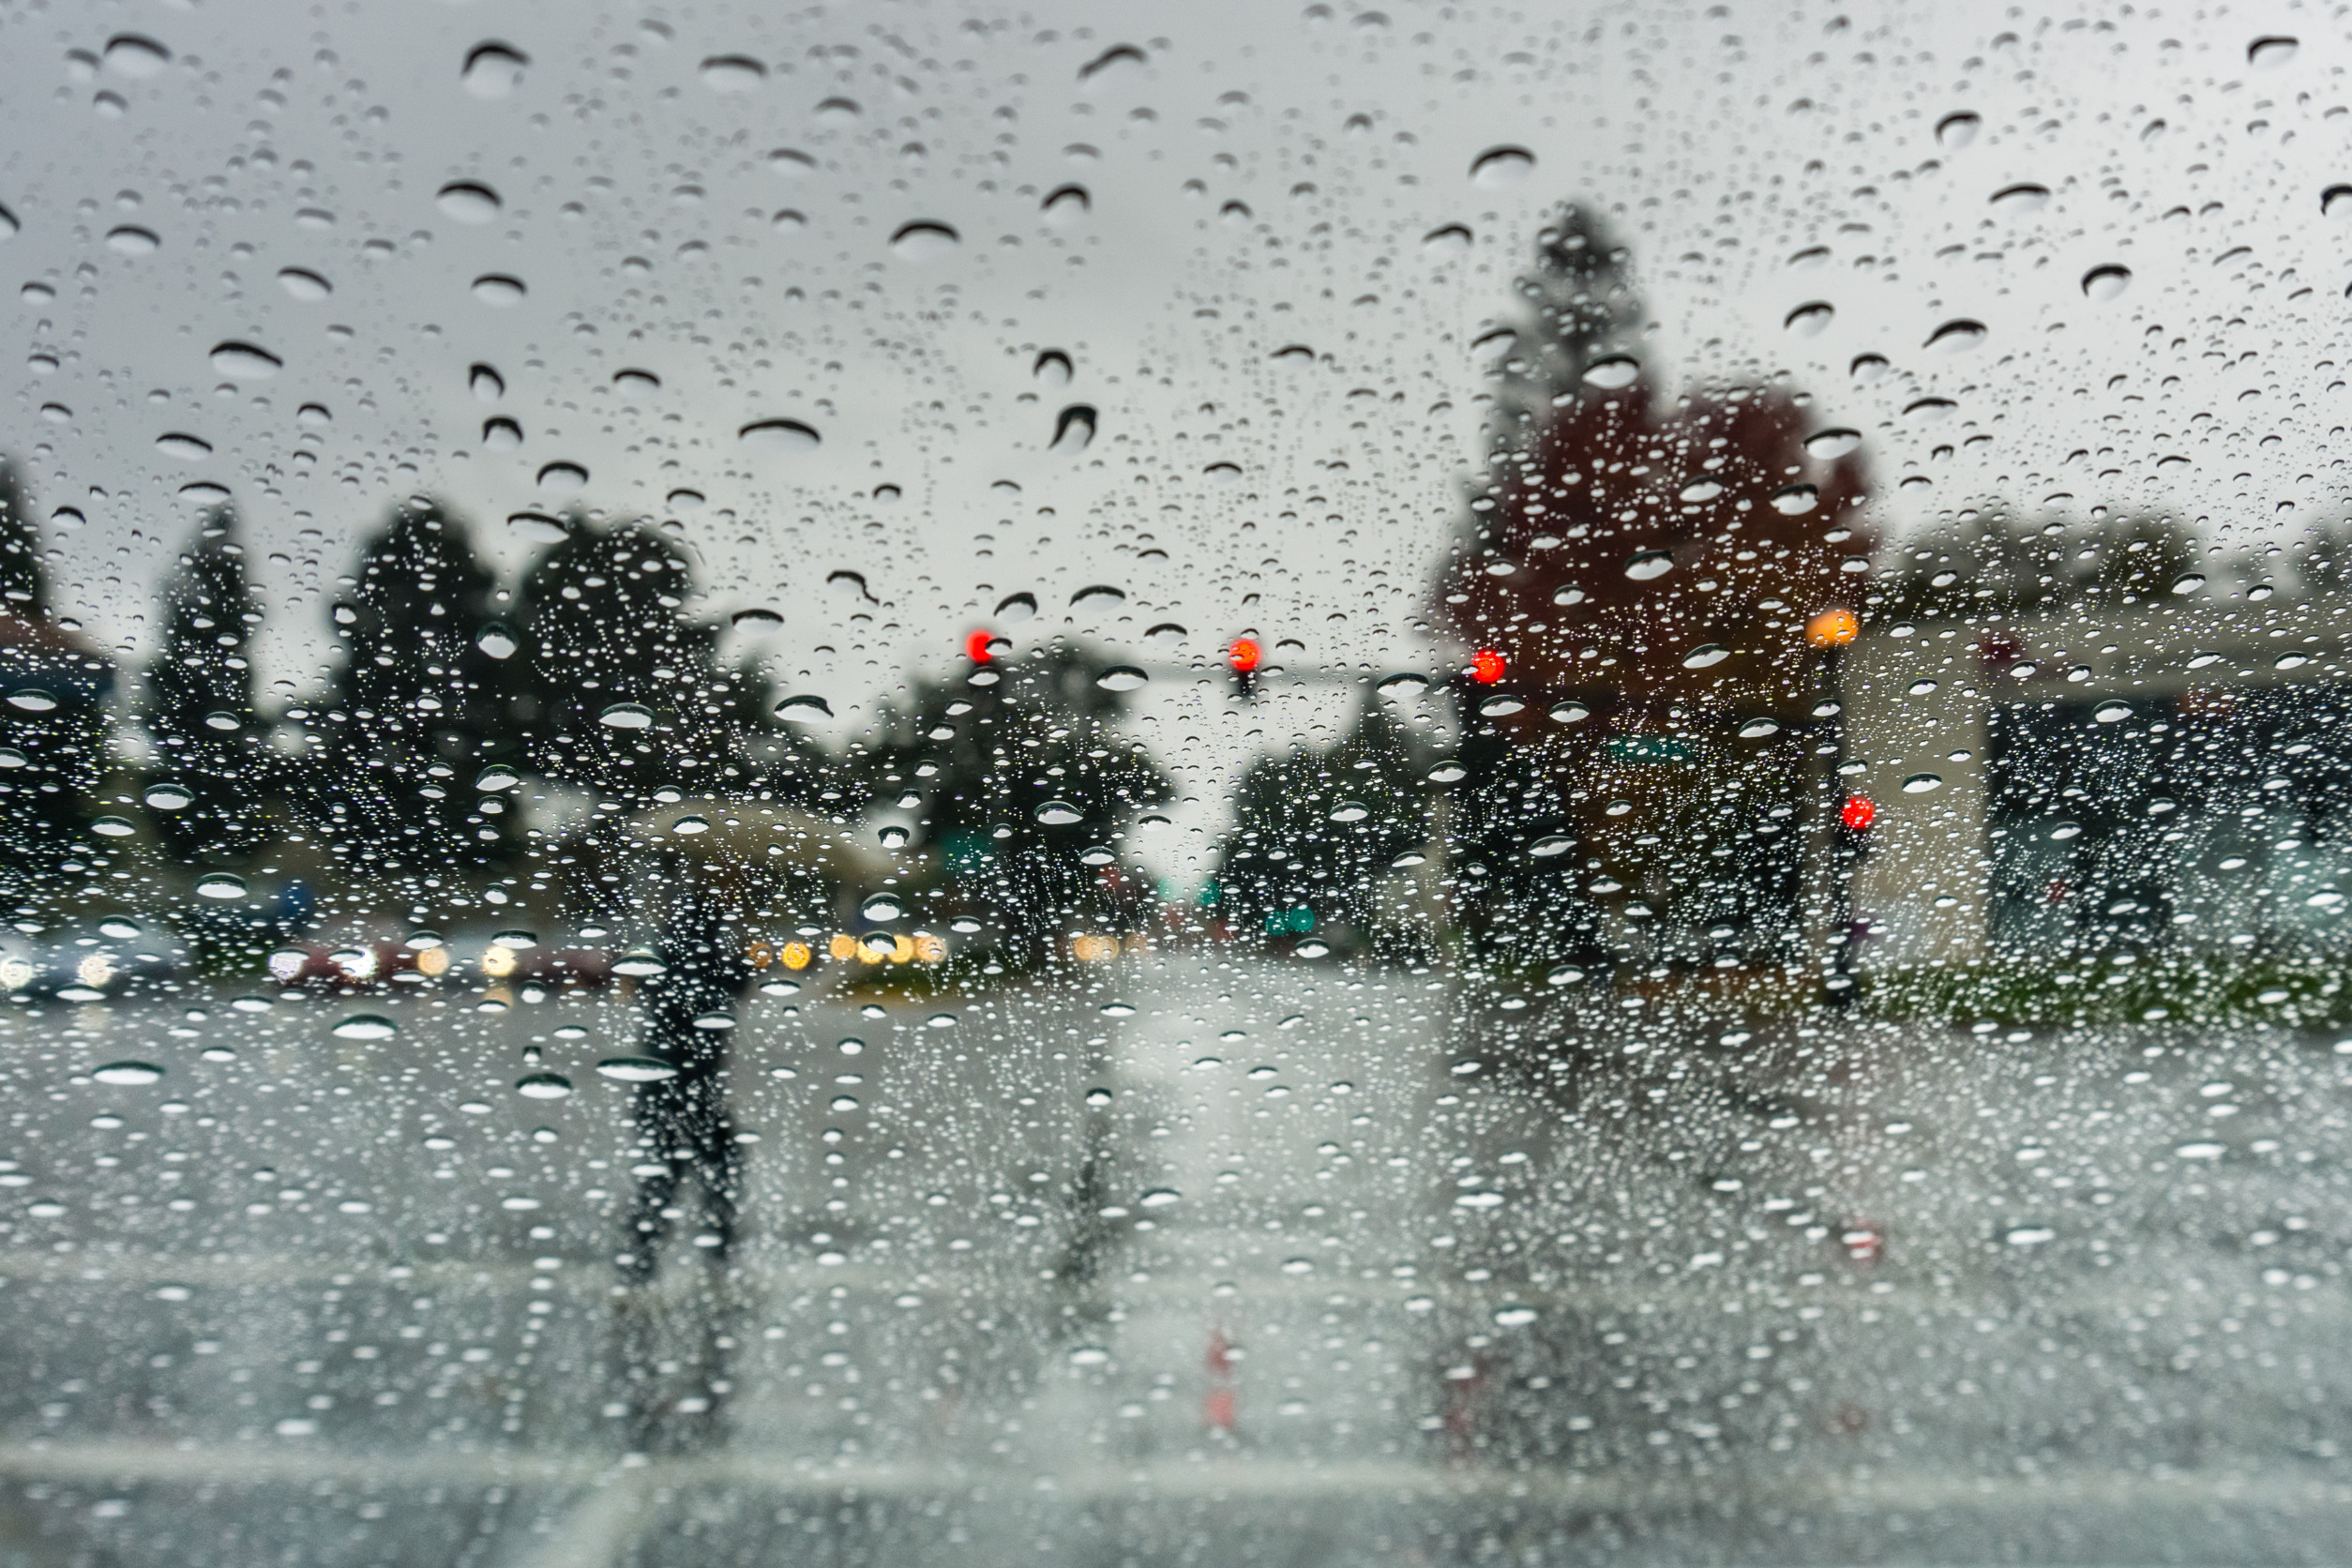
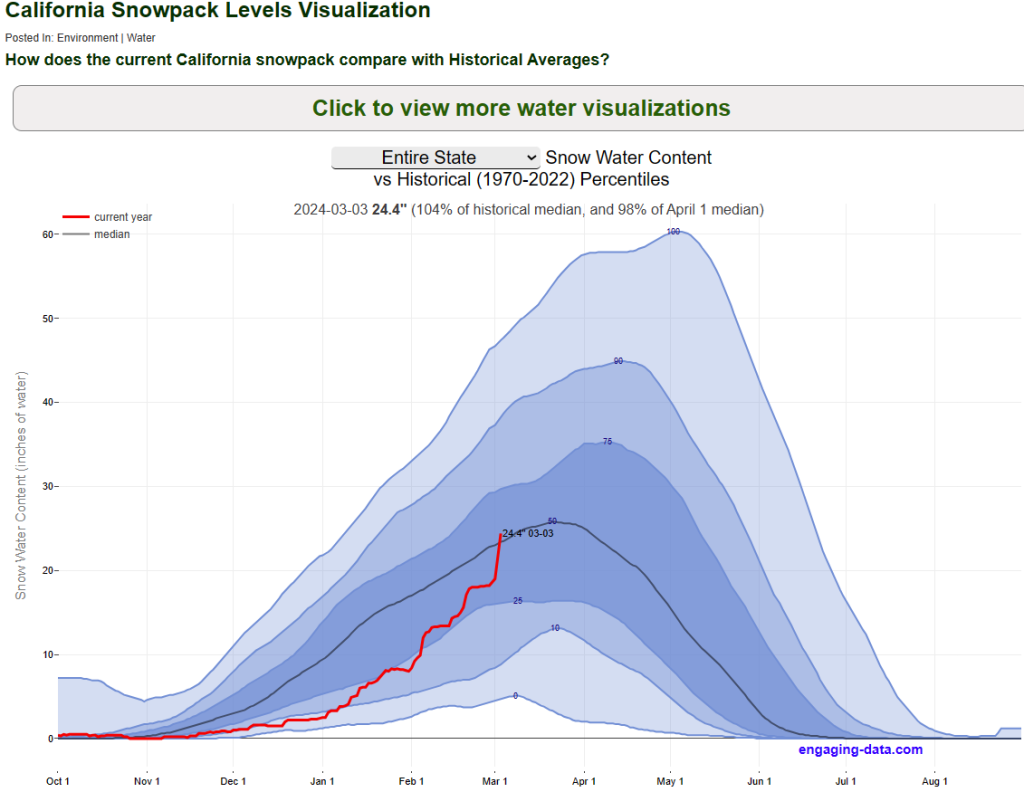
Since the end of January, California has been pelted by a series of atmospheric rivers bringing rounds of moderate-to-heavy rainfall for days on end, spurring hundreds of flash floods across the state, inundating roads and neighborhoods from the Bay Area to Los Angeles, and triggering several destructive mudslides. Each event has been separated only by a brief lull, providing Californians little relief from the deluge. Additionally, heavy upslope mountain snow in the Sierra Nevada has brought California’s snowpack—measured as snow water content—up to 104% of the 1970 to 2022 historical median (Figure 1) as of March 4th.[1]
The Meteorology
The recent boost in Sierra snowpack over the last few days was actually driven by a deep low-pressure area that originated in the Gulf of Alaska and then transcended down the Pacific coastline and into the Pacific Northwest. Pressure falls in the extratropical cyclone’s center increased the low-level convergence field, allowing the system to tap into the Pacific moisture and steer it inland through advection. Upon coming into contact with sloped terrain on the windward side of the Sierra Nevada, the moisture-enriched air was force-lifted up the mountain, whereby it was dynamically cooled to saturation, at which point the vapor could condense and precipitate back down into subfreezing air at elevations above 5,000 feet. Persistently heavy snow accompanied by >90 mph wind gusts prompted the National Weather Service (NWS) to issue blizzard warnings from last Thursday, February 29th, to Sunday, March 3rd, for the ski areas.
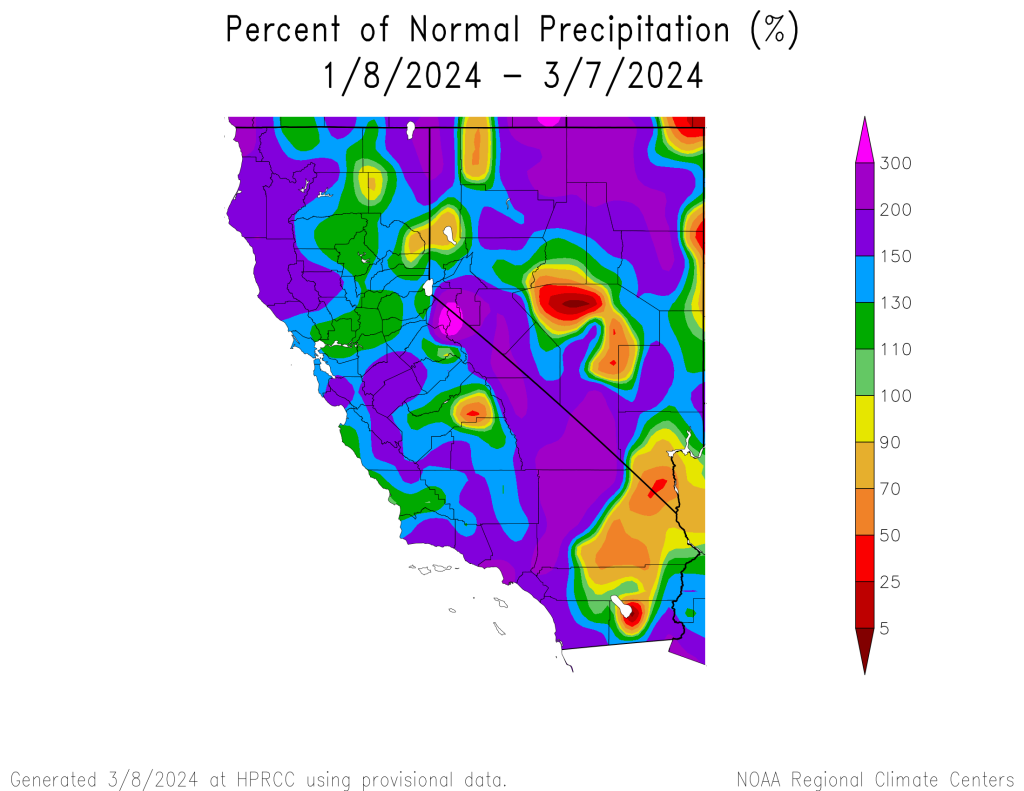
Within the last 60 days alone, large portions of Central and Southern California have received 200-300% of normal precipitation (Figure 2), as measured relative against 1991 to 2020 climatology.[2] Los Angeles recorded their fourth wettest February on record since 1878, with 12.66 inches of rainfall (more than three times their monthly average for February), and third largest two-day rainfall total of 7.03 inches ending on February 5th, only behind January 25-26th, 1956 (7.44 inches) and December 31st, 1933-January 1st, 1934 (7.98 inches).
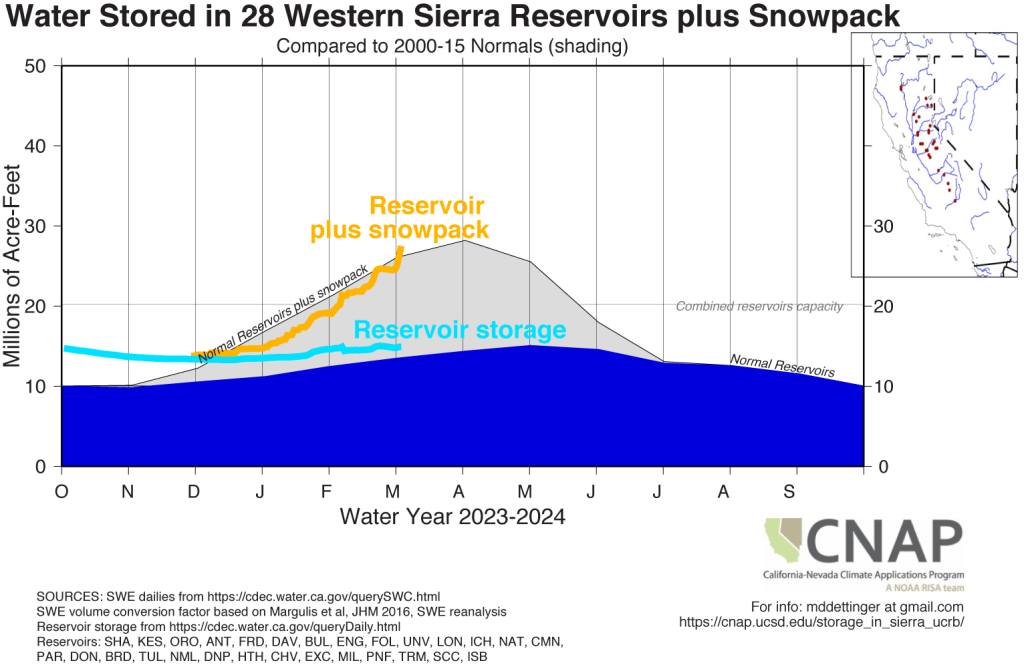
This surplus of precipitation comes at the heels of California’s significant multi-year “megadrought,” which came to an abrupt end last January following an intense string of atmospheric river events that waterlogged the Golden State, filling the majority of the state’s major water supply reservoirs to their highest levels since 2019, surpassing historical site averages, and brought the Central and Southern Sierra snowpack up to their highest levels on record since 1950. The theme continues this year as reservoir storage remains above average (Figure 3).[3]
The News Cycle
Of course, if one has paid any amount of attention to the news cycle over the past decade or so, recent weather patterns in California have been, shall we say, inconsistent with the messaging from climate scientists and members of the press. For years, experts have sent strident warnings about California [and the rest of the Desert Southwest’s] descent into a “permanent” megadrought (the worst in 1,200 years) with little to no relief for years or decades to come. Here are some receipts:
May 1, 2015: The New York Times [Opinion] – “The End of California” [4]
“Looking to the future, there is also the grim prospect that this dry spell is only the start of a “megadrought,” made worse by climate change. California has only about one year of water supply left in its reservoirs. What if the endless days without rain become endless years?… Artificial lakes filled with Sierra snowmelt will become baked-mud valleys surrounded by ugly bathtub rings. Some rivers will dry completely — at least until a normal rain year.”
Timothy Egan – May 1, 2015 (New York Times Opinion)
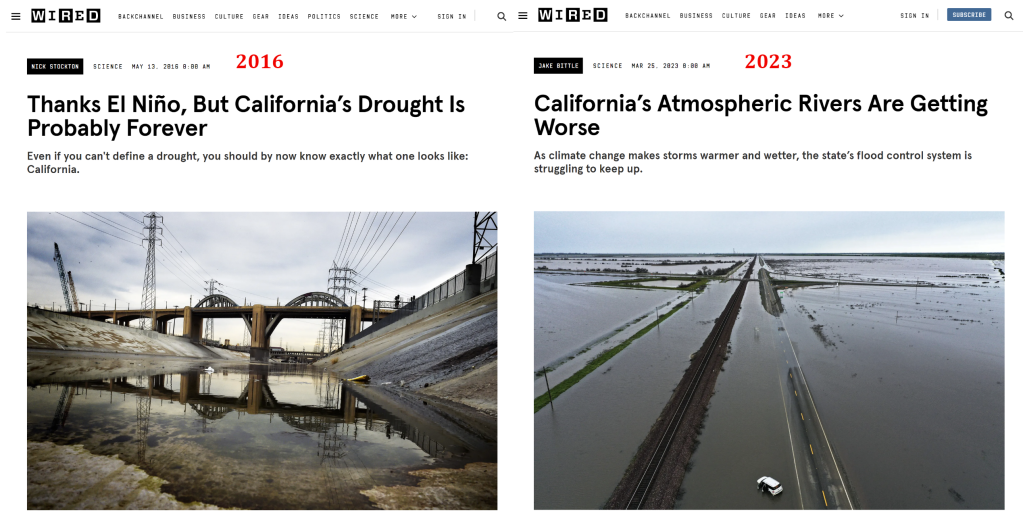
May 13, 2016: Wired.com – “Thanks El Niño, But California’s Drought is Probably Forever” [5]
“Despite the snow in the Sierra Nevada, the water filling Lake Shasta, and the rapids in the Kern River, California is still in a state of drought. For now, maybe forever.”
Nick Stockton – May 13, 2016 (Wired.com)
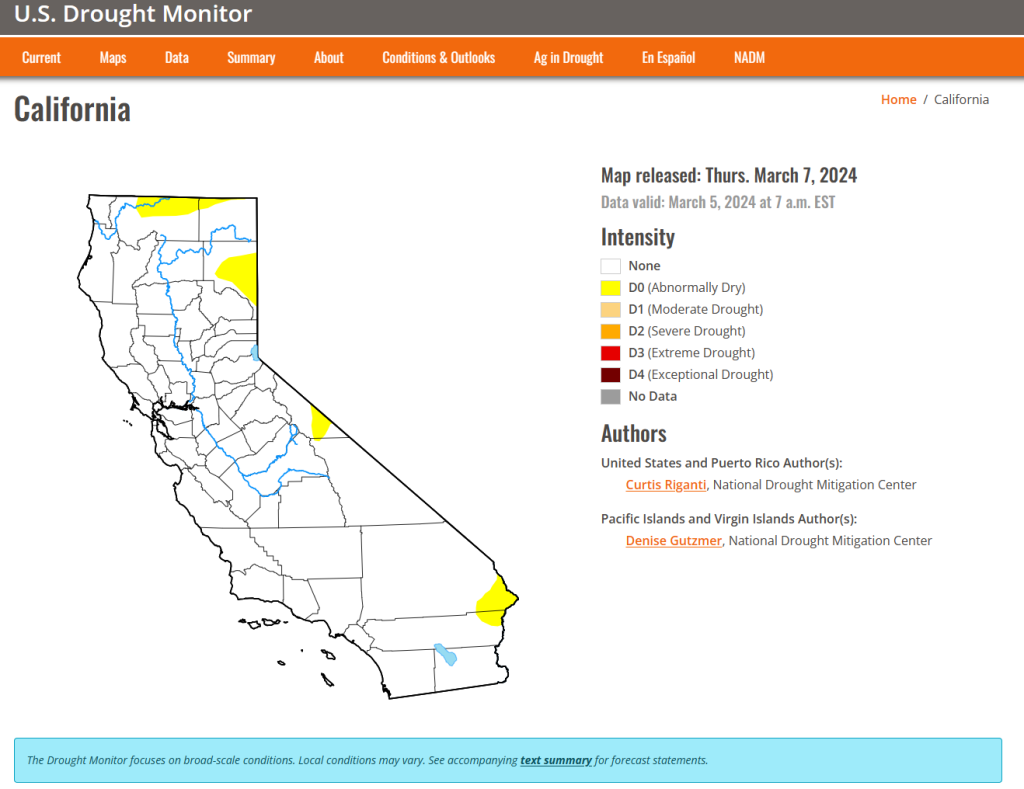
As of the March 7th update from the U.S. Drought Monitor,[6] it is clear California is no longer in drought—only a few locations along the Western Sierra and Oregon border are abnormally dry, and I would hazard to guess that some of that will erode in the next update (Figure 4).
Faced with the reality that these “forever drought” predictions from nearly a decade ago were woefully wrong, academics and their media mouthpieces have had one of two options, either:
- Admit that the “permanent drought” prediction was wrong, or,
- Change their tune quietly to say that human-induced climate change is making California wetter by “fueling” the atmospheric rivers that provide the bulk of the state’s annual rainfall budget and hope the rest of us don’t notice.
And, of course, the second option is the one academics and government scientists decided to go with (Figure 5).[7]
Gabrielle Canon from The Guardian, which might be better characterized as a virulently partisan left-wing British tabloid, recently wrote in an article[8] from three weeks ago,
“As the climate crisis supercharges storms over the Pacific, scientists are creating tools that can measure them from the inside.”
Gabrielle Canon, February 11, 2024 (The Guardian)
And, of course, we can’t forget the Los Angeles Times [9]
“But the powerful atmospheric river — worrisome enough on its own — is being supercharged by climate change and El Niño, which together are warming ocean waters, upping the odds of significant downpours and offering a preview of the state’s future in a warming world, experts say.”
Hayley Smith and Grace Toohey, February 2, 2024 (The Los Angeles Times)
Talk about a complete 180. Yikes.
So, instead of an unforeseeable end to the Desert Southwest’s climate-driven drought, climate change is now apparently “supercharging” atmospheric rivers over the Pacific Ocean, bringing drought-busting rainfall, flooding, and winds, which is the “new normal” for California.
So, let’s see if this is actually the case…
Is Climate Change Responsible for Fueling California’s Recent Atmospheric Rivers?
Before proceeding, it is important to define some terms. So, what is an “atmospheric river” anyway?
Contrary to some claims (e.g., here and here) that the term “atmospheric river” is a new buzzword manufactured by journalists to make the weather sound scarier, it is actually a legitimate scientific term that was coined in a Geophysical Research Letters (GRL) paper published in 1994, authored by meteorologists Dr. Yong Zhu and Dr. Reginald Newell from the Massachusetts Institute of Technology (M.I.T.).[10]
In essence, an atmospheric river can be defined as an extended, narrow corridor of strong horizontal water vapor transport that is most often associated with a low-level jet stream located ahead of an advancing cold front in an extratropical cyclone (Zhu and Newell, 1994).[10] [11] This bulk movement of vapor is likened to rivers because of their filamentary structure and potential to have a greater water flux than the Amazon River (Newell et al., 1992).[10] [11] Vapor transported by these “tropospheric rivers” frequently leads to heavy precipitation, deadly flash flooding, and destructive mudslides where the moisture-rich air is dynamically lifted and cooled adiabatically to saturation over sloped continental terrain.
To make matters worse, damaging wind gusts are a common byproduct of landfall of the parent extratropical cyclone. Divergence in the upper levels of the troposphere removes atmospheric mass from the center, resulting in rapid pressure falls that cause fluid parcels in the ambient environment to accelerate from higher pressures to lower pressures in the center of the extratropical cyclone. The resultant pressure gradient acceleration (PGA) results in a proportional increase in the horizontal wind speeds, and any random turbulent molecular motions instigated by frictional accelerations and shear stresses in the lower boundary layer may result in sudden gusts of wind that can knock down power lines, as was seen last week.
Now, considering the destructive potential of atmospheric river events, one might be naturally curious if human-induced climate change plays a role and to what extent if that is indeed the case.
I should prepend this discussion with the disclaimer that climate change itself does not cause any single weather event to occur. Climate is nothing but a statistical measure of various atmospheric state variables over a period of at least 30 years, preferably longer. The statistics may be organized into averages or “climate normals,” distributions, and extremes. Each provides some sort of insight as to the weather one might expect at any given point in space or time. As the old saying goes, “Climate is what you expect, weather is what you get.” Climate changes, both naturally and through man-made forcings, over a period of several decades. The equations of motion that physically explain how extreme weather phenomena occur do not change with the climatic base state.
So, the question becomes, how does a changing climatic base state alter specific characteristics of atmospheric river events? In this case, there are two facets that atmospheric scientists care about:
- Has there been a detectable increase in extratropical cyclone activity [and the accompanying intense winds] that atmospheric rivers are associated with in the observational record? How is this expected to change in the future?
- How has extreme rainfall associated with atmospheric rivers changed as the climate has warmed? How is this expected to change in the future?
In a nutshell, depending on which of the two key issues above are examined, we reach contrasting conclusions, showcasing the sheer complexity of the coupled ocean-atmosphere system. To elaborate, if we make the assumption that the planet continues to warm, extratropical cyclone activity and their associated extreme winds should wane, but extreme rainfall, on the contrary, should be enhanced.
Extreme Winds and Extratropical Cyclone Activity Decrease in a Warming Climate
Apart from mesoscale convective wind gusts produced by the dense, negatively buoyant, rain-cooled air sinking in thunderstorm downdrafts, the most extreme winds in the extratropics are associated with, well, extratropical cyclones. In a broad sense, these cyclones are baroclinically-driven, meaning that waves of low-pressure form in regions characterized by sharp temperature contrasts (baroclinic zones). Recall that by the equation of state, p = ρ Rd T, temperature, T, is directly proportional to pressure, p. Hence, temperature gradients are largely responsible for generating gradients in the horizontal pressure field that drive cyclogenesis and create what we observe as “wind.”
It is a well-known fact that the surface-level latitudinal temperature gradient between the Arctic and middle latitudes has decreased due to a process known as “polar” or “Arctic amplification” (e.g., Serreze and Francis, 2006; Serreze et al., 2009; and Rantanen et al., 2022), whereby the Arctic warms at a faster rate than the middle latitudes due to positive feedback loops that result from decreased surface albedo, a consequence of reduced sea ice areal extent.[12] [13] [14] This has emerged in our physical observations over the last 40 years. The gradual reduction in latitudinal baroclinicity has ultimately made the environment a little more barotropic in nature (i.e., a more homogenous horizontal near-surface air temperature distribution).
The implications of this are that the environment is becoming less conducive for extratropical cyclogenesis. All else being equal, this stipulation requires that intense surface wind speeds associated with extratropical cyclones undergoing rapid intensification (a process technically termed “explosive cyclogenesis”) and the occurrence of atmospheric river events both decrease as a function of time as the Earth’s atmosphere warms.
This position is fully supported by the United Nations’ Intergovernmental Panel on Climate Change (IPCC),[15] which is considered by experts to be the “Holy Grail” of climate science. They suggest that,
“…the number of ETCs associated with intense surface wind speeds and undergoing explosive pressure deepening are projected to strongly decrease in the NH winter (Seiler and Zwiers, 2016; Chang, 2018). The weakening of surface winds of ETCs in the NH is attributed to the reduced low-level baroclinicity from SST and sea ice changes (Harvey et al., 2014; Seiler and Zwiers, 2016; J. Wang et al., 2017a).”
IPCC AR6 WG1, Chapter 4, Section 4.5.1.6.3
Thus, one can reasonably conclude that any wind damage inflicted on Californian homes and businesses by the recent storms cannot be linked to human-caused climate change.
But what about extreme rainfall trends and projections? As you might guess, this is where things get a bit more complex as opposed to cut-and-dry.
Extreme Rainfall Totals Increase in a Warming Climate… or Do They?
The other characteristic of atmospheric river events that we must explore is whether or not intense rainfall totals that lead to flash flooding have increased with warming, particularly across California, and how extreme rainfall is projected to change in the future based on climate model simulations.
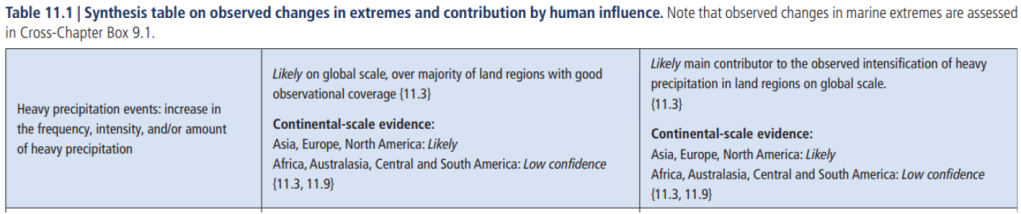
As the IPCC frames it in Chapter 11 of AR6 WG1, it is likely heavy precipitation events have increased in frequency and intensity over the global land areas, including but not limited to North America. It is also likely that humans have been the primary contributor to the “observed intensification of heavy precipitation in land regions on a global scale” (Figure 6).[16]
The IPCC goes on to say,[16]
“There is high confidence that average and maximum ETC precipitation-rates will increase with warming, with the magnitude of the increases associated with increases in atmospheric water vapour.”
IPCC AR6 WG1, Chapter 11, Section 11.7.2.4
However, it is interesting to note that while heavy precipitation extremes have, in general, increased since 1950 across portions of North America. This positive trend is not found in physical observations across California, presumably due to downturn in extratropical cyclone activity and/or a disconnect between physical reality and the assumptions scientists make in programming their computer models.
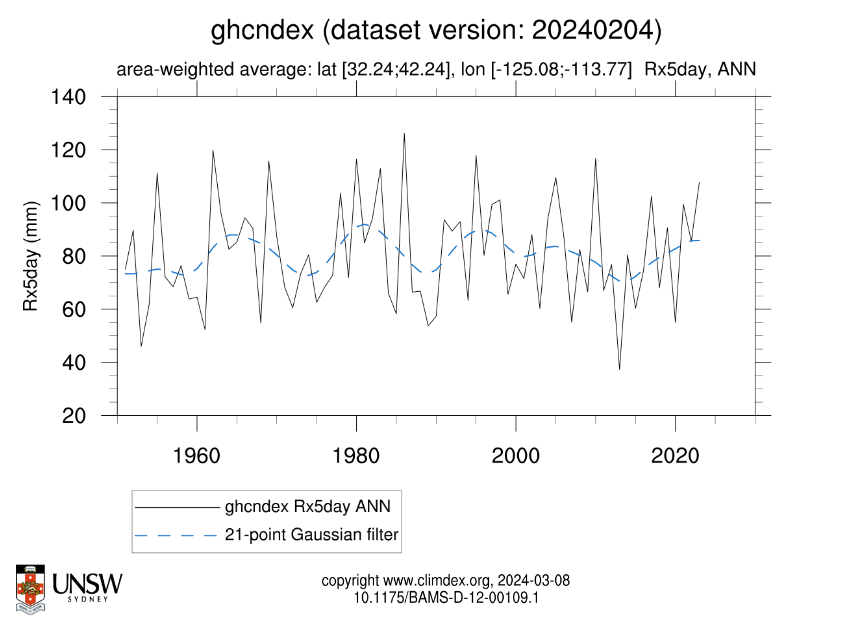
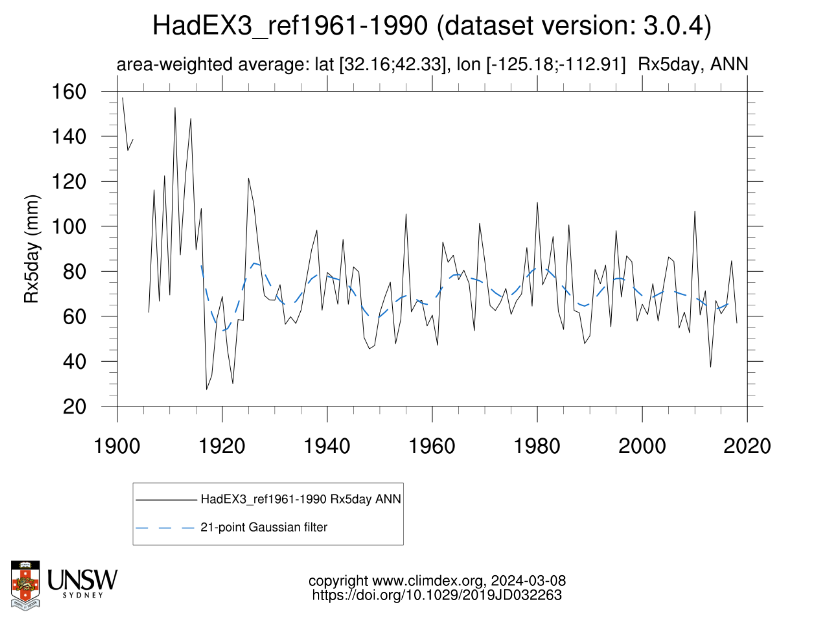
The gold standard for assessing temporal changes in multi-day precipitation (rainfall) extremes is to assess a given location’s wettest annual five-day period. Climdex data allows us to do this using a metric called Rx5day, which is commonly used in climate modeling. Placing a bounding box over California, I was able to generate a plot of the area-weighted mean annual Rx5day using gridded Global Historical Climatology Network-daily extremes (GHCNDEX) data from 1951 to 2021. Although there is a lot of year-to-year variability, no statistically significant trend is evident (Figure 7).[17]
Perhaps even more intriguing is that going back further to 1901 using HadCRUT3 data, the area-weighted annual mean maximum five-day rainfall trend has actually decreased (Figure 8).[17]
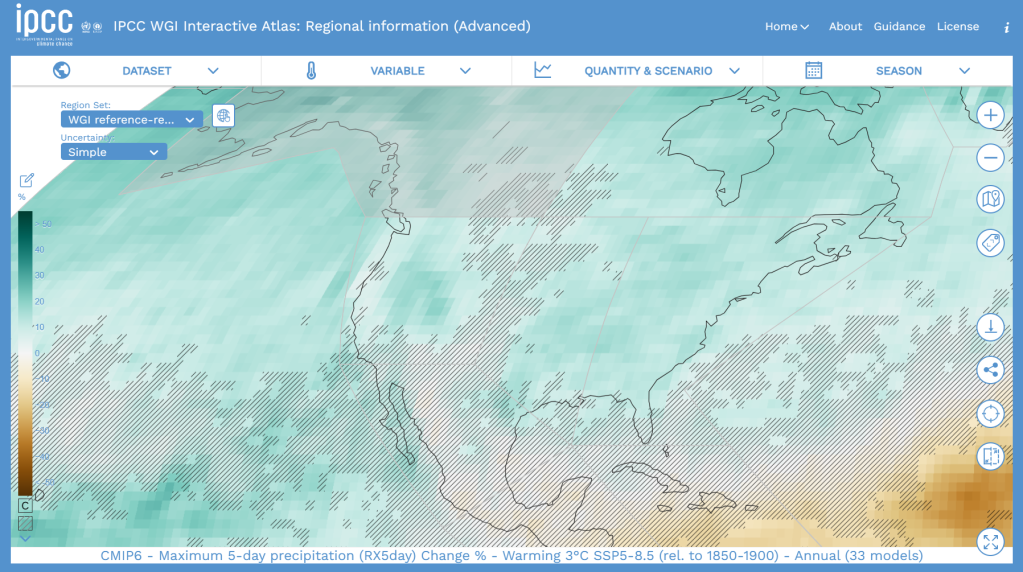
The significance of this is that while observations at the present time do not indicate an uptrend in Rx5day across California since 1901, CMIP6 model simulations for various emission scenarios, such as SSP5-8.5 (Figure 9), do show enhancement in that region, albeit by only a few percentage points relative to the 1850 to 1900 “pre-industrial” baseline.[18] There’s clearly a disconnect between what is modeled and what has been observed, thus highlighting the limitations of our modeling capabilities.
Another [and likely] reason for the disconnect between models and reality rests on the case of modelers’ assumptions about how heavy rainfall events should respond to increased radiative forcing.
You see, the theory goes that for every degree Celsius the planet warms, the air’s vapor-carrying capacity increases by a little more than 7%. More specifically, for every degree Celsius, the air temperature, T, increases, the vapor pressure, e, at which water vapor is in thermodynamic equilibrium with its condensed state — that is, there is as much water vaporizing as there is vapor condensing in a closed system — increases exponentially by ~7%. This local equilibrium state is called the saturation vapor pressure, denoted as es, and can be mathematically modeled using the Clausius-Clapeyron relation as follows:
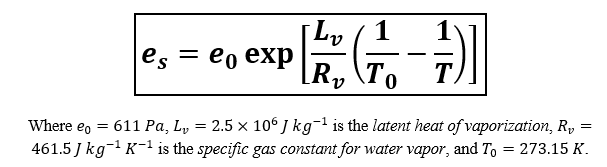
Author’s note: This form of the Clausius-Clapeyron equation is only valid for calculating saturation (equilibrium) vapor pressure over a flat surface of pure liquid water containing no impurities. A similar, albeit more complex equation containing correction factors for geometry and impurities is used for curved droplets, but the exponential relationship remains the same.
Since the maximum theoretical amount of water vapor that can evaporate into the air without condensing increases as a function of temperature, the IPCC and company argue that increased atmospheric warming will inevitably lead to heavier downpours and more frequent ones at that.
The problem with this assumption, of course, is that the Clausius-Clapeyron relation doesn’t tell us anything useful about precipitation totals or rainfall rates critical to Rx5day precipitation extremes, let alone precisely how much water (expressed in terms of vapor pressure, e) evaporates into the air at any given point in space or time. Simply put, just because more water vapor can occupy the air at higher temperatures does not mean that it will. Case in point, areas like Death Valley and the Saharan Desert are very hot and, therefore, have a very high equilibrium vapor pressure, but the overlying air in those regions contains very little moisture. Similarly, areas such as Chicago might have a higher vapor pressure even though the temperature might be 25-30°C or more lower than Death Valley.
My [now retired] professor covered this topic rather extensively in my undergraduate Cloud Physics and Precipitation Processes course, but it would seem that climate modelers either weren’t taught these physical concepts in university or simply didn’t pay any attention in class, explaining the disconnect between observed trends in the precipitation extremes across California and CMIP6 climate model projections.
The bottom line here is that evidence is weak to link any recent extreme rainfall in California associated with the stream of atmospheric rivers to anthropogenic climate change. It’s possible that there could be some effect, but it is negligible, and anything observed has not been outside the bounds of natural variability and randomness.
Final Remarks
None of the findings presented above should subtract any significance from the fact that atmospheric rivers produce inclement and often dangerous weather conditions that pose a serious risk to human life and property.
Whether or not climate change is having any meaningful impact on the extreme weather events we care about is irrelevant in the need to raise awareness of the fact that we continue to develop in disaster-prone areas and the necessity to improve societal resilience through better zoning codes and community planning. Mother Nature always has and always will throw curveballs in our direction, regardless of what the climate is doing in the long-term, and being better equipped to mitigate disaster losses or prevent them in the first place must be a focal point of engineers, emergency managers, and policymakers in the years and decades to come.
Sitting on our hands and blaming climate change for everything is really a waste of time that would be better spent finding solutions to real-world problems such that our children and grandchildren have a safer world to live in.
References:
[1] “California Snowpack Levels Visualization.” Engaging Data, March 4, 2024. https://engaging-data.com/california-snowpack-levels/.
[2] “ACIS Climate Maps.” High Plains Regional Climate Center, March 7, 2024. https://hprcc.unl.edu/maps.php?map=ACISClimateMaps.
[3] “Water Storage Tracking for Sierra Nevada and Upper Colorado River Basins.” California Nevada Applications Program, March 4, 2024. https://cnap.ucsd.edu/storage_in_sierra_ucrb/.
[4] Egan, Timothy. “The End of California?” The New York Times, May 1, 2015. https://www.nytimes.com/2015/05/03/opinion/sunday/the-end-of-california.html.
[5] Stockton, Nick. “Thanks El Niño, but California’s Drought Is Probably Forever.” Wired, May 13, 2016. https://www.wired.com/2016/05/thanks-el-nino-californias-drought-probably-forever/.
[6] Riganti, Curtis, and Denise Gutzmer. “California.” U.S. Drought Monitor, March 7, 2024. https://droughtmonitor.unl.edu/CurrentMap/StateDroughtMonitor.aspx?CA.
[7] Bittle, Jake. “California’s Atmospheric Rivers Are Getting Worse.” Wired, March 25, 2023. https://www.wired.com/story/california-atmospheric-river-climate-change/.
[8] Canon, Gabrielle. “Atmospheric River Storms Are Getting Stronger, and Deadlier. The Race to Understand Them Is On.” The Guardian, February 11, 2024. https://www.theguardian.com/science/2024/feb/11/atmospheric-river-pacific-storms-climate-crisis.
[9] Smith, Haley, and Grace Toohey. “El Niño and Climate Change Are Supercharging Incoming Storm, SoCal’s Biggest This Winter.” Los Angeles Times, February 2, 2024. https://www.latimes.com/environment/story/2024-02-02/el-nino-and-climate-change-are-supercharging-incoming-california-storm.
[10] Zhu, Yong, and Reginald E. Newell. “Atmospheric Rivers and Bombs.” Geophysical Research Letters 21, no. 18 (September 1, 1994): 1999–2002. https://doi.org/10.1029/94gl01710.
[11] Newell, Reginald E., Nicholas E. Newell, Yong Zhu, and Courtney Scott. “Tropospheric Rivers? – A Pilot Study.” Geophysical Research Letters 19, no. 24 (December 24, 1992): 2401–4. https://doi.org/10.1029/92gl02916.
[12] Serreze, Mark C., and Jennifer A. Francis. “The Arctic Amplification Debate.” Climatic Change 76, no. 3–4 (March 18, 2006): 241–64. https://doi.org/10.1007/s10584-005-9017-y.
[13] Serreze, M. C., A. P. Barrett, J. C. Stroeve, D. N. Kindig, and M. M. Holland. “The Emergence of Surface-Based Arctic Amplification.” The Cryosphere 3, no. 1 (February 4, 2009): 11–19. https://doi.org/10.5194/tc-3-11-2009.
[14] Rantanen, Mika, Alexey Yu. Karpechko, Antti Lipponen, Kalle Nordling, Otto Hyvärinen, Kimmo Ruosteenoja, Timo Vihma, and Ari Laaksonen. “The Arctic Has Warmed Nearly Four Times Faster than the Globe since 1979.” Communications Earth & Environment 3, no. 1 (August 11, 2022). https://doi.org/10.1038/s43247-022-00498-3.
[15] Lee, J.-Y., J. Marotzke, G. Bala, L. Cao, S. Corti, J.P. Dunne, F. Engelbrecht, E. Fischer, J.C. Fyfe, C. Jones, A. Maycock, J. Mutemi, O. Ndiaye, S. Panickal, and T. Zhou, 2021: Future Global Climate: Scenario-Based Projections and Near-Term Information. In Climate Change 2021: The Physical Science Basis. Contribution of Working Group I to the Sixth Assessment Report of the Intergovernmental Panel on Climate Change [Masson-Delmotte, V., P. Zhai, A. Pirani, S.L. Connors, C. Péan, S. Berger, N. Caud, Y. Chen, L. Goldfarb, M.I. Gomis, M. Huang, K. Leitzell, E. Lonnoy, J.B.R. Matthews, T.K. Maycock, T. Waterfield, O. Yelekçi, R. Yu, and B. Zhou (eds.)]. Cambridge University Press, Cambridge, United Kingdom and New York, NY, USA, pp. 553–672, doi: 10.1017/9781009157896.006.
[16] Seneviratne, S.I., X. Zhang, M. Adnan, W. Badi, C. Dereczynski, A. Di Luca, S. Ghosh, I. Iskandar, J. Kossin, S. Lewis, F. Otto, I. Pinto, M. Satoh, S.M. Vicente-Serrano, M. Wehner, and B. Zhou, 2021: Weather and Climate Extreme Events in a Changing Climate. In Climate Change 2021: The Physical Science Basis. Contribution of Working Group I to the Sixth Assessment Report of the Intergovernmental Panel on Climate Change[Masson-Delmotte, V., P. Zhai, A. Pirani, S.L. Connors, C. Péan, S. Berger, N. Caud, Y. Chen, L. Goldfarb, M.I. Gomis, M. Huang, K. Leitzell, E. Lonnoy, J.B.R. Matthews, T.K. Maycock, T. Waterfield, O. Yelekçi, R. Yu, and B. Zhou (eds.)]. Cambridge University Press, Cambridge, United Kingdom and New York, NY, USA, pp. 1513–1766, doi: 10.1017/9781009157896.013.
[17] “Access Data.” Climdex. Accessed March 8, 2024. https://www.climdex.org/access/.
[18] “IPCC AR6-WGI Atlas.” IPCC WGI Interactive Atlas. Accessed March 8, 2024. https://interactive-atlas.ipcc.ch/regional-information#eyJ0eXBlIjoiQVRMQVMiLCJjb21tb25zIjp7ImxhdCI6LTg5NjQ0NDMsImxuZyI6NDE2ODU4OCwiem9vbSI6NiwicHJvaiI6IkVQU0c6NTQwMzAiLCJtb2RlIjoiY29tcGxldGVfYXRsYXMifSwicHJpbWFyeSI6eyJzY2VuYXJpbyI6InNzcDU4NSIsInBlcmlvZCI6IjMiLCJzZWFzb24iOiJ5ZWFyIiwiZGF0YXNldCI6IkNNSVA2IiwidmFyaWFibGUiOiJSeDVkYXkiLCJ2YWx1ZVR5cGUiOiJSRUxBVElWRV9BTk9NQUxZIiwiaGF0Y2hpbmciOiJTSU1QTEUiLCJyZWdpb25TZXQiOiJhcjYiLCJiYXNlbGluZSI6InByZUluZHVzdHJpYWwiLCJyZWdpb25zU2VsZWN0ZWQiOltdfSwicGxvdCI6eyJhY3RpdmVUYWIiOiJwbHVtZSIsIm1hc2siOiJub25lIiwic2NhdHRlcllNYWciOm51bGwsInNjYXR0ZXJZVmFyIjpudWxsLCJzaG93aW5nIjpmYWxzZX19.