
- There are many similarities to some notable hyperactive seasons.
- A warm Atlantic Basin is already in place and no El Niño is expected.
- Weighting analogs points at highly active seasons.
- New Euro seasonal shows favorable MJO precipitation pattern for enhanced activity around North America.
- Our expectations of a big-ticket season have not changed from our March 10 outlook.
.png)
1) I want people to take a look at our ideas. When you read the discussion you will see that there are ideas in here you never see come forth. I like to try to show people what I am looking at.
2) If this forecast has merit, people will understand why the season turned out the way it did.
3) What is more predictable than the hurricane season is that any and every event will be whipped into a sign of man made climate change. In 2016, Hillary Clinton tried to use Hurricane Hermine, which TOOK 11 DAYS TO DEVELOP and was a CAT 1, as an example of what climate change can do. What, limit development for 11 days and only a category one at the peak of the season? It was stunning she would say that, but it revealed 2 things, 1) apparent ignorance of the fact that within 10 days of Sept 11 is when hurricanes are at their worst and Hermine was a big underachiever relative to that. 2) That any weather system no matter how average or expected can be weaponized.
Given our 2020 vision (clever eh) for this season, if the storms come, then the storm of climate change by people who just wait for something and then pounce, will reach feverish levels.
Equally important I want to show that there is a lot of research that is done behind the scenes by private sector meteorologists with no grants. Except that it has to have merit for people buy it. This is a bittersweet forecast. For no one wants to be wrong and I understand the implications of this being right. The return of hurricanes to the areas in the Caribbean devastated in 2017 for instance. There are ways out of this, as you will see in the discussion below, but the physical drivers that are responsible for this appear to be setting up. Interestingly enough, the same pattern that gives much of the country a “non winter” like this past winter gives a weaker hurricane season. However that is changing now and the tendency from now through Fall is liable to be opposite. By the way one notices in El Nino seasons, which help warm the planet, hurricane activity is down. A benefit to warming. La Nina seasons, where the planets temperatures back down a bit are often the opposite. The good and bad, and that is the point. No matter what happens, there are going to be examples positive and negative in relation to life. The unfortunate thing is many do not look behind the scenes to bring up the other side.
If you wish to see a video form of this, it will on our site for free https://www.weatherbell.com/
Scroll down to the Saturday Summary . It will be there till 6 pm Saturday
So here we go:
WeatherBell has been a pioneer in identifying the areas most susceptible to tropical cyclone impact during the preseason. Last year’s forecast showed the area where the ACE (accumulated cyclone energy) would be below normal but did not identify the above normal areas because the signal was quite weak for the first time in three years. So we forecasted a scattershot season, which I think we can agree we had.
For the current year, a higher number of storms and ACE is supported by very warm Atlantic and Gulf SSTs. The fact that many storms we could not see years ago are now seen and named with improved satellite instrumentation. In addition, very warm water near the coasts ups the ante for rapid feedback development. This is how we caught Imelda last year, and it’s fortunate the process waited until it was on land.
In April we are now identifying the areas we believe are at greatest risk for impacts. The danger of the current idea is the same kind of thing that thwarted the winter forecast (making a forecast off a forecast), but the forecasted SSTs are in line with hyperactive seasons.
The SST forecast has changed little. The CFSv2 forecast from early March:
.gif)
.gif)
.png)
.png)
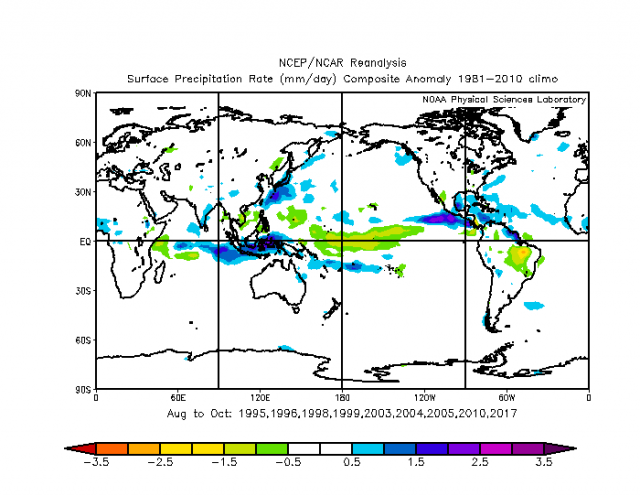
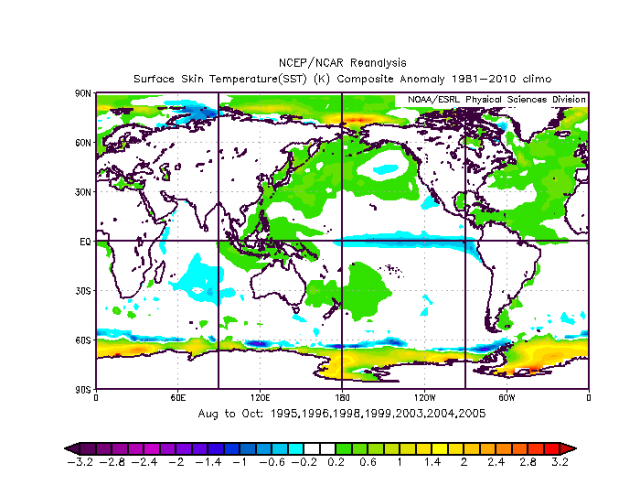
The hyperactive seasons of 1995, 1996, 1998, 1999, 2003, 2004, and 2005 had the warmer SSTs in the tropical Atlantic with the cooler (less warm) waters off the Southeast Coast.
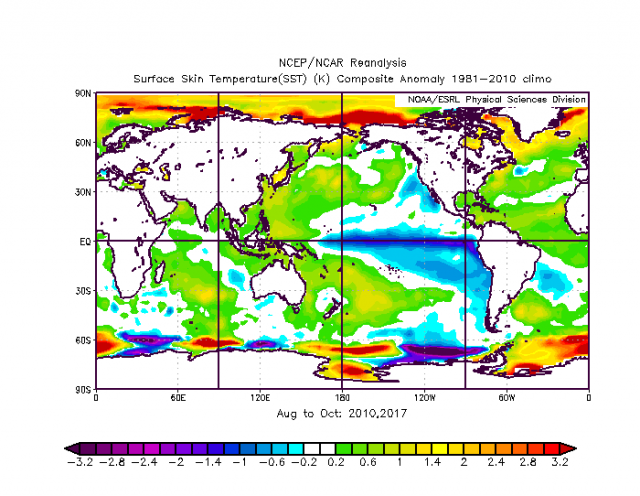
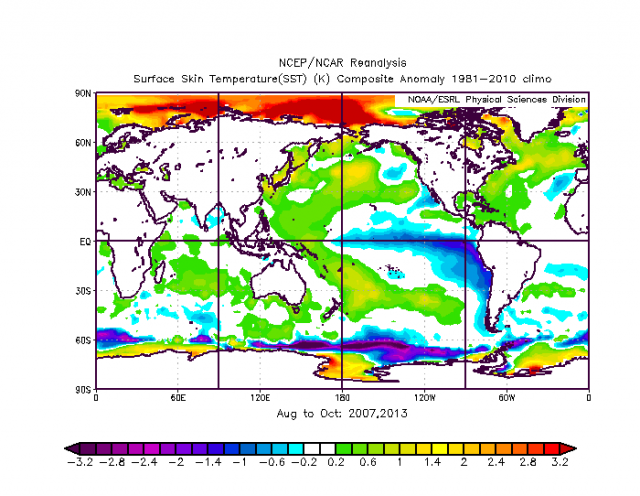
So out of the 10 samples, 3 have reason to hope for less 1) 2013, 2) 2010 the gentle giant season, alot of storms but no major hits, 2007
Certainly, the JMA upward motion chart for the summer season remains similar:
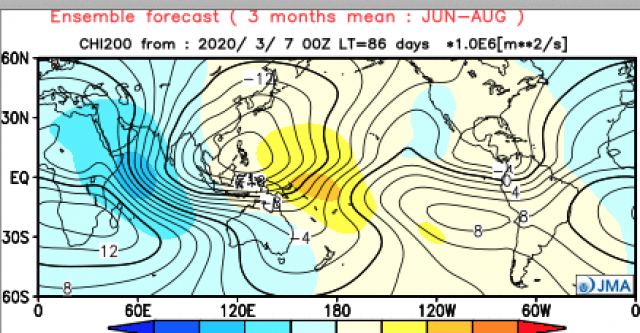
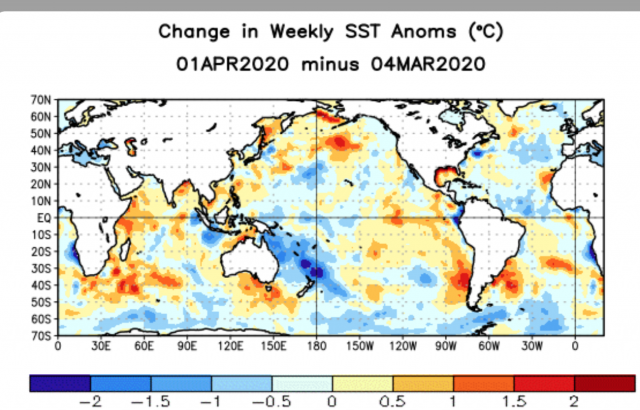
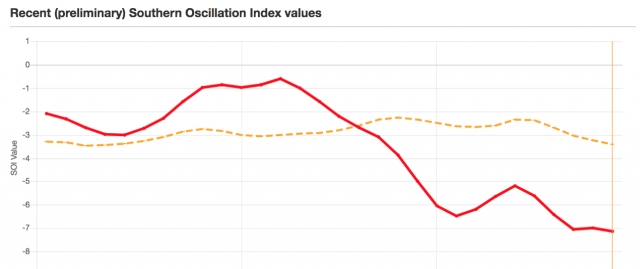
They have caused some warming farther to the east, as the NOAA ENSO discussion says:
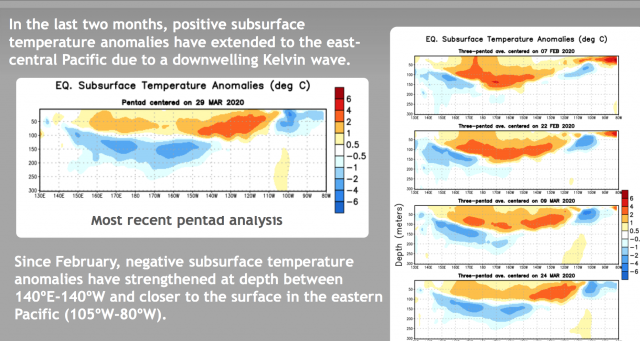
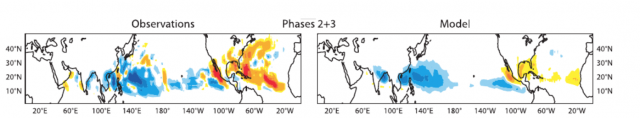
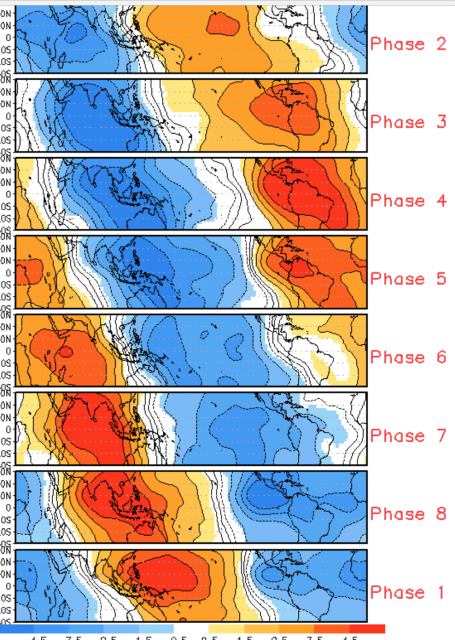
We may be seeing a big change in the MJO forcing, favoring the southern parts of the Western Hemisphere rather than the northern parts of the Eastern Hemisphere. Those are warm phases in winter and tend to limit tropical activity during the hurricane season.
So the analog years we are looking at are:
| Year | ACE | Named Storms | Hurricanes | Intense Hurricanes |
| 1995 | 227 | 19 | 11 | 5 |
| 1996 | 166 | 13 | 9 | 6 |
| 1998 | 182 | 14 | 10 | 3 |
| 1999 | 177 | 12 | 8 | 5 |
| 2003 | 177 | 16 | 7 | 3 |
| 2004 | 227 | 15 | 9 | 6 |
| 2005 | 250 | 28 | 15 | 7 |
| 2007 | 74 | 15 | 6 | 2 |
| 2010 | 165 | 19 | 12 | 5 |
| 2013 | 36 | 14 | 2 | 0 |
| 2017 | 225 | 17 | 10 | 6 |
| Average | 173 | 16.5 | 9 | 4.4 |
Landfall chart of hurricanes and intensity in these years:
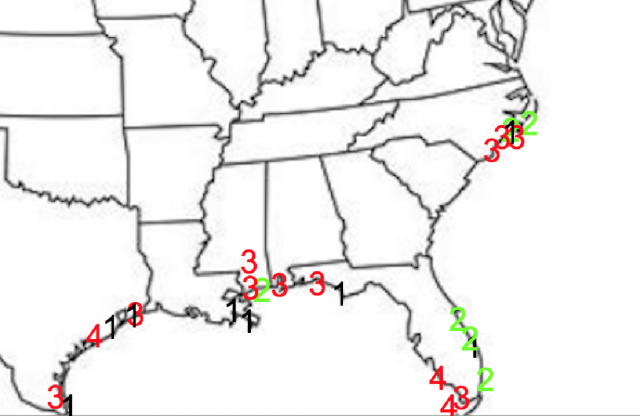
Given the precipitation and pressure patterns, the hints are there.
About 25 hurricanes hit the U.S. in the analog years with about half of them being major storms. So 2-3 landfalling hurricanes, with 1-2 being major hurricanes is the current idea. There are four areas that were targeted in the analog years: Texas, the central Gulf Coast, southern Florida, and the North Carolina Outer Banks. None in these years broke out of the pack and hit New England, and you have to wonder how long that can be the case, though we did have a weakened Irene and Sandy in non-analog years.
The Verdict
The danger of making a forecast off of a forecast is there, along with the possibility of a year where next to nothing happens despite great similarities to the hyperactive years. For now, we have high totals because of the similarities to the hyperactive years.
With the warm Atlantic Basin SSTs already in place, no El Niño, and an upward motion forecast that looks like a favorable MJO pattern for the hurricane season, this first “vision” of 2020 is for a big season. We can have big seasons like 2010, where next to nothing hit land, but chances are staying in the middle like we are doing would serve us well. The closest most recent season to this is 2017.
Notes and asides
The discussion about our Power and Impact Scale can be found in forecast discussions from previous years.